


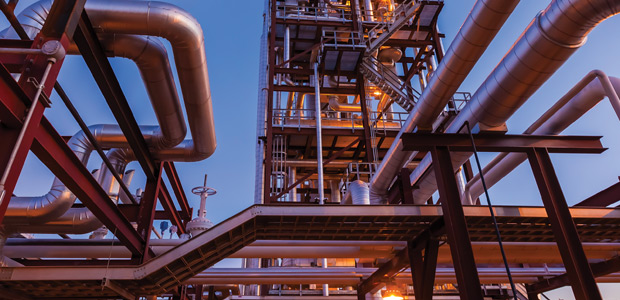
Industry Infrastructure
New Modeling Approach Improves Economic Analyses Of Gas Processing, NGL Recovery
By Kelly Van Hull
HOUSTON–Spot prices for heavy natural gas liquids–propane, butanes and natural gasoline–have risen sharply since the middle of 2017, with Mont Belvieu, Tx., spot prices averaging 30-40 percent more in mid-February 2018 than they had been in mid-June of last year.
Rapidly expanding U.S. natural gas production is driving NGL production at the 800-plus processing plants across the country to all-time highs exceeding 4 million barrels a day. At the same time, however, surging supplies also are suppressing natural gas prices, and this scenario is likely to continue with year-over-year production growth forecast over at least the next couple years. So how do these market dynamics play out for gas processing economics?
The short answer is that the value of extracting NGLs from the gas stream is playing out pretty darn good for heavy NGLs, but generally not so well for ethane recovery. Ethane has been the victim of overabundant supplies in a market in which demand has been constrained by petrochemical and transportation infrastructure limitations that are only now beginning to ease as new plant and pipeline capacity comes online.
When it comes to making decisions on gas processing strategies, the critical need for producers and processors is better understanding all of the factors that can influence processing economics, and how their interrelated relationships can impact bottom-line profitability. The frac spread is the standard method of assessing the relationship between the weighted average price of NGLs and natural gas on a Btu basis. In general, the frac spread calculation shows that things are looking up for processing economics.
But while the frac spread is a good indicator of the relative health of natural gas processing over time, it is not representative of the processing margin for a particular stream of inlet gas. That is because it does not take into account the quality of the gas being processed in terms of the liquids and Btu content, nor does it factor in a plant’s operating efficiency or other key factors that ultimately determine the quantity and value of the NGLs that a processing plant can produce from a given inlet gas stream. To optimize the economic analysis, a more sophisticated processing model is needed that goes deeper than a simple frac spread to combine measurement, quantity, quality and value (MQQV) factors in assessing processing plant economics and answering such questions as whether ethane recovery or rejection would be more profitable for a given plant.
Calculating The Uplift
There is no such thing as a “typical” inlet stream, but a breakdown of 80 percent methane, 15 percent NGLs (ethane, propane, normal butane, isobutane and natural gasoline) and 5 percent impurities is representative of the rich gas produced in many shale plays. Determining when NGL extraction will make money, and what factors go into calculating the economic uplift from processing a particular inlet gas stream at a given plant, is where the MQQV approach comes in.
Gas processing economics are all about converting hydrocarbons from one state (gas) to another (liquids) and understanding how much energy each gas and liquid component contains. NGLs enter the processing plant as gas in the inlet stream, and then are extracted and converted, exiting the plant as liquids. At every stage in the process, gases and liquids have measurable energy contents.
The first step in the MQQV approach is defining the quantity or volume of liquid per volume of gas, the energy content per volume of gas, or the energy content per volume of liquids for all of the NGLs, expressed as:
- Gallons of liquids per Mcf of gas (GPM). A gas stream with 3 GPM or higher probably requires processing, while processing may be optional for 1-2 GPM and is not required for a 1 GPM lean stream.
- Btus per cubic foot of gas. Natural gas at the plant tailgate has a Btu content of somewhere between 1,000 and 1,100 Btus per cubic foot, typically 1,028 Btus. That is a representative spec for a natural gas transmission pipeline. At the plant inlet, Btu content can vary greatly depending on the GPM and the composition of the NGL barrel. Leaner gas may have a Btu content of 1,100 or less, while richer gas might have a Btu content well in excess of 1,300 GPM.
- Btus per gallon of NGLs. The GPA Midstream Association publishes an official standard of Btus per gallon for each of the five NGLs based on the chemical properties of 100 percent purity, and although no NGL is truly pure, these values are more precise than the approximations used in a frac spread calculation.
The “quantity per volume” conversion from gas to liquids is complicated. In layman’s terms, conversion starts with understanding that any substance condenses from a gas to a liquid (or liquid to a gas) at a certain boiling point. However, the ethane liquid condensed from a cubic foot of ethane gas produces a different volume than propane liquid condensed from a cubic foot of propane gas. In other words, the volumes of gas and liquids that result from conversion are different, depending on the molecular properties of the substance.
Crucial To Plant Economics
Converting between volumes of gas and volumes of liquids for NGL processing starts with the mole, which is defined as the quantity of a substance that has the same number of particles found in 12 grams of carbon-12. In gas processing, the pound-mole always occupies 379.48 standard cubic feet at standard temperature and pressure.
TABLE 1
GPA Midstream Gallons/Pound-Mole Standards
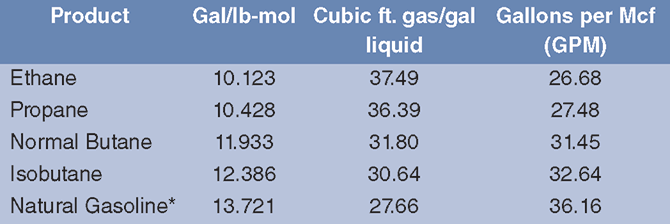
*Normal Pentane
In addition to the cubic feet per pound-mole factor, each hydrocarbon also has a gallons per pound-mole. The second column in Table 1 shows the gallons/pound-mole for each NGL based on GPA Midstream Standard 2145-16. With the factors known, inlet gas can be converted to gallons of NGLs. To arrive at cubic feet of gas per gallon of NGL, the constant cubic foot/pound-mole factor (379.48) is divided by gallons/pound-mole. To get GPM (fourth column), the value in the second column is divided by the cubic foot/pound-mole factor and multiplied by 1,000.
The law of the conservation of energy states that energy is neither created nor destroyed, but is merely converted from one form to another. In gas processing, some of the energy of the inlet gas stream is converted into natural gas liquids. Keeping this in mind, although ethane can be left in the residue gas stream, the higher Btu/gallon content of heavier NGLs means that very little propane, butanes or natural gasoline can be left in the residue stream if the gas is to meet dry gas pipeline specs.
Low ethane prices can make ethane recovery negative for processing economics. Simply put, the Btu content of the ethane is worth more in the gas stream than as an extracted liquid. Consequently, where possible, producers are rejecting ethane (thereby receiving natural gas prices for those Btus) rather than recovering it (and selling it along with the other liquids). However, rejecting ethane also reduces the total gallons of NGLs recovered from the plant, and recovering too little ethane can cause the residue gas to exceed pipeline Btu specs.
Accordingly, the decision to reject or recover ethane is a balancing act between Btu pipeline specs and economics. Understanding how processing plant designs, pipeline specs and economics play into deciding whether to extract or reject ethane is where the quantity, quality and value principles come into play.
Ethane Infrastructure
Before discussing the value of ethane rejection versus recovery, it is important to note that this article assesses the relative economics under prevailing market conditions. The good news is that a major growth cycle is under-way in the U.S. ethane market. Construction was completed in 2017 on three new Texas Gulf Coast ethylene crackers (the first crackers built in the United States since 2001). These plants are the first of a series of new crackers expected to be on line by the end of 2019 that collectively will expand U.S. ethane consumption by some 600,000 barrels a day.
Ethane exports also are projected to continue climbing, with average annual exports increasing from 180,000 bbl/d last year to 350,000 bbl/d in 2019. That includes pipeline exports as well as tanker shipments from dedicated terminals at Marcus Hook in Pennsylvania and Morgan’s Point in Texas. Shipments from these facilities are supplying U.S. ethane to the United Kingdom, Norway, Sweden, India and Brazil, and soon may begin reaching China and other markets.
Production growth from the Marcellus and Utica plays has made the Appalachian region the focal point of NGL infrastructure development. Existing NGL pipelines include the 50,000 bbl/d Mariner West, the 125,000 bbl/d ATEX, the 50,000 bbl/d TEPPCO, the 70,000 bbl/d Mariner East, the 50,000 bbl/d Utopia, and the 70,000 bbl/d Cornerstone systems. In addition, the 275,000 bbl/d Mariner East II and 250,000 bbl/d Mariner East IIX pipelines are scheduled to enter service in the coming year.
In addition, large-scale crackers have been proposed or are under development in the Appalachian region. These include Shell Chemicals’ 1.6 million metric ton/year plant in Pennsylvania (with the capacity to consume 96,000 bbl/d of ethane feedstock), which is currently under construction, and a proposed PTT Global/Marubeni joint venture to build a 1.0 million metric ton/year plant in Ohio (60,000 bbl/d of ethane).
However, the Northeast is hardly the only region to see new NGL infrastructure development. One of the most recent examples is ONEOK’s Elk Creek Pipeline, which the company announced in January. The 900-mile, 20-inch pipeline will run from eastern Montana through Wyoming and the northeastern corner of Colorado to the Conway/Bushton fractionation hub in Kansas, providing new capacity for producers in the pipeline-constrained Williston, Powder River and Denver-Julesburg basins. Initial planned capacity is 240,000 bbl/d of y-grade NGLs, expandable to 400,000 bbl/d.
But as NGL production continues to grow and significant incremental ethane demand and transportation capacity are only now starting to come on line, there is a limit to how much ethane can be left in the residue gas stream without violating pipeline Btu specifications. How do all the various factors come together to determine whether more value will be created by rejecting or recovering ethane at a given gas processing plant?
Eagle Ford Plant Example
Table 2 shows a hypothetical example of 200 million cubic feet a day of gas running through an Eagle Ford cryogenic processing plant. In this case, the plant is recovering 90 percent of the ethane and 99 percent of the propane, butanes and natural gasoline. The upper section of Table 2 provides the recovered gallons of each NGL (green oval), which then is used in the value analysis to calculate the dollars per day ($/d) of value created by selling the NGLs at market prices.
TABLE 2
Quantity and Residue Gas Tables
(90 percent Ethane Recovery)
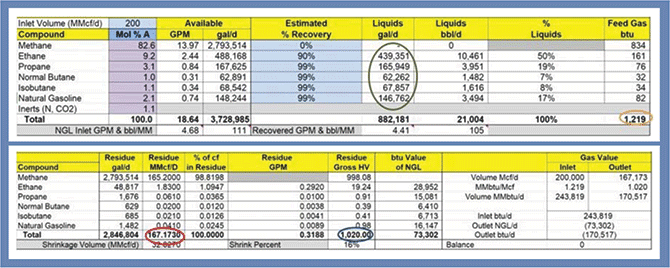
The column to the far right also gives the Btu content of the feed gas byproduct and the total Btus of 1,219 Btu/cubic foot for the feed gas (orange oval), which can be used to calculate the cost of the inlet gas stream. The red oval in the lower section of Table 2 denotes the volume (167 MMcf/d) while the blue oval shows the Btu content of the residue gas (1,020 Btu/cubic foot), which are then used to determine the sales value of the residue gas after removing NGLs.
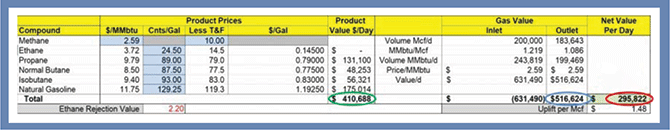
Table 3 shows the natural gas processing value calculation for the Eagle Ford plant with 90 percent ethane recovery, which brings all the analysis together to answer the question of how much money can be made producing ethane versus rejecting. The blue cells on the left-hand side are all the inputs needed to make the calculations. The price of methane (red oval) is the spot price of Henry Hub natural gas on Feb. 13, while Mont Belvieu NGLs prices on the same date are in the green oval.
The purple oval is the transportation and fractionation (T&F) charge to get the y-grade NGLs transported to and fractionated at Mont Belvieu. In this case, the analysis assumes a $0.05/gallon cost to transport NGLs by pipeline and a $0.05/gallon fractionation fee to separate into purity products ($0.10/gallon total).
TABLE 3
Value Table
(90 percent Ethane Recovery)
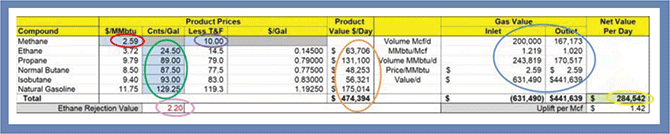
Assuming no plant fuel or loss, contractual processing rights, water content or other engineering refinements, the orange oval shows the $/d value created by processing the gas to strip the NGLs and sell each NGL and residue gas separately at market prices. Recovering 90 percent of the ethane and selling those gallons at market prices would create $63,706/d from 439,351 gallons of recovered ethane.
The ethane rejection value (pink circle) converts the price of ethane from cents/gallon to dollars/MMBtu after factoring in the T&F charge to provide a relative comparison to the price of natural gas. If the ethane rejection value is less than the $2.59/MMBtu price of methane (which it is in this case), the economics of rejecting ethane are better than recovering it.
To illustrate, the blue oval denotes the cost of inlet gas and the dollars created by selling the residue gas. For both inlet and outlet gas calculations, the volume of gas in Mcf/d is multiplied by the MMBtu/Mcf to get an MMBtu/d, which then is multiplied by the price of methane to come up with a $/d value to purchase the inlet gas ($631,490) and a sales price for the residue gas ($441,639). To get to the net $284,542/d value created (yellow oval), the value created by selling the NGLs and the residue gas stream is subtracted from the amount it costs to buy the inlet gas.
TABLE 4
Quantity and Residue Gas Tables
(0 percent Ethane Recovery)
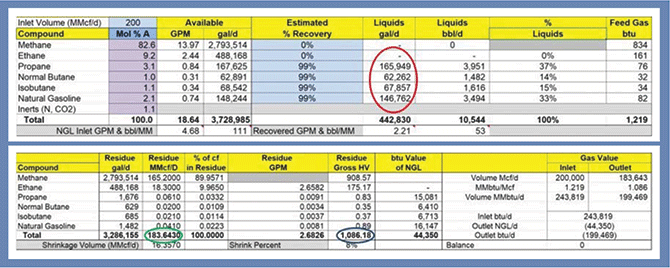
What happens to the net value created by processing the sample inlet gas stream to recover none of the ethane instead of 90 percent? Table 4 shows the quantity and residue gas tables with 0 percent ethane recovery. As noted in the red oval in the top section, no liquid ethane gallons are recovered since all ethane is left in the residue gas stream. Because ethane has a higher heat content than methane, the blue oval in the lower table shows that ethane rejection increases the Btu content of the residue gas from 1,020 to 1,086 Btu/cubic foot. The volume of residue gas also is greater with no ethane recovery (green oval).
Table 5 shows the value creation table with no ethane recovery. Note that the total value created by selling the NGLs (green oval) is lower than with 90 percent recovery because the ethane is no longer being sold. Also, the outlet gas is now worth more (blue oval) than with 90 percent recovery since the rejected ethane is being sold along with the methane in the outlet gas. The net value created is $295,822/d (red oval) when recovering 0 percent ethane, which is $11,280 more than in the 90 percent ethane recovery example.
TABLE 5
Value Table
(0 percent Ethane Recovery)
That is not much of a bonus for rejecting ethane. However, the farther away from market and the higher the transportation cost, the more compelling the economics of ethane rejection become. Consider a hypothetical example of gas being processed in the Bakken Shale instead of the Eagle Ford. Rather than a $0.05/gallon pipeline transportation charge to get the NGL barrels to Mont Belvieu, it would cost $0.26/gallon to get to Mont Belvieu through three separate pipeline interconnects, in addition to the $0.05/gallon fractionation fee. That would increase the T&F charge to $0.31/gallon, or $0.21/gallon higher than in the Eagle Ford case.
Keeping all other data points the same as in the Eagle Ford example except for the higher T&F costs, the net value per day of recovering 90 percent of the ethane would be reduced to $99,284, compared with $284,542 for the Eagle Ford plant. It hurts a lot having to pay higher transportation costs on NGLs! If all the ethane was rejected, the net value per day would be $202,827, still well below the Eagle Ford case but $103,543 more than when recovering 90 percent of the ethane. In fact, in the hypothetical illustration, the cost of recovering and transporting the ethane from North Dakota would exceed its value at Mont Belvieu using mid-February posted gas and NGL prices.
There are a number of other considerations that figure into processing strategies and designs, including agreements between the producer and processor and pipeline minimum volume commitments, but using a modeling approach that includes measurement, quantity, quality and value considerations brings greater clarity to processing economics for improved decision making.

KELLY VAN HULL is director of energy analytics at RBN Energy, responsible for developing and updating the company’s NGL models for all major U.S. basins. She also plays a lead role in NGL-focused consulting engagements. Prior to joining RBN Energy in 2013, Van Hull worked for BENTEK Energy, where she developed and implemented U.S. NGL supply/demand models and market fundamentals. Van Hull began her career developing greenfield projects in the Williston Basin for Saddle Butte Pipeline. She holds a B.A. in economics from the University of Michigan.
For other great articles about exploration, drilling, completions and production, subscribe to The American Oil & Gas Reporter and bookmark www.aogr.com.