


2014 Drilling Outlook
North America’s Independents Reveal Diverse Drilling Plans, Heavy-Metal Activity Tool Kits In AOGR’s 2014 Activity Survey
By Bill Campbell
It’s no secret that tight-oil resource plays will again dominate drilling dollars spent during 2014 in America. Industry analysts and government agencies show the United States already is the undisputed heavy-weight champion as the world’s largest producer of petroleum and natural gas. The rate of America’s crude oil growth is unparalleled.
New York-based energy consultants PIRA Energy Group pegs U.S. total supply growth in 2013 at 1 million barrels a day, greater than the sum of the production growth of the next nine fastest growing countries combined. U.S. Energy Information Administration data show U.S. crude oil and condensate production has surpassed that of Saudi Arabia and Russia, while America’s natural gas production widened over Russia’s throughout 2013, as oil-directed drilling put significant supplies of associated gas production in the pipeline.
The table is set for continued growth in demand for natural gas for power generation, manufacturing, as a vehicle fuel option, and the long-range promise of liquefied natural gas exports. This may help explain one of the pleasant surprises in The American Oil & Gas Reporter’s annual Survey of Independent Operators. Oil and gas producer and operator respondents say they will continue to ratchet up conventional oil drilling while returning to dry gas directed drilling, complementing the growth in production from the unconventional resource plays that are driving the United States toward energy self-sufficiency.
For the fifth consecutive year, respondents to AOGR’s survey project a double-digit increase in the number of wells they anticipate drilling over the next 12 months. In aggregate, survey respondents predict they will drill 29.2 percent more wells in 2014 than they drilled in 2013.
Those results are corroborated by other analyses. For example, in its Global 2014 E&P Spending Outlook, Barclays Capital Inc. projects global exploration, drilling and production spending this year will reach a record $723 billion, up 6.1 percent from $682 billion last year. Leading that charge, according to Barclays, will be North American–and especially–U.S. drilling.
Following what it calls a “modest pause in spending growth in 2013,” Barclays says it anticipates spending in the United States to accelerate by 8.5 percent this year, while Canada should return to more modest 3.2 percent growth.
“Independent producers will take the lead in pushing capital spending higher in North America,” the survey states. “The industry is in the early days of a prolonged upcycle, in our view, backed by a reacceleration of exploration and production spending in North America and further robust outlays in the international market.”
Barclays adds, “We think spending gains in the Permian Basin will outpace the rest of the market, and are also bullish on activity levels in the Bakken, Eagle Ford, Niobrara and Granite Wash.”
Barclays says it surveys more than 300 oil and gas companies worldwide for its annual exploration, drilling and production spending outlook, adding it attempts to include “all meaningful spenders on worldwide exploration and production.” Since 2000, Barclays notes, there were only two years in which capital spending growth did not meet or exceed its survey forecasts.
AOGR’s Survey of Independent Operators is mailed nationwide to producers selected at random from the magazines’ subscription list. No attempt is made to identify survey respondents, and AOGR staff compile and analyze the data. The survey does not account for dry holes, and merely asks operators what the intended target is when a well is spudded. Because of its random nature, AOGR’s survey tends to be weighted more toward the great preponderance of smaller, privately held oil and gas companies in the United States.
Respondents to the 2014 Survey of Independent Operators drilled an average of 11.7 wells in 2013 and project they will drill an average of 15.1 wells this year. Respondents targeted crude oil on 78.9 percent of their 2013 wells and say they expect to target crude oil on 87.8 percent of their 2014 wells. Nearly three-fourths (73.6 percent) of respondents’ 2013 wells were vertical, and vertical drilling comprises 66.2 percent of respondents’ planned 2014 drilling.
Respondents to the 2014 survey have been grouped into six categories for purposes of comparison. Category one respondents expect to drill 0-9 wells this year, while category two respondents will drill 10 or more. Respondents in the oil category targeted crude oil on more than half their 2013 wells, while companies in the gas category either drilled some gas wells in 2013 or anticipate drilling some gas wells in 2014. Likewise, the unconventional category of respondents drilled at least one unconventional well in 2013 or expects to do so in 2014, while respondents in the horizontal category drilled at least one horizontal well in 2013 or plan to drill one or more in 2014.
Drilling Analysis
The remarkable resurgence in U.S. oil and gas production over the past decade generally is attributed to the unconventional resource development revolution made possible by advances in horizontal drilling and hydraulic fracturing technology. Consistent with that, the unconventional and horizontal categories of AOGR survey respondents have the most upbeat outlooks on 2014 drilling, with both projecting a 48.2 percent increase over 2013 (Figure 1).
FIGURE 1
Change in Operators’ Planned 2014 Drilling Compared with 2013 Actual Drilling
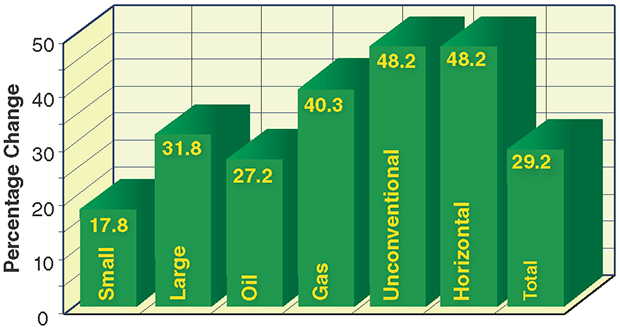
Respondents designated as “Small” are those that plan to drill 0-9 wells in 2014. Respondents designated as “Large” plan to drill 10 or more. All respondents that drilled any natural gas wells in 2013 or indicate they plan to drill any natural gas wells in 2014 are included in the “Gas” category, while those designated as “Oil” targeted crude oil on more than half of their 2013 wells. All respondents that reported drilling any horizontal wells in 2013 or that plan to drill any horizontal wells in 2014 are included in the “Horizontal” category. Likewise, those included in the “Unconventional” category drilled at least one unconventional oil or gas well in 2013 and/or indicate plans to do so in 2014.
The more active drillers in category two, which report drilling a greater proportion of horizontal and unconventional wells (28 and 26 percent, respectively) last year than category one operators (19 percent each), project a 31.8 percent increase in drilling activity this year, compared with 17.8 percent for category one respondents.
Ironically, the gas driller category projects a larger increase (40.3 percent) than does the oil category (27.2 percent). Tudor, Pickering, Holt & Co., offers one possible explanation for that. A press report on an analysis described by Jeff Tillery, Tudor Pickering’s head of oil field services research, as based on an informal survey of investors, suggests, “Some pure-play natural gas drillers have decided to get back into the game.”
In a late November conference call, Matt Portillo, who directs exploration and production research for Tudor Pickering, told reporters that a lot of the natural gas exploration and production companies had decided “they have rigs and if they have capital, gas drilling is what they are going to be able to do.”
The Tudor Pickering analysts also advised reporters that while their expectations for the international oil companies’ U.S. onshore capital expenditures in 2014 were “flat to maybe modestly lower,” their forecast for independents was growth in the “mid to high single digits–5-8 percent.”
Tudor Pickering is especially bullish on the Permian Basin, Bakken and Utica shales, and South-Central Oklahoma. The firm says the Eagle Ford Shale, Marcellus Shale, and Mississippian Lime all look “flattish,” while the Mid-Continent, “including the aggregate Wash plays, may be up marginally.”
Gas category drillers in the AOGR survey targeted either conventional natural gas, unconventional dry gas or unconventional wet gas on 20.9 percent of their 2013 wells. That goes to 24.6 percent in 2014. There is also a 4.0 percentage point increase in unconventional dry and wet gas drilling within the unconventional category of survey respondents, and a 3.7 percent increase in natural gas-directed drilling for the horizontal category.
Oil drillers, meanwhile, targeted conventional or unconventional crude oil on 91.6 percent of their 2013 wells and will do so on 93.0 percent this year, according to the Survey of Independent Operators.
Drilling, Spending Plans
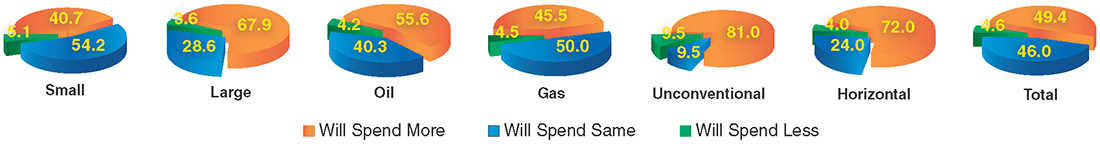
Slightly more than half of AOGR survey respondents plan to drill more wells in 2014 than they did in 2013 (Figure 2), while slightly fewer than half anticipate spending more (Figure 3). Another one-third of survey respondents indicate they will drill the same number of wells this year as last, while 46.0 percent say their drilling budgets will remain the same. Only 4.6 percent of AOGR respondents say they will spend less on drilling this year, while just 13.8 percent expect to drill fewer wells.
FIGURE 2
Operators’ 2014 Drilling Plans Compared with 2013
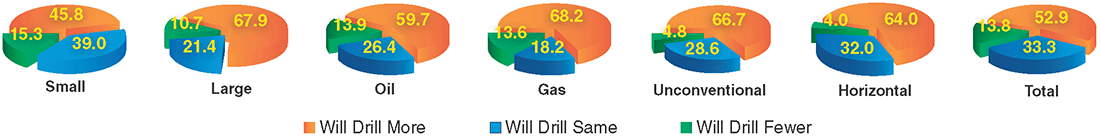
FIGURE 3
Operators’ 2014 Spending Plans Compared with 2013
By category, 68.2 percent of gas drillers say they will drill more wells this year than last, followed by category 2 (large) respondents at 67.9 percent, unconventional drillers at 66.7 percent, horizontal drillers at 64.0 percent, and oil drillers at 59.7 percent. Only 45.8 percent of category one (small) respondents indicate plans to drill more wells this year than in 2013.
In terms of drilling budgets, the unconventional and horizontal driller categories are out front with 81.0 and 72.0 percent projecting increases, respectively. Within the oil category, 55.6 percent plan to spend more this year, compared with 45.5 percent of the gas category. And 67.9 percent of category two respondents report larger drilling budgets this year, compared with 40.7 percent of category one respondents.
Although a slightly different metric, Barclays reports that 53 percent of the companies it surveys anticipate stable or decreased exploration budgets (as a percentage of total upstream CAPEX) this year, compared with 42 percent last year.
Elsewhere in its report, Barclays comments, “We believe the mix of spending is poised to shift away from large infrastructure projects toward greater drilling, evaluation and completion activity. We think the modest pause in spending growth in 2013 was the result of a combination of factors, including drilling and well servicing efficiencies in the land market, which enabled (oil and gas companies) to realize lower costs.”
It adds, “U.S. land spending in 2014 will be characterized by a shift toward full-scale development drilling as North American independents address the growing inventory of undrilled wells in their acreage.”
That is consistent with the mix of exploratory and developmental drilling projected by AOGR survey respondents. Last year, respondents report, 25.5 percent of their wellbores were exploratory, while they project only 18.3 percent wildcats in 2014. Unconventional and horizontal well drillers do the least amount of wildcatting at 8.5 and 16.3 percent in 2013, respectively. Those percentages drop to 4.5 and 8.5 in 2014.
At 35.3 percent in 2013 and 24.9 percent in 2014, category one respondents are more focused on exploratory drilling than are category two respondents at 23.7 and 17.3 percent, respectively. Oil drillers report 25.5 percent wildcats in 2013 and 18.8 percent in 2014; gas drillers report 18.4 percent in 2013 and 14.4 percent in 2014.
With respect to service costs, Barclays says its survey results show that oil and gas companies generally are expecting prices to increase in 2014, including 40 percent of worldwide respondents who anticipate higher stimulation and drilling costs.
“We expect high levels of utilization will drive prices higher internationally across the full array of service and equipment product lines,” the survey states. “We believe capacity for well servicing and stimulation will tighten in 2014, and price increases may follow. Day rates for land rigs will increase modestly as a higher percentage of the industry fleet will be made up of high-spec units that command better pricing.”
Price Expectations
Perhaps the area of greatest similarity between the AOGR and Barclays surveys are respondents’ price projections. AOGR respondents indicate their 2014 drilling plans are based on a West Texas Intermediate spot price at Cushing, Ok., of $86.87 a barrel, while Barclays respondents are projecting a 2014 average WTI price of $89.44.
Barclays calls that projection conservative and says it “supports our view that the industry can withstand moderate commodity price volatility and a modest drop in prices . . . without impacting upstream activity.”
That conservatism is historical, Barclays notes, pointing out that since 2008, its survey respondents have projected crude oil prices that ranged between 6.1 and 31.9 percent less than the actual yearly average prices. For 2013, Barclays survey respondents projected a WTI price of $84.51, which was 13.8 percent less than the firm’s projected 2013 average price of $98.00 a barrel. AOGR survey respondents predicted an average WTI spot price of $83.77 for 2013.
For natural gas, AOGR survey respondents are projecting $3.67 an Mcf while Barclays respondents say they expect a Henry Hub price averaging $3.66 an MMBtu. Natural gas prices have been a little harder to gauge over the years, according to Barclays.
“From 2009 to 2012, (operators) significantly overestimated the price of natural gas when planning their upcoming year’s budgets by an average of 31 percent,” the firm says. “It appears the trend of excessive optimism surrounding natural gas prices reversed course in 2013. Henry Hub prices have averaged $3.69 an MMBtu year to date (report dated Dec. 9, 2013), which is 6 percent higher than the initial price assumption offered a year ago.”
Barclays says its survey respondents projected a natural gas price of $3.47 an MMBtu for 2013. AOGR survey respondents based their 2013 drilling plans on $3.87 an Mcf. Barclays is predicting a 2013 annual average natural gas price of $3.88 an MMBtu.
AOGR and Barclays also both ask respondents to indicate what crude oil and natural gas prices would prompt them to either increase or decrease their drilling plans for the coming year.
For natural gas, Barclays reports its North American respondents suggest the average price that likely would lead to higher upstream spending is $4.57 an MMBtu. The firm adds that 25 percent of North American E&Ps would consider boosting upstream spending if Henry Hub prices averaged $4.00.
FIGURE 4A
Natural Gas Prices at Which Operators
Would Alter 2014 Drilling Plans
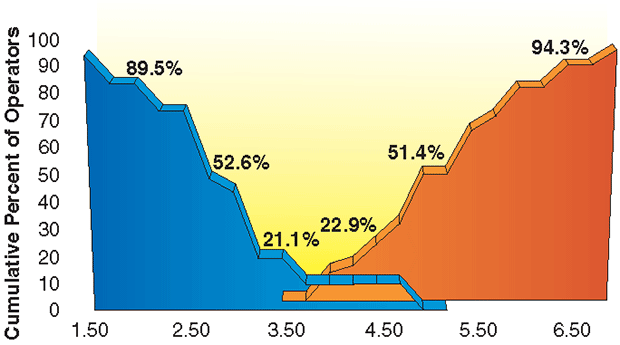
Percentages in Figures 4A and 4B represent the cumulative total of survey respondents that indicate they would have altered their 2014 drilling plans by the time the wellhead natural gas price (Figure 4A) or the spot price for West Texas Intermediate crude oil delivered at Cushing, Ok. (Figure 4B), reached the indicated amount. Prices at which drilling would decrease are plotted to the left of the graphs in downward curves; prices at which drilling would increase are plotted to the right of the graphs in upward curves.
This compares with 11.4 percent of AOGR respondents who indicate they would increase drilling at $4.00 an Mcf (Figure 4A). That number increases to 22.9 percent at $4.50 an Mcf, to 31.4 percent at $4.75 and to 51.4 percent at $5.00 an Mcf. Three-fourths of AOGR survey respondents say they would increase their projected drilling at a gas price of $5.75 an Mcf, and 94.3 percent would do so at $6.50.
Conversely, Barclays says, “The average operator we surveyed indicated he would not cut back on spending plans unless the price for natural gas averaged $3.16 an MMBtu.”
Among AOGR respondents, 10.5 percent say they would cut back gas-directed drilling at $5.75 an Mcf, but that remains flat until jumping to 21.1 percent at $3.50 an Mcf. As prices continue to decline, 52.6 percent of AOGR respondents would cut back drilling plans at a gas price of $2.75. This increases to 78.9 percent at $2.50 and to 89.5 percent at $2.00 an Mcf.
Oil Price Outlook
For crude oil, Barclays says, “The average (operator) benchmarking off WTI would boost CAPEX if WTI averages $107 a barrel this year.”
The firm notes that 47 percent of its respondents say they would increase upstream spending at $100. This rises to a cumulative 82 percent at $110 a barrel.
Among AOGR respondents, 32.7 percent say they would increase drilling at a crude oil price of $100 a barrel (Figure 4B). At $105, 56.4 percent of AOGR respondents say they would drill more wells. That percentage rises to 78.2 at $110, and to 90.1 at $115 a barrel.
FIGURE 4B
Crude Oil Prices at Which Operators
Would Alter 2014 Drilling Plans
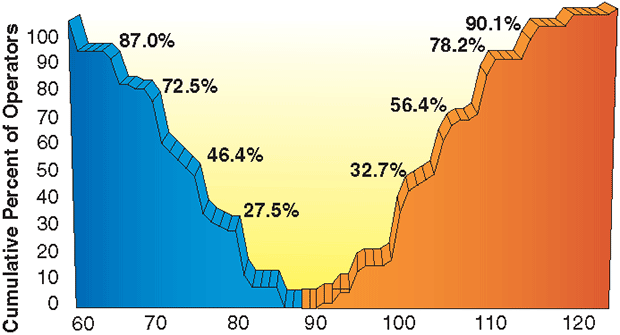
Percentages in Figures 4A and 4B represent the cumulative total of survey respondents that indicate they would have altered their 2014 drilling plans by the time the wellhead natural gas price (Figure 4A) or the spot price for West Texas Intermediate crude oil delivered at Cushing, Ok. (Figure 4B), reached the indicated amount. Prices at which drilling would decrease are plotted to the left of the graphs in downward curves; prices at which drilling would increase are plotted to the right of the graphs in upward curves.
Going the other way, Barclays says, “The price at which most (operators) would begin reducing CAPEX is . . . $74 a barrel,” which the firm notes was 24 percent less than its estimated $98 a barrel 2013 average price for WTI.
Similarly, the price at which half of AOGR respondents would reduce planned 2014 drilling falls between $74 and $73 a barrel, and reaches 55.1 percent at $72 a barrel. The percentage of AOGR respondents who would drill fewer wells rises to 72.5 at $70 a barrel, and hits 87.0 at $60. About one-quarter (27.5 percent) of AOGR respondents say they would reduce drilling at $80 a barrel, and 33.3 percent would do so at $76.
While some analysts think crude oil prices could drop to the levels AOGR and Barclays survey respondents say would negatively affect drilling, others are not so certain. An Oct. 25 Bloomberg report cites Raymond James & Associates forecasting $70 a barrel crude oil this year, but Barclays Research is projecting a 2014 WTI average price of $97.
A report from JP Morgan Chase & Co. makes the case that the U.S. oil boom is unlikely to be derailed by much lower prices, based on the cost to produce the marginal barrel needed to satisfy world demand.
JP Morgan calculates that decline rates for legacy oil fields across the United States, Europe and Latin America range from 3 to 6 percent a year. “Maintenance CAPEX per barrel has been rising around the world for these legacy fields, raising the marginal cost of oil,” the firm reasons. “Most global oil companies reportedly need $100-$125 a barrel to be cash flow neutral after CAPEX and dividends.”
JP Morgan says Goldman Sachs tracks all new global oil development projects with more than 300 million barrels in estimated lifetime production. “Over the past two years, no new projects added to the list have break-even costs below $70 (a barrel), and most have costs in the $80-$100 a barrel range, including the majority of Canadian heavy oil sites.
“Global oil consumption of approximately 90 million barrels a day cannot be met just from lower-cost sites, meaning the marginal barrel of oil often is sourced from higher-cost locations,” JP Morgan contends.
Looking closer to home, JP Morgan estimates break-even costs for the Eagle Ford Shale as well as much conventional production at $60 a barrel, but says other plays are more expensive. JP Morgan estimates break-even costs for the Anadarko, Utica and Mississippian Lime at $70-$90 a barrel.
Global Hunter Securities LLC estimates the break-even price for the Eagle Ford Shale at $78 a barrel, according to published reports. Global Hunter puts the Bakken Shale break-even price at $84. And while some Permian Basin areas can be profitable for as little as $70-$74 a barrel, according to Global Hunter, wells drilled in the Cline Shale and Northern Mississippian Lime need $96 a barrel.
For other great articles about exploration, drilling, completions and production, subscribe to The American Oil & Gas Reporter and bookmark www.aogr.com.