


Reservoir Characterization
Oil-Soluble Tracers Optimize Well Placements In Midland Basin Wolfcamp
By Marcus Jones and Jon LaRue
OKLAHOMA CITY–From a spatial perspective, optimizing the economic placement of wells can be a daunting challenge in unconventional reservoirs with multiple stacked pays. Operators are finding it difficult to optimize both the number of wells and the exact positioning of each wellbore within a target horizon. Sometimes moving only 10 or 20 feet up or down in a section can make the difference between a great well and a marginal one. This is true even for thick stacked-pay reservoirs such as the Permian Basin Wolfcamp, which can exceed 1,000 feet in gross thickness.
The Wolfcamp formation contains multiple hydrocarbon-rich benches. These benches and associated strata are complex mixtures of heterogenic geological parameters such as weak/strong structural interfaces between facies, open/healed natural fractures, varying fluid and pressure regimes, and other lithological variables. In developing optimal reservoir targeting strategies, companies wrestle with maximizing hydrocarbon recovery within ever-present economic constraints.
Consequently, multidisciplinary teams require a wide range of valid data to develop the best economic scenarios for optimal capital allocation and return on investment. Horizontal wells often cut across several lithologies that are assumed to be of similar rock type, but each lithology may have the potential to become a different productive zone. The key economic driver is to optimize the completion design for the targeted rock. This can be accomplished by carefully designing stage spacing and stimulation treatments to match the uniqueness of the geology and the resulting petrophysics of each rock type.
Many operators in the Wolfcamp and other plays are finding that strict adherence to well paths dictated by lithology and other drilling-derived data limits wasted completion dollars. The costs of wasted fluid and stranded proppant in pressure-depleted or nonproductive sections can be mitigated, thereby improving return on capital. Moreover, drilling and completion precision can help keep the stimulated rock volume within the confines of the planned well spacing and reduce reserves lost as a result of parent/child well interference issues.
A two-well project in the Midland Basin used multiple unique solid oil-soluble tracers (OSTs) as a reservoir characterization aid to determine the best landing zone and most economic well placement strategy in the Wolfcamp formation. This was accomplished by monitoring and analyzing the OST datasets produced from different frac stages and reservoir zones during a 435-day sampling period. The two wells were intentionally drilled highly toe-up in order to cross all the potentially productive benches in two distinct Wolfcamp intervals.
The dynamics of the OST recovery over time provided insights into the uniqueness of reservoir layering within the Wolfcamp. This conclusion was supported strongly by the fact that differing sectional lithologies were stimulated with the same completion design, yet tracer recovery was vastly different for many stages.
Some productive layers in the two wells exhibited initially high, but transient OST recoveries, while other zones produced OST data longer and much more consistently. By using granular-level tracer data in conjunction with other geoscience information, the operator was able to identify the formation layers with the highest potential for optimal production economics. This new methodology not only provided single-well placement optimization, but gave important insights for future completions in the area.
Tapestry Of Data
Solid particulate OSTs can be used for both qualitative and quantitative analysis, and can be employed in conjunction with more traditional tools to observe fracture energy movements. In fact, data from fiber optics, microseismic arrays, downhole pressure gauges, etc., complement tracer data very well. When viewed as a tapestry of data, and not a single stand-alone point, the understanding of how fractures propagate and what lithologies will provide good and long-lasting conductivity is greatly improved, as demonstrated in the case study wells.
OST chemicals are extremely hydrophobic, meaning they have a great affinity for liquid hydrocarbon relative to water, and are almost completely insoluble in water. As such, the oil tracer chemicals readily partition into reservoir oil in situ, and not into formation or frac fluids. Laboratory analysis of oil samples taken at the surface measure the concentration of the OST chemicals in the oil. Because petrophysical and geological properties affect hydrocarbon production, they affect total tracer recoveries and can give strong evidence as to each stage’s oil production potential.
Solid particulate OSTs differ from liquid OSTs in that the particulates remain locked in situ in the proppant pack after the frac pressure wave has subsided. For OST to be released from the carrier media, oil must flow over the trapped particulate in the reservoir. Geopressure will not force the solid tracers back into the wellbore after fracturing, as often occurs with liquid tracers, eliminating the chance that “false positives” will be generated in the data. In the case study wells, the different long-term behaviors of the tracer datasets highlight the uniqueness of the geological and petrophysical makeups of the rock types penetrated by each well.
Although relatively new, particulate OST technology rapidly has gained acceptance as a cost-effective way to provide longer-term downhole flow datasets than what can be achieved with conventional production logging tools (PLTs). With PLTs, the well must be flowing with no obstructions in the casing (including tubing, gas lift valves or downhole pumps), which limits the amount of data that can be acquired. In contrast, chemical OST data can be gathered anytime a fluid sample is taken at the surface, regardless of whether a well is flowing or pumping. One common description is that PLT data is akin to a snapshot of a movie, while chemical tracing data shows the entire movie.
OST analysis not only aids in understanding total oil recovery by lateral section, but generates a pseudo-production log over time. The data provided in the Midland Basin project highlights the dynamic and transient nature of oil production from different sections of two laterals. Identifying which productive layers return strong, but relatively short-lived OST production versus more consistent OST recovery rates supports type-curve predictions of estimated ultimate recovery. In addition, the follow-on financial and operational gains generated by analyzing OST datasets in target-rich zones aids in the full exploitation of an operator’s property.
Midland Basin Project
The two horizontal Wolfcamp wells are spaced 990 feet apart horizontally, with a difference of 485 feet in true vertical depth at the respective heels. As noted, both wells were drilled toe-up. Offset geologic data allowed the mapping of potential landing zones along with shale barriers in both sections. The wells were intended to cut different potential productive benches in each zone. The wellbores were drilled carefully in order to reach all the potential targets without any significant unwanted curvature.
The completion designs were held constant (gallons of fluid and pounds of proppant per lateral foot) in each well so every stage would be treated as similarly as possible. Identical stimulation designs for both wells were pumped, with the only variable being the volume of the stage size (gallons/foot of fluid and pounds/foot of sand) as a function of stage length.
FIGURE 1A
Well No. 1 Wellbore Path and First
Five-Day OST Recovery by Stage Grouping
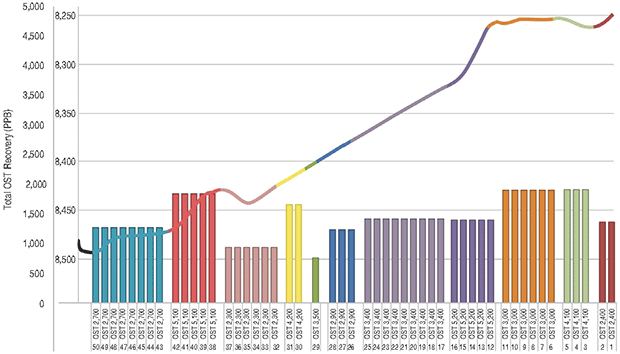
In Well No. 1, 11 seemingly geologically unique zones were identified over 8,500 feet of lateral. Fifty stages of varying lengths (a minimum of 165 feet and a maximum of 205 feet) were completed utilizing a standardized choice of 4 kilograms of OST per 175 feet of stage length. Standardization resulted in each stage receiving between 3.77 and 4.69 kg of OST during stimulation. The total stimulation treatment for Well 1 was 351,000 barrels of slickwater and 16.4 million pounds of sand.
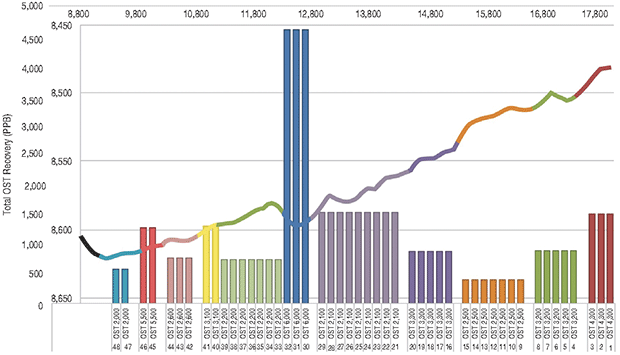
Another 11 unique zones were identified over 8,500 feet of lateral in Well No. 2. Forty-nine stages with lengths varying between 140 and 230 feet were completed using the same tracer volume standardization as in the first well. This resulted in each stage receiving between 3.2 and 4.2 kg of OST during stimulation. The total stimulation treatment for this well was 352,000 barrels of slickwater and 16.6 million pounds of sand.
FIGURE 1B
Well No. 2 Wellbore Path and First
Five-Day OST Recovery by Stage Grouping
As shown in Figure 1A, the wellbore trajectory of Well 1 had a toe-up rise of nearly 250 feet. The bar chart under the wellbore diagram shows adjacent frac stages that were grouped together based on similar rock types. The same OST chemical was used in each adjacent stage in the same rock type. The bars’ height represents cumulative OST concentration recoveries during the first week of production.
Sampling occurred throughout a 435-day period that ended in February 2017. While only 70 samples were subjected to laboratory analysis, it is worth noting that when the sampling program ended, five of the 11 grouped stages still were returning OST levels greater than 20 parts per billion. The remaining six stage groupings showed zero tracer recovery at day 435.
Figure 1B shows the same data for Well 2, which had a toe-up rise of 150 feet. Samples again were collected during the same 435-day period, with 70 samples analyzed in the lab. Unlike Well 1, this well returned no measurable tracer chemical from any stages on day 435.
OST Sample Recovery
FIGURE 2A
Well No. 1 Cumulative OST Recovery
By Stage Grouping
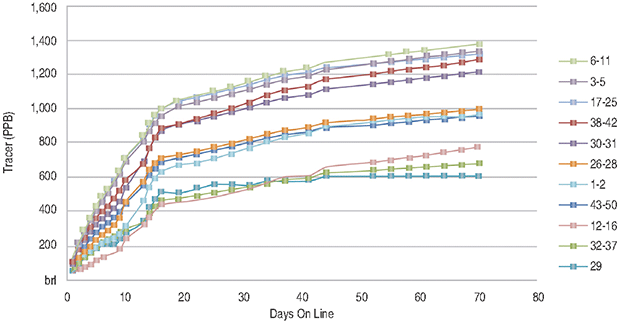
Figures 2A and 2B show the cumulative OST sampling recoveries over time by stage groupings for both wells. For Well 1, two stage groupings (stages 6-11 and stages three-five) were the two highest cumulative tracer-producing stages. Prior to production, geological data obtained while drilling Well 1 determined stage groupings 6-11, 17-25 and 43-50 would be the most productive targets. The bar chart shows OST recovery from stages three-five to be similar to adjacent stages 6-11. This information suggests the optimal horizontal landing zone for this productive bench should include stages three-five, and therefore be higher in the section than initially expected.
The same was true for stages 38-42 and stages 43-50. These two stage groupings were the third- and fourth-highest cumulative tracer stage groupings in Well 1. The high tracer recovery from this area of the wellbore again suggested completing this bench higher in the section than initially expected.
FIGURE 2B
Well No. 2 Cumulative OST Recovery
By Stage Grouping
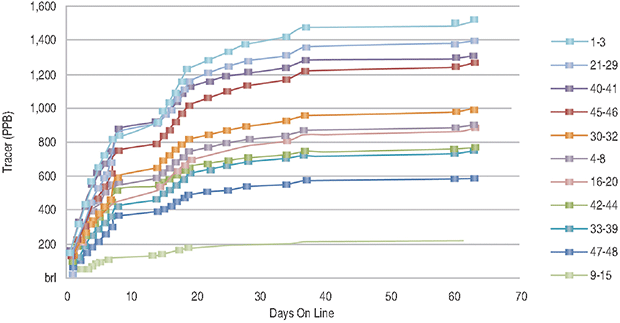
Figure 2B shows the cumulative OST sampling recovery over time by stage groupings for Well 2. Based on drilling data, it was assumed that stages 9-15, 21-29 and 33-39 would be the better-producing sections of the well. Tracer data showed that stage grouping 30-32 produced extremely high concentrations of tracer during the first week of production, yet cumulative tracer recovery at day 60 for these three stages was about average. This effect is thought to have been caused by the “ballooning” of more malleable rock during stimulation, resulting in a higher concentration of OST particulates near the wellbore. Of the three main target zones, stage grouping 21-29 was the strongest producer and later would be targeted as the primary zone in future wells.
Analysis of the tracer decline curve data by stage over time yielded higher levels of data granularity regarding lithology than could be obtained using only gamma and mud logs. Table 1 shows the slope of the logarithmic curve and regression coefficient for the grouped stages in both wells.
TABLE 1
Speed of Tracer Recovery (Slope) by Grouped Stage
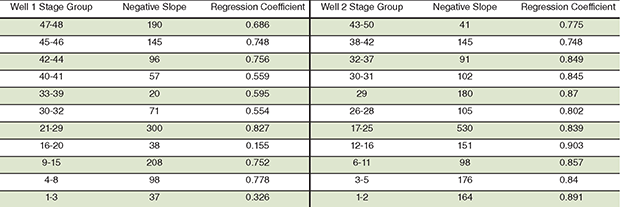
The speed of tracer recovery (slope) ranged widely by stage grouping in each well during the analysis period. Most of the regression coefficients are generally reasonable to describe the trends observed in the sample data. Some stages showed a consistently gradually declining regression fit slope compared with the larger, much steeper decline values of 300-530. The slope of the decline curve of oil tracer recovery was inferred to be correlated to fracture conductivity, indicating that some stage groups reacted differently to stimulation than others.
Production Dynamics
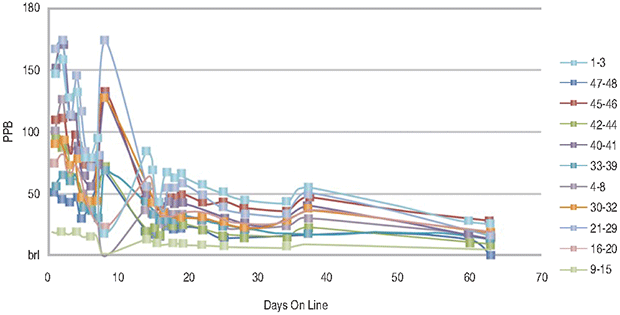
FIGURE 3A
Well No. 1 OST Concentration by Sample Order
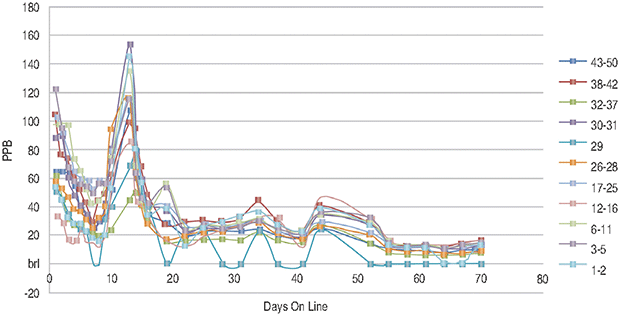
Examining the dynamic tracer recovery rates of the two wells shows the episodic nature of production taking place along the lateral over time (Figures 3A and 3B). In large part, this likely relates to reservoir pressure balancing and flow friction forces along various sections of the laterals.
The tracer data and geologic parameters of each stage correlated very well and supported one another’s interpretations. Comparing the tracer recovery data to core samples, well cuttings, mud logs and gamma ray readings did indeed show that zones with richer shale geology (more malleable rock) tended to produce tracer chemical back more quickly in early time and then rapidly decline.
This was attributed to the stimulations of the grouped stages creating fewer fractures because of the ballooning effect in certain sections’ rock. In these sections, tracer recovery was higher at initial flowback, and then subsided quickly as the higher original oil in place zones produced more relative oil over time.
FIGURE 3B
Well No. 2 OST Concentration by Sample Order
In this project, the dynamics of OST recovery provided insights into the uniqueness of reservoir layering and production dynamics in the Midland Basin Wolfcamp play. What’s more, the unique abilities of particulate OSTs to generate long-term granular information at the individual stage level rapidly improved reservoir characterization along the wellbore. Operators can improve well economics materially by using this information to identify optimal economic landing zones as well as completion designs.
Tracer data is mutually reinforcing with other types of information–reservoir, geology, drilling, operations, completions, etc.–in correctly characterizing a reservoir. In this case, tracer data was the piece of the puzzle that let all the other data pieces fit together in a way that made sense. Confidence in OST data as an analog for stage production permitted the integration of other data into a cohesive understanding of the two-well, toe-up landing zone test. The results of these tests have added useful information for future well placement and capital allocation decisions.
MARCUS JONES is director of completions at Echo Energy LLC. Before joining the company last year, he led MHJ Consulting LLC, an independent consulting firm. Jones has 15 years of experience in production, reservoir and completion engineering throughout North America, and has completed more than 500 wells with a significant focus on optimizing completion designs in the Haynesville Shale, Permian Basin and SCOOP/STACK. He holds a B.S. in petroleum engineering from the University of Tulsa and an M.B.A. from the University of Arkansas.
JON LARUE is vice president of engineering at NCS Multistage Tracer Diagnostics. With 33 years of specialized production, completions and reservoir engineering experience, he has held senior management roles with diverse responsibilities at both major and independent oil and gas companies. LaRue holds a B.S. in mechanical engineering from the University of Cincinnati, an M.B.A. in finance from the University of Texas at Austin, and a Ph.D. in engineering from Oklahoma State University.
For other great articles about exploration, drilling, completions and production, subscribe to The American Oil & Gas Reporter and bookmark www.aogr.com.