


Hydraulic Fracturing
Project Illustrates Benefits Of Comprehensive Monitoring For Improved Fracturing Operations
By Trey Lowe, Mike Potts, and Dan Wood
OKLAHOMA CITY–Hydraulic fracturing designs have been improved continually in an effort to optimize well performance and recoveries in the horizontal Woodford Shale play in the Cana Field in western Oklahoma, where early exploration and delineation wells often have been affected by high treating pressures and the inability to consistently place designed proppant volumes.
Through trial and error, Devon Energy Corp. developed methodologies for more consistent placement of the designed stimulation treatments, but many unanswered questions regarding various completion parameters and production efficiency remained throughout the early field development. These uncertainties included fracture propagation geometry, cluster contribution, and interference remediation.
To advance the understanding of hydraulic fracture geometry, interference, deliverability and production, a comprehensive fracture monitoring project was undertaken on a horizontal well drilled as part of the infill development program and completed with a 12-stage slickwater frac. Devon Energy and its project partner, Cimarex Energy Co., deployed several established and cutting-edge technologies to monitor and optimize Cana fracturing operations.
The specific technologies used in the subject well and eight offset wells in a one-square-mile section included:
- Distributed temperature sensing (DTS);
- Distributed acoustic sensing (DAS);
- Prototype cemented frac valves;
- Permanent bottom-hole pressure (BHP) gauges;
- Surface and downhole microseismic;
- Offset BHP monitoring;
- Logging-while-drilling;
- Advanced open-hole logging;
- Radioactive and chemical tracers; and
- Production logging.
All these technologies were used successfully to monitor cementing operations, offset fracturing, well fracturing, coiled tubing drill-out, flow back, and initial production. The project has assisted in achieving a better understanding of subsurface events and has provided insight into long-term production. The success of this project led Devon to successfully replicate the results through an 18-well surface microseismic project and three additional wells with fiber optic sensing.
Cana Field Development
Initial field delineation was achieved by drilling one “parent” well per square-mile section, which in turn, identified a core area of the Cana Field. The core area is being developed by drilling nine wells per section to true vertical depths of 12,000-14,500 feet (4,500-5,000 foot lateral lengths), with two or three wells per pad location.
Wells are completed sequentially moving east or west along a particular row. This allows for efficiencies in scheduling and logistics, as well as minimizing the interference between parent and development wells. The base completion design is a plug-and-perf completion consisting of 10 stages configured with four perforation clusters per stage. Throughout most of the field development, stage volumes consist of approximately 15,000 barrels of slickwater and 350,000 pounds 40/70-mesh white sand.
Commencing infill development within the core area created the unique opportunity to test individual variables in a more controlled and consistent setting. A “variable testing” program was designed to allow a specific variable to be tested within each section. Tested variables included number of stages, fluid volume, proppant volume, and number of clusters per stage.
By pumping a base design on four of the new wells within a section, the remaining four wells could be completed with a modified design. Comparing the performance between the base and modified designs would theoretically provide additional insight into which variable(s) had the most significant impact on production.
During the planning stages of the variable testing program, it became apparent that the biggest drawback would be the time required to adequately evaluate the impact of each variable. Even with two frac crews running full time, it took months to complete the testing program and obtain any meaningful production results.
It also became evident that even though this testing program might provide insight on which design parameters might ultimately affect production and help optimize stimulation designs, it would not indicate how or why that impact was achieved. To fully optimize completion techniques within the field, a more thorough understanding of the stimulation process was necessary. Fiber optics (and other complementing technologies) was subsequently identified as a means to gather significant and meaningful information in a relatively short period.
Project Objectives
The project scope involved the comprehensive use of various technologies in a nine-well section covering one square mile. The primary well included fiber optics utilizing both DTS and DAS. Project objectives focused on three distinct regimes: fracture stimulation monitoring, flow-back behavior, and production monitoring.
Stimulation monitoring and measurement technologies were installed to improve the understanding of fracture propagation and geometry, and to help determine how fracture(s) initiate in a multicluster plug-and-perf scenario, whether cluster spacing affects the fluid/proppant distribution during treatment, if natural fractures play a role in fracture initiation and geometry, and how fractures from offset wells interact.
Technologies to monitor early production (flow back) were used to answer questions such as what the correlation was between fracture treatment and flow-back quantities, and whether the flow back contribution profile changed over time.
The permanent temperature profile from DTS and a permanent bottom-hole pressure gauge were used to provide a long-term production log to help determine how the production profile changed over time and how it correlated to what was observed during the frac and during flow back. The production log also assisted in answering other key questions, such as how changing conditions (choke changes, line pressure changes, reservoir depletion, etc.) impacted the overall profile, and whether production issues could be identified (and addressed) prior to significant impacts on performance.
Based on the success of a previous Devon Energy project that used fiber optic sensing to monitor an open-hole horizontal well with multiple transverse fractures, it was apparent that fiber optic measurements would be highly beneficial to understanding cluster efficiency for cemented horizontal wells completed with multiple clusters per stage. The project team selected the McCray No. 2-26H as the best candidate for the primary well for this multifaceted project. The well was spudded in late 2012 as the last of eight wells to be completed in the McCray section.
There was an obvious challenge to installing a fiber optic sensing line in a cemented horizontal wellbore, and then perforating the casing. Because of the risk of perforating the fiber optic line, the normal completion method using plug-and-perf with multiple clusters was altered. However, since this was a data gathering project, it was important to closely imitate the normal completion method so that it could be evaluated. This imitation required the well to be cemented and fractured through multiple clusters per stage.
Alternative completion techniques where evaluated, ultimately resulting in the team’s decision to use a cemented, multicluster, ball drop sleeve system for fiber optic installation. The cemented multicluster sleeve system has 37 specifically spaced valves and a 10,000-psi burst rating. In a trial well, the ball drop sleeve system was installed without any issues. Immediately after installation, the well was hydraulically fractured with a slick- water treatment comparable in size to the planned McCray 2-26H. All valves operated as planned, and fracturing breakdown pressures were equivalent to plug-and-perf stages.
Complementary Technologies
The objectives of the project required collecting information that assisted with the fiber optic analysis. Likewise, the team wanted to utilize known fracturing diagnostic tools to evaluate DAS/DTS fiber optic sensing accuracy, including microseismic, offset pressure monitoring for interference, proppant tracers, chemical tracers, open-hole formation evaluation, and production logs.
FIGURE 1A
Configuration of Downhole Geophones (Red)
In Monitor Well and Position to Subject Well
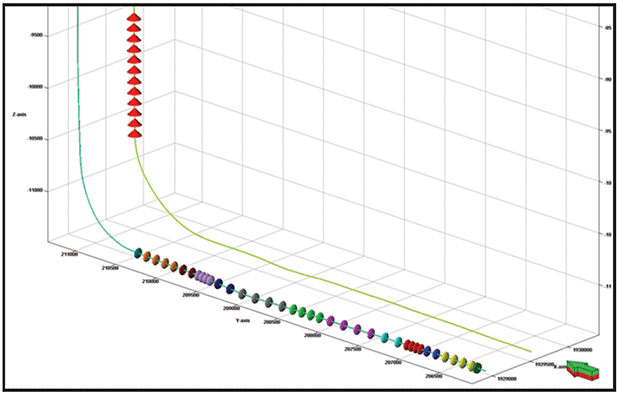
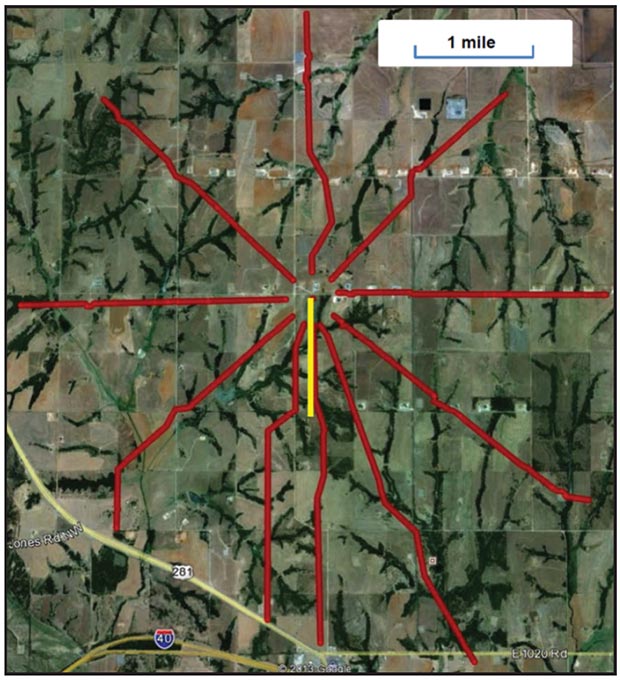
Microseismic was planned from the beginning to be the best complementary fracture diagnostic tool. A two-technology approach ultimately was selected. First, a downhole microseismic array would be installed deep in the vertical section of the neighboring well, located 600 feet west of the McCray 2-26H (Figure 1A). Second, surface microseismic arrays would be laid over the 2-26H well in a star pattern, including 10 separate lines with a total of 1,476 stations spaced at 90-foot intervals (Figure 1B). The 2-26H well is shown in yellow, and the surface microseismic lines are shown in red. The array pattern covered 26 square miles.
By using these two technologies, the project team hoped to achieve a good fracture geometry analysis in all three dimensions (x, y and z). Since the team did not have direct experience with surface microseismic, this also provided an opportunity to evaluate the data quality of surface compared with downhole microseismic.
Since fracture interference is common in the Cana Woodford, and the McCray 2-26H had several close offset wells, the team decided to collect pressure data from multiple points during fracturing operations. The pressure data would later be analyzed to provide fracture azimuth, an understanding of complexity (or lack of complexity), and fracture conductivity.
FIGURE 1B
Planned Layout of
Surface Microseismic Geophone Lines
Chemical tracers and proppant tracers had been used previously in Cana and provided useful information in completion effectiveness. Based on this experience, the team wanted to further evaluate the accuracy of these diagnostic tools. Planned proppant tracers included iridium, antimony and scandium collected during the flow back of all wells within one mile.
A key part of the project objectives was understanding formation heterogeneity’s role on hydraulic fracturing. This meant data had to be acquired about the heterogeneity of the formation without jeopardizing drilling operations or the fiber installation. The team elected to collect standard triple-combo, open-hole logs using logging-while-drilling tools. After the well reached total depth, a single drill-pipe-conveyed LWD operation would be performed, which included an ultrasonic borehole imager, azimuthal sonic tool, and an oil-based micro-image tool.
Fiber Installation
Installing any new technology can be difficult enough, but when several new technologies are combined in a single application, a mistake could result not only in lost rig time, but complete project failure. The planned array of complementary technologies required correctly installing fiber to full depth. Similar to the standard Cana Woodford design, the installation featured 51⁄2-inch production casing using a “toe initiator sleeve” to facilitate quick and efficient fracturing operations without tubing-conveyed perforating.
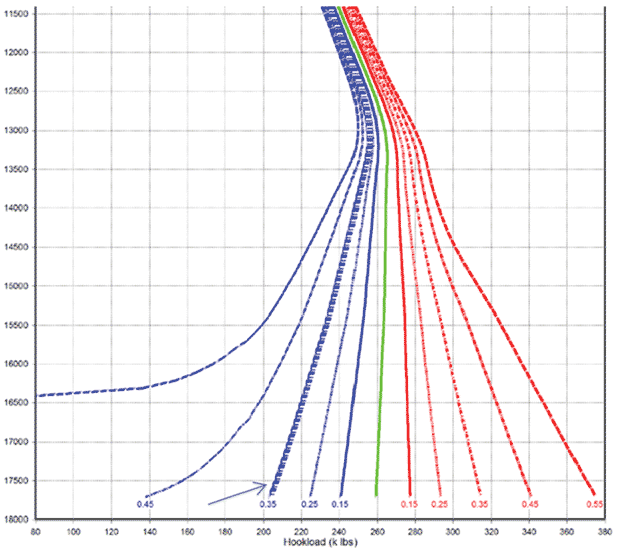
FIGURE 2A
Predicted Drag Forces
Using Original Surface Hole Location
However, the fiber had to be installed on the outside of casing continuously from terminus to surface, passing all the valves on the cemented multicluster sleeve along the way. This created concerns that valves potentially could damage the line as it was run in the hole. In addition, being close to the ports during treatment raised the requirement for improved fiber optic line protection. To combat both concerns, the valve design was modified to include a channel for the 11-millimeter encapsulated fiber line in a 120-degree “blanked” position between ports.
To meet the 10,000-psi burst design requirement, the valve bodies were enlarged radially to compensate for the reduced wall thickness in the channel. Including the toe initiator sleeve, the planned completion included 38 valves, each 40 inches long with a 7.6-inch outside diameter. In the heel of the well, an eccentric 7.75-inch OD pressure gauge mandrel required its own one-quarter-inch stainless control line to surface.
Using historical friction data from Cana Woodford lateral drill strings and production casing strings, it was obvious that the planned surface location would result in the casing not reaching total depth (Figure 2A). The typical Cana surface pad features two or three wells with up to 1,300 feet of displacement required to line up the horizontals in their designated development slots. The McCray 2-26 was designed originally to be the third well off the pad with 1,000 feet of displacement and 200 feet of negative vertical section to maximize completed lateral length.
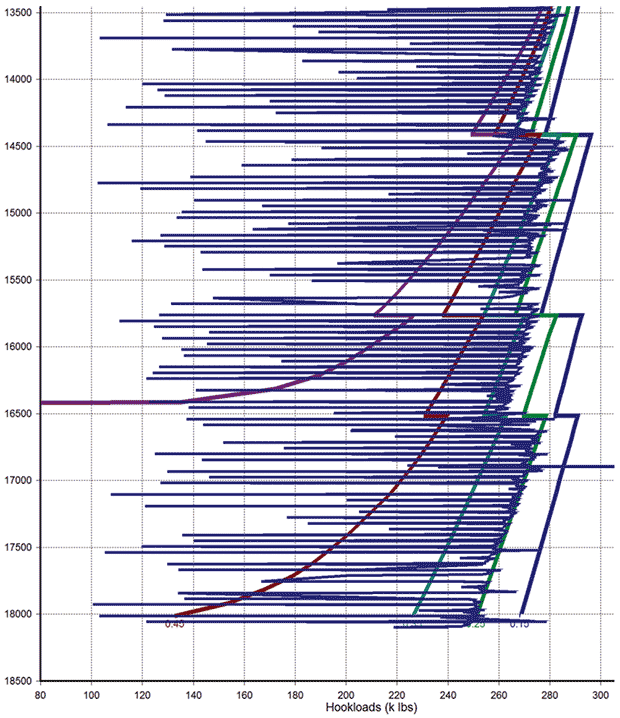
With the fiber and control lines in the wellbore, it would be impossible to rotate the casing to overcome axial friction. To eliminate the problem, the 2-26H’s surface location was moved to an individual pad directly above the planned heel of the well. This surface location change eliminated excessive displacement (and drag) that would have required rotation (Figure 2B).
FIGURE 2B
Predicted Drag Forces
Using Revised Surface Hole Location
A rotary steerable drilling bottom-hole assembly was selected over a conventional bent mud-motor and measurement-while-drilling combination. In Cana, drilling with a rotary steerable system has resulted in some of the lowest realized production casing friction factors. Among the other benefits of RSS are integrating LWD logs into the drilling BHA, eliminating one drill pipe-conveyed logging run at TD, and potentially improved hole cleaning.
In many situations, what is considered an acceptably clean hole to drill ahead, trip a BHA without a stuck pipe incident, and run casing to total depth, can vary dramatically when larger-than-normal completion tools or stabilizers with reduced junk slot area are integrated into the design. While backreaming of the drilling BHA might increase risk in some aspects, it also would produce the cleanest possible wellbore. Accordingly, it was integrated successfully into the cleanup protocols, but backreaming from TD with the highly stabilized RSS and LWD BHA proved to be one of the most challenging aspects of the entire procedure.
While RSS and backreaming can produce a relatively clean wellbore, it is virtually impossible to completely remove all debris, especially in a one-mile-long horizontal wellbore. That being the case, stabilizer and centralizer design was not overlooked. Stabilizers were selected and modeled that had sufficient standoff and junk slot area with a minimum amount of spiral wrap (when combined with small junk slot area, excessive spiral wrap can add significant risk while attempting to pass through an appreciable amount of cuttings).
This consideration also was used for centralizer selection. Centralizer modeling suggested that 65-85 percent standoff was achievable using relatively tight centralizer spacing through the lateral and curve. Tight centralizer spacing has been used historically to improve cement quality, but in this application, it also decreased the likelihood of fiber cable wear. A straight blade centralizer with a large junk slot design also increased the ability to move through residual cuttings beds.
A final design criterion was preventing the centralizers from moving or rotating independently of the string. Consequently, the centralizers selected had 10 total blind set screws to keep them from spinning on the casing. Shop testing suggested that at least 8,000 foot-pounds of torque was necessary to spin the centralizer when properly installed. In the vertical section, where centralizers are not necessary, a “cross-coupling clamp” was used to protect the cables and hold the lines to the casing.
Shop Tests, Walk-Throughs
One of the few aspects of the entire installation that could be tested independently in a separate wellbore was the cemented, ball drop sleeve system. While not identical to the fiber channel version with increased outside diameter, the drag analysis for the 12-valve trial well installation showed very little deviation from what would be expected from a casing string without valves (Figure 3).
FIGURE 3
Actual and Modeled Drag Forces
During Installation in Trial Well
A complete “dry” walk-through of all the systems proved invaluable. Representatives from each company involved with completion installation met months ahead of the scheduled installation with Devon’s office and field personnel to discuss concerns and find solutions to potential problems. A single ball drop valve, fiber cables, centralizers, casing, and the pressure gauge carrier were assembled to allow the team to see the downhole components and select the best surface handling equipment. The team was also able to build a list of action items and to document what equipment would be delivered to the well site.
A full stackup of the wellhead equipment also was performed. Setting the slips, installing the pack off, and terminating the lines were all rehearsed and multiple small issues were identified and remediated. The team also traveled to the drilling rig to inspect actual conditions at the well site, and to a completed well site to identify any potential surface installation issues.
Another shop test and walk-through found a deficiency involving the backup plan in case the valve system failed or the seats had to be drilled out prior to completing all stages. While it had been assumed that two braided wire cables installed along either side of the fiber optic line could be located if oriented perforating became necessary, shop testing indicated logging tools were not capable of detecting the cable. Steel rods then were welded inside the cable clamps, and subsequent testing indicated they should be detectable if needed.
Because of all the upfront design work and coordination, actual installation was destined to be successful with minimal errors.
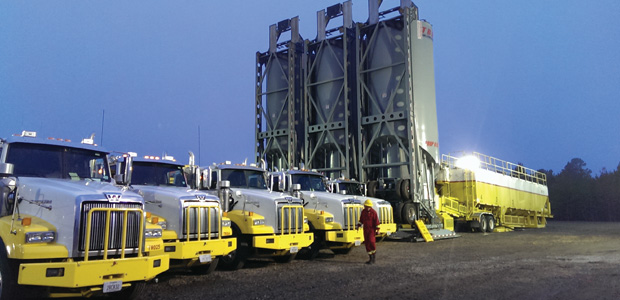
Completion Operations
Custom length, 5 1⁄2-inch, long-thread casing was loaded on the racks in a pretallied running order. This required additional upfront work, but simplified casing running operations. Cluster spacing was one of the main variables to be evaluated, so valve spacing was critical. Using a casing running tool eliminated the stabber in the derrick, the platforms around the rotary table that obstruct line of sight, and the conventional power tongs that could potentially damage the lines.
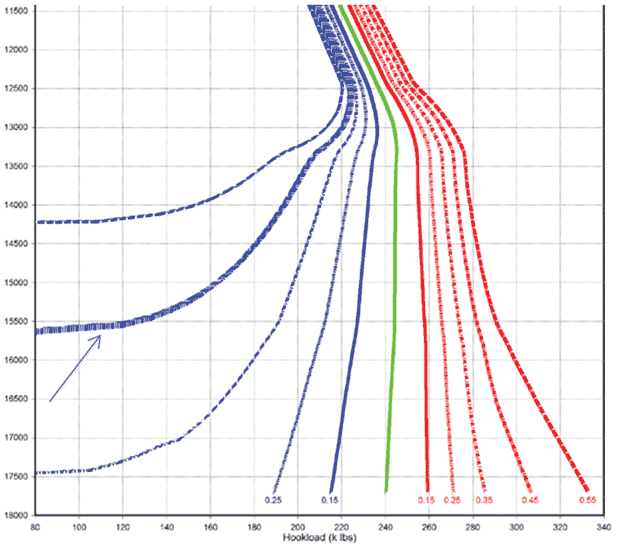
FIGURE 4
Actual and Modeled Drag Forces During Installation In Subject Well (Including Casing Fill-Ups)
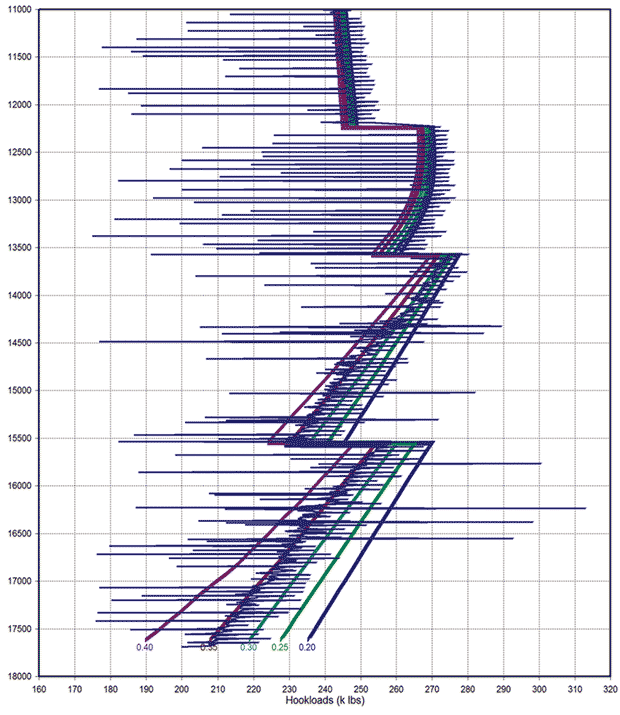
All valves, centralizers and lines were run without incident. The fiber line was run continuously from the shoe track to surface, and a wear-arresting pair of one-half-inch braided sacrificial steel lines sandwiched the fiber line in the distance between each valve. The casing was cemented in place at total depth without incident. Cementing pressures showed no increases from the large valve diameters, and the final drag analysis showed very little difference from what would be expected from a string without fiber and valves (Figure 4).
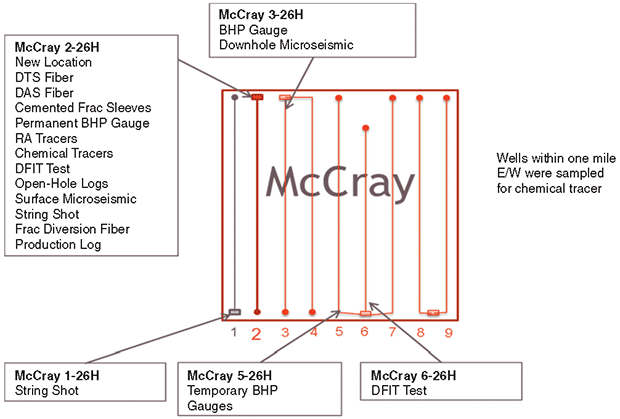
The wells were completed from east to west, and the fiber optic-equipped McCray 2-26H was the last well completed. Figure 5 shows various unique operations related to the project. In late December 2012, DFITs were performed on the McCray 6-26H and 2-26H wells. The McCray 2-26H DFIT was performed by opening the toe initiator sleeve near the end of the well and injecting 20 barrels at a rate of five bbl/minute. The McCray 6-26H DFIT was performed by pumping a similar volume into one set of perforations located near the toe of the well.
FIGURE 5
Overview of Project Operations
And Technology Installations
In early January 2013, hydraulic fracturing operations began on both the McCray 4-26H, with the McCray 3-26H immediately following. The wells were stimulated using large volumes of treated slickwater. Both wells were fractured in 10 stages, with each stage using four perforation clusters per stage. DTS and DAS data were monitored and acquired during frac operations from the McCray 2-26H. Likewise, bottom-hole pressure data were acquired from the McCray 2-26H, which still had communication to the formation through the toe initiator sleeve.
After drilling out the composite bridge plugs (CBPs), BHP gauges were installed in the McCray 5-26H using a retrievable production packer deployed with electric wireline. BHP gauges then were installed on the 3-26H well using a retrievable production packer (the ball-drop, flow-through CBPs had not been drilled out). Because the 3-26H was the monitoring well for downhole microseismic, it had to be open at surface during deployment. This requirement meant that another barrier needed to be installed downhole. Consequently, a retrievable bridge plug was ran on e-line and tested after the packer was installed.
Data Acquisition
The following day, the downhole microseismic array was deployed in the 3-26H well. Immediately after this deployment, a zero-offset vertical seismic profile (VSP) was acquired utilizing a vibrator truck located near the edge of the 3-26H well site. Ultimately, this array remained deep in the vertical section of the wellbore, with the bridge plug and packer directly below the array tools.
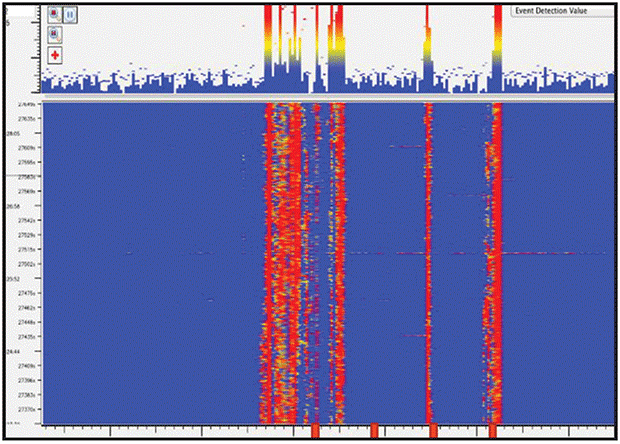
FIGURE 6
Screen Shot of DAS Data during Fracturing (Acoustic Energy at Three of Four Valves)
After acquiring the VSP data, multiple string shots were performed, since the McCray 2-26H would not be perforated. The first string shot, which utilized 80 feet of explosive primer cord, was conducted in the heel of the McCray 1-26H. It was attempted twice, but the signal was too weak during both attempts to be utilized by downhole microseismic (located in the 3-26H vertical one mile north). A third string shot was performed in the heel of the McCray 2-26H and the signal was sufficient to help calibrate the velocity profiles for both surface and downhole microseismic.
Fracturing operations began on the 2-26H in 12 stages with various cluster (valve) spacing and configurations. Fracturing was monitored in real time with the BHP gauge, DTS, DAS and surface microseismic (Figures 6-8). Proppant tracers and chemical tracers were included in each stage.
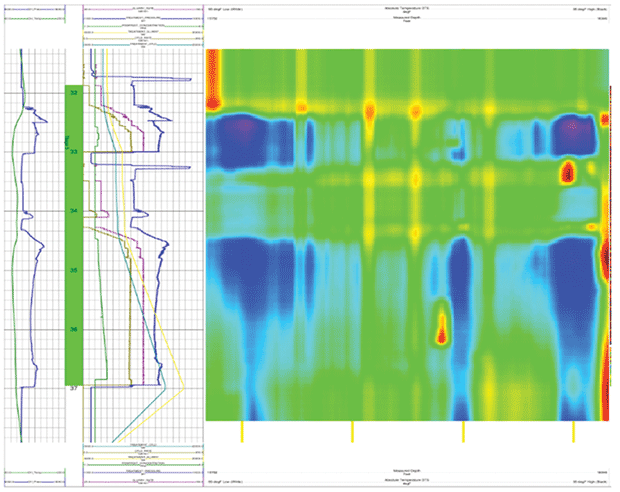
FIGURE 7
Visualization of DTS Data during Fracturing
Handling the data generated from the DAS acquisition unit was challenging after the job finished. The acoustic data alone exceeded 30 terabytes. Hard drives had to be physically moved to the appropriate people rather than being transferred electronically, and a computer had to be built specifically to import and process the data.
Following fracturing, a coiled tubing unit was mobilized to the well site to drill out the balls and valve seats. There were substantial milling issues with the ball seats and the operation lasted five days. Once finished, the well began to flow back through test equipment. Throughout these steps, DAS, DTS and BHP were acquired for post-job analysis. After the well began stabilized production, DAS acquisition was terminated and the equipment was demobilized, leaving the DTS and BHP acquisition units in place for permanent well monitoring.
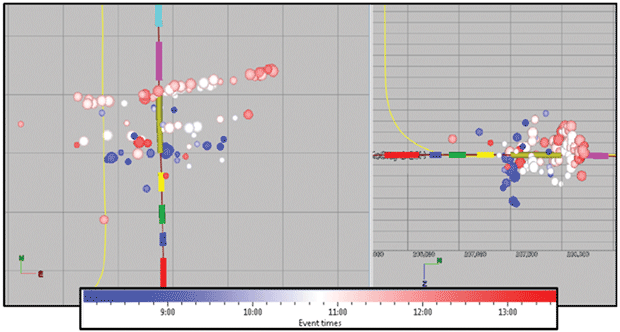
FIGURE 8
Visualization of Microseismic Data during Fracturing
Tremendous Success
Overall, the Cana Woodford project was a tremendous success from both an operational and an engineering standpoint. It shows that numerous technologies can be combined into a comprehensive monitoring project to provide valuable insight into completion and production issues.
Fiber optic temperature and acoustic sensing is an excellent means for monitoring real-time downhole fluid flow through individual perforation clusters during frac treatments. Surface microseismic provides meaningful real-time information regarding fracture geometry and complexity. Offset BHP data can provide indications of fracture azimuth, fracture length, and complexity. Radioactive tracers, chemical tracers, production logs and downhole microseismic are all useful and provide insightful information when used in conjunction with other technologies.
Because of the success of this project, three similar installations of fiber optics have been performed since for fracture monitoring, and have validated improved completion designs. Using this information as a foundation, the Cana team has made significant improvements to the completion design, resulting in improved recoveries and economics.
There are certainly challenges to overcome, but ultimately this type of monitoring can be used to improve the well stimulation process. Decisions such as decreasing or extending stage volumes, applying diverter techniques or adjusting perforating schemes already have (and will continue to) improved performance and/or decreased costs. Devon Energy has performed, or is planning to perform, similar installations in other basins.

TREY LOWE is a completions engineering manager at Devon Energy Corp. He has been at Devon for nine years, and has served in completions and production engineering roles in West Africa, Brazil, Gulf of Mexico, East Texas and western Oklahoma. Before joining the company, Lowe served for seven years as an engineer at Schlumberger. He holds a B.S. in chemical engineering from Oklahoma State University.

MIKE POTTS is a drilling engineering adviser at Devon Energy Corp., responsible for well construction and technology. Before accepting this position, he served for 10 years as a drilling engineering consultant to Devon. Potts began his career as a company man at ExxonMobil. He holds a B.S. in electrical and electronics engineering technology from Oklahoma State University.

DAN WOOD is an operations engineering supervisor at Devon Energy. Before joining the company in 2005, he served for nine years as a senior storage engineer at Dominion, three years as a district engineer at Belden & Blake Corp., and six years as a production engineer at Marathon Oil Corp. Wood holds a B.S. in petroleum engineering from Marietta College.
For other great articles about exploration, drilling, completions and production, subscribe to The American Oil & Gas Reporter and bookmark www.aogr.com.