


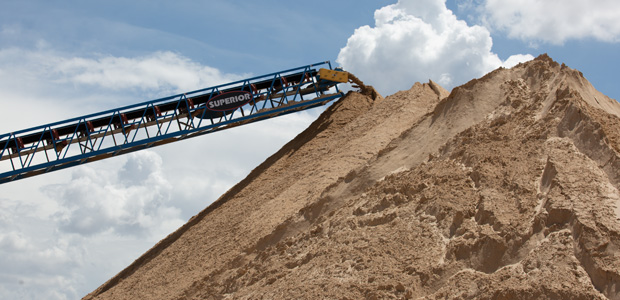
Sand Delivery
Real-Time Data Collection Optimizes Proppant Logistics
By Brian Dorfman, Matt Oehler and Kevin Fisher
HOUSTON–Only 12 percent of Fortune 500 companies from 1955 are still in existence. How and why has that happened? Technology continues to disrupt legacy behemoths. Data and the story they tell are vital to the current and long-term success of any product, service or company. Predictions say by 2020 there will be 50 zettabytes of stored data. That is the equivalent of 50 billion 1.0-terabyte disk drives. By 2030, that number is expected to increase by an order of magnitude. The central promise of big data is that it provides a better way to gain insights into the real-world challenges businesses face every day.
In the past, collecting and interpreting vast quantities of data was not feasible because the technologies automating that process did not yet exist. Today, innovative big data and digital-enabled technological solutions are changing that status quo in increasingly complicated last-mile logistics in the proppant supply chain.
Proppant consumption per well in the United States has doubled during the past five years and quadrupled in the past decade. The percentage of the cost for proppant delivered to the blender in a modern hydraulic fracturing operation can account for 20-25 percent of total well cost, up from a small fraction only a few years ago.
Oil and gas companies are undergoing a digital transformation driven by an explosion of collected data, yet many organizations and legacy processes simply cannot keep up with or leverage all the data being generated in the field. The nature of a completion operation is inherently erratic. Daily proppant demand at a well site will increase or decrease regularly from what was expected and planned for at the job’s onset. Allocating and assigning resources to supply a well site that is so inherently inconsistent takes extraordinary agility, flexibility and attention to detail.
When managing inputs from multiple railroads and multiple transload facilities, combined with erratic wellsite daily demand, the supply chain team must be equipped with the tools to make necessary adjustments on the fly. A single hour of downtime waiting on sand can cost an operator upwards of $20,000. An effective last-mile delivery operation is more critical than ever to a fracture treatment’s success and profitability. Accordingly, the companies responsible for transporting, storing and delivering proppant must understand the value of organized data and provide operators with the resources and analytics they need to identify and solve the unique problems inherent in last-mile operations.
Automated Data Collection
Raw data is like crude oil. It is valuable, but if left unrefined and unprocessed, it cannot be used effectively. Asking the right questions about last-mile operations and pinpointing where to focus time and attention are imperative to capturing and analyzing all aspects of the process. To that end, the most advanced container proppant delivery solutions available today use a combination of QR code optical labeling, wellsite “geofencing” and radio-frequency identification (RFID) technology to capture and automate data collection not only at the transload facility or storage silo, but all the way to the onsite data van.
Pertinent data are available through a live customizable dashboard with key performance indicators that paint a picture of what is happening at each step in the proppant delivery process, from the frac sand mine to the sand king at the well. In addition, dispatchers are provided a live map of the drivers’ respective locations, costs and available hours to assist with maximizing each driver’s delivery efficiency.
State-of-the-art software tools trend site sand demand, with transload efficiency as well as turn time variances to equip the operator with the knowledge needed to increase total productivity. These data help clients understand and withstand the ebbs and flows of well site demand unpredictability.
Collecting and analyzing last-mile data is a combination of utilizing what we see in the field day to day and what the data are telling us. Information tells a story, but the lessons from that story are most useful when they can be paired with detailed firsthand knowledge of the unique operational challenges posed by last-mile sand delivery.
How can oil and gas companies be assured that “smart” containerized sand delivery is effective, flexible and more cost-effective than traditional pneumatic or silo operations? The answer is in the data. Containers provide flexibility and agility, comparable to a mobile military strike force. Similar to the shipping container, which revolutionized global trade, proppant containers deliver the opportunity for forward staging and system diversion strategies, which can lead to the reduction and elimination of demurrage.
Exceptional Efficiency
How do we know that these benefits hold true? Once again, the answer lies within the data, and more importantly, within the structured organization of the large dataset collected by the big data software. Consider the example of an operator that had been using pneumatic delivery and an associated software system before switching to a containerized system with a big data software solution. This situation provided a valuable opportunity to take an unbiased look at the data being collected in the exact same way before and after switching to containers.
FIGURE 1
Pneumatic versus Containerized Delivery Systems
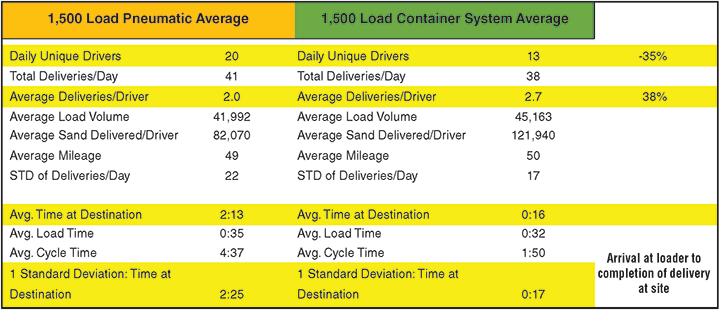
As shown in Figure 1, the data show that the efficiency increases were exceptional. The overall truck count dropped 35 percent, with deliveries/drivers for each shift increasing 38 percent. Most importantly, yet often overlooked, the variance of time spent on the well site completing deliveries decreased by 8.5 times. When a company can predict total delivery time better, it provides the opportunity to shrink the total assets (and cost) needed to keep up with highly erratic onsite sand demand. Consistent data analysis makes it possible to eliminate wait time and allows each driver to accomplish more per shift, leading to mileage band cost reductions.
Real-time data are essential for real-time strategy adjustment and real-time decision making. Figure 2 shows which drivers are doing their jobs most effectively based on their check in/check out times at each step in the last-mile process. For example, drivers who fall on the far right for combined total delivery time (all segment times added together) may need to look at their processes.
FIGURE 2
Driver Segment Breakdown
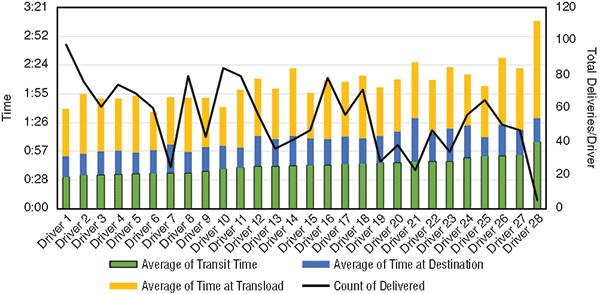
Additionally, notice the consistent time for the blue segment in Figure 2. This represents delivery time or time spent on a fracturing location. These numbers are exceptionally consistent solely because of the use of a containerized delivery system. Using traditional pneumatic delivery inherently would cause high variability and a much higher average in total time on location. The benefits of low-variance delivery, transport and pickup times allow the dispatch team to plan trucking in accordance with their drivers’ hours in service to maximize their time while minimizing the risk of timing out and losing assets until drivers can reset their hours.
Furthermore, at the company level, one can assume that a contracted party will hire sub-contractors to help it fill intermittent demand. When this situation occurs, the software will categorize their efficiencies by company rather than by driver. The operator can compare contractors objectively to help them to become more efficient or award more work to those who perform better.
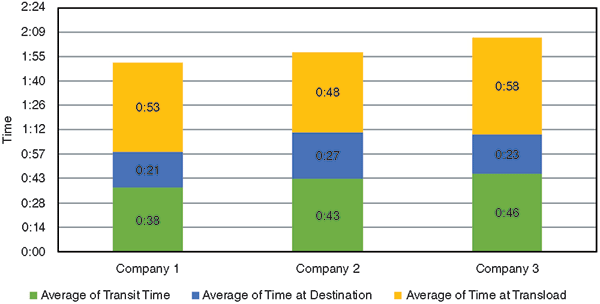
In Figure 3, for example, why are the drivers from Company 2 spending 28 percent longer on site than the drivers from Company 1? Prior to this visibility, problem solving related to the last mile was a guessing game. Managers had plenty of theories about who was responsible for a communication breakdown or the cause of a costly demurrage or nonproductive time, but they had little actual data to support those theories. Now, equipped with real-time analytics on last-mile logistics, clients are armed with the data to drive change and productivity gains.
FIGURE 3
Company Segment Breakdown
Better Decisions On The Fly
Transitioning to transload facilities, data can be collected via time stamps at check in and checkout along with user purchase order inputs to help operators track loading times and variances, and manage their inventories at the terminals so they can prepare for incoming trains to reduce expensive rail demurrage. Using this real-time knowledge, the dispatching team has a piece of the puzzle it previously lacked.
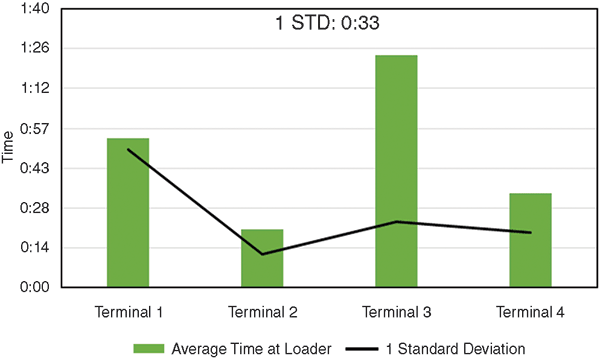
Looking at Figure 4, even though Terminal 1 has a much shorter average load time than Terminal 3, the variance of load time at Terminal 3 is quite a bit more predictable. There are many mileage bands or situations where predictability is more important than average speed, while the opposite also can be true in the right circumstance. Predictability allows the dispatch team to reduce the risk of accidental bottlenecks that can spiral out of control.
FIGURE 4
Transload Facility Efficiency
Analyzing trending sand demand on site, current box inventory levels, purchase order quantities, unit train expectations and the knowledge of each transload facility’s real-time load efficiency are all components essential to making informed decisions on the fly. Without this visibility, that decision making process would be much more difficult, much more time-consuming and lead to bottlenecks and costly downtime.
A unique and new challenge associated with using containers for last-mile proppant delivery is the management of hundreds, if not thousands, of container assets that distribute millions of pounds of proppant every day. When a frac crew goes to plan for, track and account for a stage worth of sand, managing a box ID along with an associated bill of lading (BOL) can add new details to the tracking, which in many cases creates additional inputs for the personnel in the frac van recording delivery tickets.
Streamlined Billing
A newly developed solution not only stretches beyond the onsite paper clutter, but streamlines the billing process as well. Within the software lies detailed real-time box inventory information at each wellsite, forward staging area or transload facility. Moreover, each box now can be tagged with an RFID chip. RFID tags generate data through a simple chip and antenna that are embedded into the box and associated with its serial number. When that box is placed in position to be pumped down hole, the RFID tag registers and calls to the onsite inventory to gather the BOL information associated with that container and populate the live dashboard with all relevant information.
When the RFID “handshake” is broken, the tag again calls to the database to update its empty status and assigns that BOL data to a certain stage to be packaged and sent electronically to the payables department for verification and billing. Once a box breaks the virtual gate, all load and box data automatically are checked into the onsite inventory database. The live sand tracking and stage reports can be managed in the sand area or in the data van, or both.
Not only does the software provide supply chain personnel and coordinators with the real-time visibility they need to manage delivery from source to well, but it also enables unmatched visibility and simplicity for the wellsite personnel who are tracking and managing the throughput of some 200 containers a day. The data collected can be leveraged to trend and forecast demand and help simplify the time onsite personnel spend organizing the delivery of millions of pounds of proppant. This tool allows them to perform their primary roles safely with minimal movements and minimal time spent on the phone with dispatchers and others in the supply chain.
Few of us can dispute that organizations have more data at their disposal than ever. But actually deriving meaningful insights from that data–and converting knowledge into action–is easier said than done. More than ever, punctual and efficient proppant delivery is essential to success, which makes it crucial to leverage data to drive new efficiencies into the process. It is a challenge that every operator and every entity linked into the proppant supply chain must take seriously.
The right real-time data and analytical capabilities paint a picture highlighting the pinch-points in any last-mile operation, and equip operators with the information and tools that they need to make faster and better informed decisions at operational speed.

BRIAN DORFMAN is a business development manager at Denver-based PropX LLC, which provides last-mile proppant delivery solutions. Prior to being the first employee and part of the startup team at PropX, Dorfman worked for four years at Halliburton in Colorado and North Dakota. He holds degrees in finance and accounting from Georgetown University.

MATT OEHLER is a business development manager for PropX, working to solve last-mile frac sand delivery challenges and add value for customers. A 27-year veteran of the oil and gas industry, he served for 24 years at Halliburton before joining PropX in 2017, working in operations, technology, product commercialization, acquisition integration and business development.

KEVIN FISHER is chief executive officer of PropX. Before joining the company in 2016, he served as president of Liberty Oilfield Services and as executive vice president of business development at Flotek Industries. Fisher began his career in 1979 with Halliburton. He joined ProTechnics in 1993 as director of sales and marketing, and then moved to Pinnacle in 2000, ultimately serving as chief executive officer. He has a B.S. in natural science and physics from Cameron University, and is a graduate of Harvard Business School.
For other great articles about exploration, drilling, completions and production, subscribe to The American Oil & Gas Reporter and bookmark www.aogr.com.