


SEG 2013 Part 1: Unconventional Plays Drive Geophysical, Computing Technology
By Kari Johnson
SAN DIEGO–Advances in computing infrastructure are having a dramatic effect on the solutions available for reservoir analysis, field planning, well placement, completion analysis and other key processes in exploring for, developing and producing unconventional resources. These advances allow faster modeling, real-time processing, high-definition 3-D data displays, and greater data integration.
One sign of success is that the hardware and software infrastructure itself is not the focal point of discussion. Instead, the buzz is about new ways to combine 3-D seismic and microseismic, full workflows for exploration and development, and faster and more intuitive tools for interpreters.
At the same time, there is a growing recognition that the distinctions between conventional and unconventional resources extend beyond the plays themselves to the ways in which oil and gas professionals develop them. Engineers have a dominant role in field planning and development, and the geophysical tools traditionally used in conventional play exploration have to demonstrate value in new ways in unconventional asset development. Recognition of this is driving interesting changes to seismic techniques, technologies and workflows, and is introducing powerful new geophysical capabilities.
For Glenn Winters, chief geophysicist at Fasken Oil and Ranch, unconventional resources require re-evaluating how to use geophysical information. “We are working out what we can do with seismic data to calculate rock properties,” he explains. “Rock properties such as brittleness, Young’s modulus, and Poisson’s ratio that can be found through analyzing seismic data are helpful in identifying drilling sweet spots and guiding completion design.”
Fasken certainly values seismic and has acquired 3-D data over its entire 200,000-plus acre ranch in the Permian Basin in West Texas, as well as over its leasehold in the Eagle Ford Shale in South Texas. Although it is using advanced techniques such as prestack inversion and depth imaging, according to Winters, the company uses seismic primarily for structural guidance.
Winters and his team have learned about fracture propagation, well interference and perforation practices the old-fashioned way: trying out a variety of techniques and technologies in their own backyard to see what does and does not work. Among the technologies tested and/or deployed on the ranch in recent years are wireless 3-D acquisition, quantum resonance interferometry and voxel analysis to predict permeability and porosity from 3-D data, 3-D spectral decompositioning, microseismic using permanently cemented downhole geophones, and reverse-time migrated 3-D.
From his perspective, Winters says more companies are performing seismic inversions today than a year ago. Still, he suggests the industry is in a hurry to drill. “Everyone is trying to develop his acreage. That can lead to a ‘going and blowing’ mentality,” he remarks, depicting the horizontal drilling and multistage completion approach. “We have our favorite zones, as do others. But we do not really know which zones are contributing to production.”
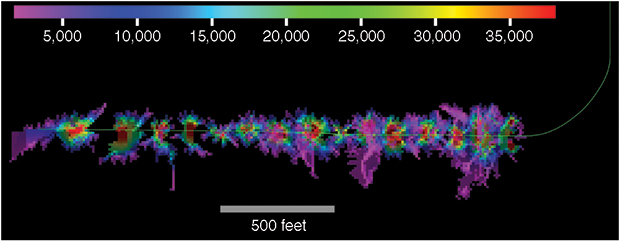
One method Global Geophysical Services deploys to estimate the total stimulated reservoir volume uses near-well Tomographic Fracture Images™ constructed for individual stages and then combined with the entire volume to generate the SRV. The result is a 3-D image of the fractures, with cumulative seismic activity indicated by color.
Winters says that geophysical technologies will invariably prove invaluable in optimizing asset performance in unconventional plays, and he takes a pragmatic view of the tools. “We are finding a balance between speed and precision,” he comments, noting that Fasken Oil And Ranch is collaborating with the Bureau of Economic Geology at the University of Texas at Austin on some projects in the Eagle Ford and Permian Basin. “We are working with BEG to get more out of our seismic data and will have some exciting things to share in the next few years.”
Reservoir Specialists
Seismic data analysis is becoming more and more specialized in two areas, seismic imaging and reservoir geophysics, observes Brian Russell, vice president of Hampson-Russell Software, a subsidiary of CGG and a specialist in reservoir geophysics. “I think the biggest challenge for geophysicists today is to stay current because the whole paradigm is shifting,” he assesses. “We are getting so specialized that it is hard for people to keep up.”
On one hand, there are increasing demands for geophysics because conventional plays are getting more difficult, deeper, and more structurally complex, Russell explains. This is where seismic imaging is important, especially in deep offshore subsalt plays. Then along came the unconventional revolution, which is equally challenging, but in a different way.
“Unconventionals are a whole different paradigm,” Russell says.
That makes it an exciting time to be in the business of geophysics, but it is also leading to a trend of “superspecialization” within the seismic sector, he observes.
One of the challenges with resource plays is simply their enormous scales. In a conventional geologic play, the reservoir target may be confined within a two-acre area. An unconventional play can cover hundreds of square miles and many millions of acres. This has led operators to consider them engineering driven, notes Russell.
“Yet, sweet spots can be hard to find and production performance between offset wells with similar completions can be drastically different,” he points out. “Geophysicists can contribute real value by showing fracture direction, fracture networks, and other rock properties that indicate better drilling targets with improved performance.”
An important step is for geophysicists to start talking the language of engineers, according to Russell, who adds that integrating engineering and geophysical studies is a move in the right direction. One area of common interest is microseismic. “Engineers have embraced microseismic and there can be even more value if it is integrated with interpreting 3-D seismic,” Russell notes.
“We know modeling and analysis in unconventional reservoirs improve production results,” Russell contends. “A combination of techniques is needed for unconventional plays, including new ways to use seismic to help understand fracture networks and what is happening before, during and after wells are drilled.”
Integrating Seismic Data
Technologies to integrate surface seismic with borehole microseismic continue to gain interest, as demonstrated by the new Magnitude joint venture between Baker Hughes and CGG. The JV is a restructuring of VSFusion, a 10-year-old venture between the two companies that at its inception was focused on vertical seismic profiling services. Magnitude takes its name from a French-based microseismic research and development company acquired by the joint venture a few years ago, recalls Douglas Stephens, president of pressure pumping at Baker Hughes.
MicroSeismic Inc. is using microseismic and hydraulic fracture mapping data to determine source mechanisms, including the strike, dip and rake of fractures, and ultimately, the discrete fracture network (DFN). The DFN is then used to model the Productive-SRVTM to assess the volume of rock that was stimulated and actually contains proppant. Simulations combine recorded data with operator-provided details such as viscosity, gel, proppant type and weight to calculate Productive-SRV on a stage-by-stage basis.
Combining surface and borehole microseismic data provides more precise determinations of the location and magnitude of seismic events, and can assist in determining the type of event, such as slip and shear, Stephens details. Surface seismic data provide the azimuthal coverage and borehole data provide vertical coverage.
“This is all part of a much larger workflow for unconventional assets that spans from pad placement to wellbore placement, based on geomechanics and petrophysics, and then placing the completion in the right place, based on petrophysical measurements and geology, to get the best fracture,” Stephens outlines. “All data–including surface logs, mud logs, logging-while-drilling, wireline logs, seismic and microseismic–are combined into the larger workflow.”
Combining surface seismic monitoring with borehole seismic monitoring and processing capabilities enables general microseismic monitoring as well as monitoring during hydraulic fracturing operations, Stephens suggests. “Populating operators’ earth models with integrated microseismic information will become seamless and transparent,” he remarks.
Well Placement
Well placement is a critical success factor in unconventional resource plays. One approach to better well placement is thorough analysis of the natural and induced fracture networks and total stimulated reservoir volume (SRV). Such analysis can show what stages were effectively fractured, how much rock was stimulated and where, and evaluate the extent of reservoir connectivity, says Alfred Lacazette, senior geological adviser at Global Geophysical Services.
Watched in real time, microseismic data can predict areas to avoid ahead of the drill bit. Analyzed after fracturing, they contribute to better decision making for the next wells. Before fracturing, they highlight potential sweet spots based on the locations of natural fracturing swarms.
When estimating total SRV, Global Geophysical advocates a three-method analysis. Results from these methods can be compared to arrive at a best estimate. The first is a standard process that searches the microseismic data for micro-earthquake hypocenters.
A cloud, or geobody, is formed around hypocenters for each stage, providing a volume for every stage and for the combination of all stages. This process gives a reasonable estimation of the SRV, but is sometimes overly optimistic. While selective exclusion of outlying hypocenters can help, Lacazette says it leaves uncertainty in the extent of the remaining clouds.
The second method looks at near-well fractures formed while pumping fluid into the rock. For each stage, a set of fractures is interpreted as those receiving fluid and hopefully proppant, Lacazette explains. Tomographic Fracture Images™ are constructed for individual stages and then combined for the entire volume. The result is a 3-D image of the fractures. The cumulative seismic activity is indicated by color. This method captures lower-energy locations repeatedly activated over long periods, he says.
The third method takes into account activity that occurs along the wellbore, but away from the current fracturing stage, Lacazette goes on. “In many jobs, this approach seems to give a better estimate of the volume we actually are activating in the rock,” he says.
The method also takes into account the actual fractures produced from the damage incurred during drilling, he points out. “That natural fracturing may communicate between the stages, activated by fluid pressure change at the particular stage,” Lacazette states.
The entire process is data driven, adds Peter Geiser, chief technologist at Global Geophysical Services. There is no modeling. “We look at the cloud of damage, illuminated by the noise the fractures make as the rock breaks,” he relates, explaining that Global Geophysical collects “time steps” over the fracture period. Residual noise is clipped out, leaving central surfaces of high-energy clouds.
Previewing the well prior to fracturing is a key element of the analysis, according to Geiser. By monitoring ambient seismic activities for several hours preceding a fracture job, a base line can be established. Data then are collected throughout the fracture job, documenting the cumulative fracturing. Comparing the activity recorded before and during fracturing shows what areas were fractured, he says.
“We end with thousands of traces of prestack, depth-migrated data that contribute to high-energy clouds,” Lacazette explains. “The clouds represent the large, seismically active fractures. This approach provides greater confidence in reservoir connectivity, shows the extent of each stage, and predicts interference.”
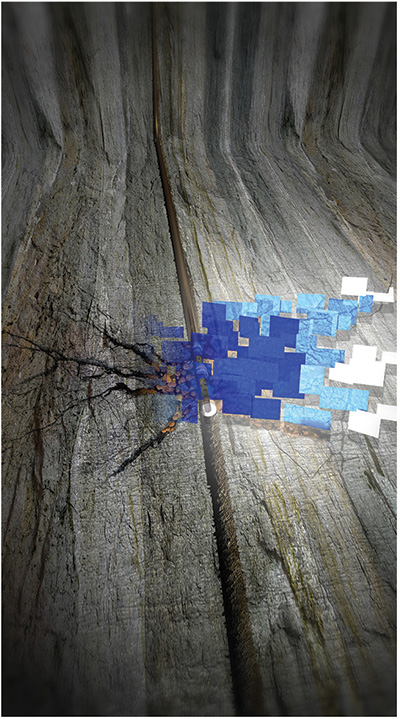
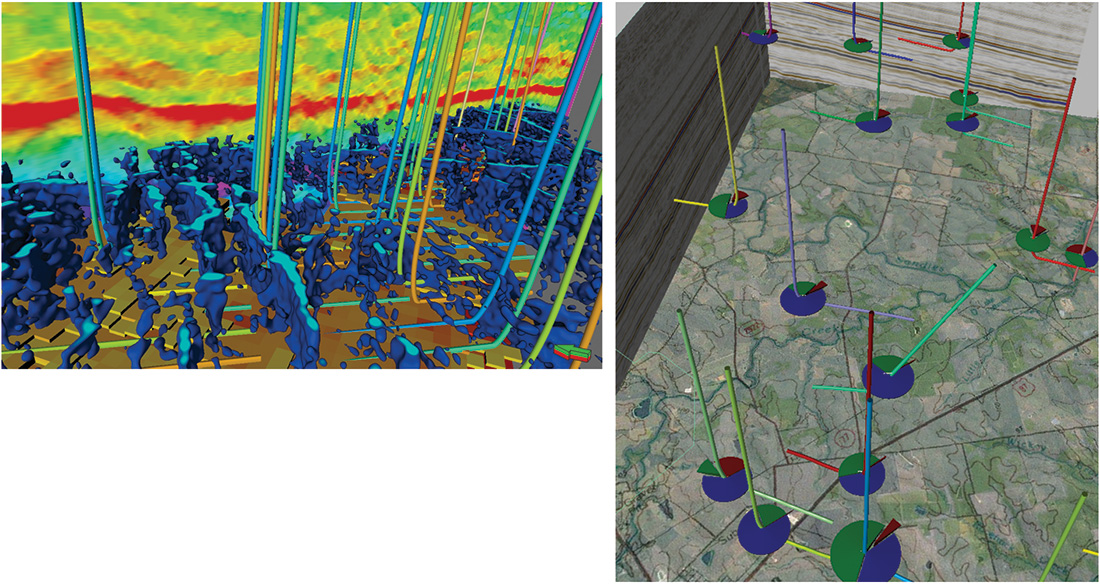
With fast shear waves propagating parallel to the dominant fracture azimuth and slow waves propagating orthogonal to fractures, ION Geophysical is deriving rock property information from surface-acquired multicomponent 3-D datasets to delineate natural fractures and determine fracture orientation. This image shows fracture intersections with a horizontal borehole.
Armed with this information, engineers can better plan adjacent wells. They may even be able to avert problems during the fracture job itself, Lacazette adds.
Global Geophysical also images ambient seismic activity during normal 3-D reflection surveys by leaving the array on when shooting or vibrating is not in progress. “By analyzing the cumulative ambient seismicity before drilling, interpreters may be able to identify sweet spots to target during drilling,” Geiser offers. “They also set an earlier base line that can be compared with any damage caused by drilling and subsequent fracturing.”
Following The Proppant
A question that dogs reservoir engineers is where the proppant actually went during the fracture job. In a tight rock formation, fractures that are not adequately propped are likely to close in time and become unproductive, according to Sarah Groen, MicroSeismic Inc.’s senior director of strategic marketing.
“Surface microseismic data identify how the rock broke, how much broke and where,” Groen says. “Taking this analysis a step further, MicroSeismic can determine where the proppant went and how effectively the well was fractured, and can provide insights into optimal well spacing and the number of stages per well.”
Groen argues that it does not matter what volume of the reservoir is stimulated or fractured, but what part of the reservoir actually will be productive. The goal is to avoid leaving hydrocarbons behind while eliminating wasted money on unnecessary stages or wells.
Hydraulic fracture mapping has come a long way from the early days of “dots in a box,” notes Groen. Analysts now can determine source mechanisms (indications of how the rock broke), including the strike, dip and rake of fractures, and ultimately the discrete fracture network, she says. “We then use the discrete fracture network to model the Productive-SRVTM,” she says. “The Productive-SRV indicates the volume of rock that was stimulated and contains proppant.”
MicroSeismic runs simulations of the fracture job to determine where the proppant went. The simulations combine recorded data with operator-provided details such as viscosity, gel, and proppant type and weight. “We track the growth of the microseismic cloud longitudinally, vertically and horizontally, with the longitudinal growth showing whether the stage spacing can be increased or decreased. Two methods are used to calculate Productive-SRV on a stage-by-stage basis for comparison and confirmation,” Groen comments.
“This detailed analysis allows operators to optimize well spacing, optimize the number of stages, and eventually to predict production,” she summarizes. “Permeability calculations, in combination with the Productive-SRV, are providing early estimations of production. We are seeing some very promising results for these early predictions.”
Key technological advances are helping support Productive-SRV calculations. For example, Groen points out that MicroSeismic’s locational uncertainty has been reduced and it can identify event locations in the vertical direction within 10-35 feet, in most areas. In the horizontal plane, events can be located within 5-20 feet. This high-definition view gives greater confidence in the mapping of both the SRV and Productive-SRV, she holds.
In addition, fracture magnitudes can be compared across wells, basins, or even operators, Groen goes on. “Magnitudes have been commonly described relative to one another within the same fracture job,” she concludes. “By providing true magnitude and high definition, the operator is able to achieve a better understanding of the effectiveness of his fracture jobs.”
Finding Fractures
Paul Brettwood, vice president of technology and strategic marketing at ION Geophysical, says multicomponent 3-D holds significant potential for deriving rock property information from surface-acquired datasets. “With today’s computing and storage capacities, we are able to analyze multicomponent seismic efficiently, and very rapidly identify rock properties,” he remarks.
With multicomponent seismic, analysts can infer fracture orientation from the sound wave orientation as it reaches the surface, with fast shear waves propagating parallel to the dominant fracture azimuth and slow waves propagating orthogonal to the fractures. The difference in arrival times indicates the extent of natural fracturing, Brettwood explains.
To solve the challenges of economically developing unconventional resources, engineers and geophysicists must work together to integrate the information into meaningful models, adds Scott Singleton, ION Geophysical’s technical manager of unconventional reservoir imaging and characterization programs. He maintains that microseismic is the link between the two technical domains.
“Together, engineers and geophysicists determine what to target in the subsurface and where to drill on the surface,” Singleton relates. “They have a rig count and budget to work within. Optimization is the objective.”
To meet that objective, Brettwood says, requires a 3-D earth model that uses all available field data–3-D seismic, multicomponent, well logs, cores, etc.–for calibration. As new or improved data become available, they are added to the model, which can be used to find the more promising sweet spots within a play area.
“We use multicomponent seismic to find natural fractures and their orientation, and we use the earth model to simulate what will happen to these fractures and the surrounding rock during the fracture job,” Brettwood says. “Following the fracturing job, the results from the recorded microseismic data are compared with modeled predictions. That helps us understand the fracture networks, velocity and rock properties themselves. If it all ties in nicely, you have good calibration and confidence is high.”
Operators want to know how the actual fracturing results compare with the prejob plan, and how the design can be improved for the next wells, adds Singleton. “With a calibrated model, the asset team is able to play ‘what-if’ scenarios, changing the proppant, fluid volume, longer or shorter stages and lateral placement, and then modify the plan accordingly as they see the results of those modifications,” he states.
SEG 2013 Part 2: Microseismic, High-Performance Computing Improves Data Interpretation
Not long ago, the playbook in unconventional operations called for drilling horizontal wells about anywhere in a “blanket” formation, so long as the wellbore stayed in zone to allow stimulation at regular intervals spaced along the lateral. The name of the game was breaking rock. While well productivity remains a function of creating fractures in low-permeability rock, oil and gas producers have come to appreciate the importance of how and where laterals are placed to ensure access to quality rock.
“People used to think that hydraulic fracturing was a cure for poor well placement,” says Halliburton Technology Fellow Ron Dusterhoft. “In reality, optimal well placement is a requirement for good hydraulic fracturing, and optimizing well placement requires focusing on rock quality.”
Operators should do everything they can to make sure their wellbores are in good-quality rock from the toe to the heel, Dusterhoft maintains. They then can stimulate the entire lateral section to get maximum productivity. He adds that if not all the wellbore is in quality rock, only the areas capable of producing should be stimulated.
Treatment design begins with a thorough understanding of rock quality. “Operators are adopting a bit of a forensic, ‘CSI-type’ approach to build their understanding of rock quality,” he observes, adding that he sees more basin modeling to understand burial and thermal history, mineral composition, hydrocarbon migration, and what is actually left in the rock.
Kerogen content and effective porosity can be evaluated then to determine available fluids and their locations within the rock matrix.
Once high-quality rock is identified, natural fractures and brittle rock must be mapped. Fracture treatment is most successful in rock that is brittle, naturally fractured, and has stresses that can lead to optimal fracturing with pumping pressure, Dusterhoft says. “Good sources for natural fracture analysis include cross-dipole sonic logs; diagnostic fracture injection tests; borehole breakout analysis; long-spaced, full-azimuth seismic; and image logs,” he relates.
By understanding the fracturing tendencies of the reservoir, analysts can design fracture treatments that provide more lateral coverage and better access to the secondary fracture system, thereby increasing liquid hydrocarbon production. To determine an effective treatment design, Halliburton is using an integrated “seismic-to-stimulation” service that uses an earth model built with all collected data.
To determine an effective treatment design, Dusterhoft recommends simulation using an earth model built with all collected data, and says Halliburton uses what it dubs an integrated “seismic-to-stimulation service” to perform this analysis. “We simulate both the drilling and treatment processes,” he explains.
Drilling simulation optimizes fluid type and density to minimize reactivity with clays, wellbore breakout, unwanted fractures and fluid loss.
Treatment simulation identifies the optimum net treating pressure that will maximize fracture complexity and connectivity at each stage across the wellbore, Dusterhoft goes on. This complex modeling can result in significant changes in recommended fluid volumes and injection rates. It affects proppant schedule, concentration and type. In some situations, Halliburton also considers pumping far-field diverting materials to help increase net pressures.
Operators prefer to use one fluid and base proppant across the entire wellbore to simplify inventory, but with this technology, Dusterhoft points out that changes can be made during the treatment itself. “While changing the design on the fly can be challenging because of logistical and operational issues, the completion team can monitor the process in real time and make adjustments between stages to optimize treatment results,” he comments.
As treatment design evolves, operators will begin to move away from geometric to optimized stage spacing, based on rock quality and fracture complexity, Dusterhoft predicts, stressing that the economic effect can be dramatic.
“The bulk of the cost of an unconventional well is in the completion. It is common for the completion cost to account for 60 percent of the total well cost, so a $7.0 million well represents $4.2 million in completion expenditures,” he reasons. “If a wellbore is drilled only 30 percent in-zone, the operator can eliminate 70 percent of unnecessary completion costs simply by not stimulating the poor-quality rock, which would save 40 percent or more of the total well cost.”
Optimizing Acquisition
Advances in land-based seismic data acquisition have made the range of choices available to operators very broad. That makes it an opportune time to optimize acquisition techniques, contends Arnaud Surpas, executive vice president of global operations for Sercel.
Sercel advocates a “hybrid” configuration of autonomous and cabled nodes for land-based acquisition. “This configuration has several advantages,” Surpas offers. “The number of batteries required is substantially lower, reducing both cost and labor. The configuration is designed for redundant data and power flows, so that there is automatic switch-over and no downtime. Plus, real-time quality control ensures that data are collected properly. Local data storage and reduced weight improve reliability and reduce crew size.”
Each data recording node can operate in real time or autonomous mode, has local storage, and includes a concentrator with up to 100 recording channels, Surpas details. “The self-adapting network has three levels of redundancy with power supply, data transmission and synchronization,” he says, noting that if an unplanned event occurs, the system will adapt automatically without the need for intervention. “Data are either rerouted or stored in the nearest concentrator.”
Hybrid, high-channel-count recording systems offer significant benefits for both seismic contractors and oil and gas operators, including flexible deployment to accommodate local terrain and environmental constraints, higher productivity, quality data delivered on time, and better compliance with health, safety and environmental regulations, according to Surpas.
“But the ever-expanding channel counts being deployed in today’s land surveys make the ability to self-adapt all the more crucial,” he says. With the newest land-based acquisition systems supporting up to 1 million channels, the huge data collection volumes make avoiding common problems that lead to downtime and lost productivity an imperative.”
Workflow Integration
Integrating disparate data and applications has greatly improved the visualization of tasks such as lease planning, says Aaron Scollard, business manager of exploration and development at Schlumberger. Maps from geographic information systems, government databases and Google Earth™ can be used as the backdrop to see how lease holdings fit into larger tracts of land. Existing wells (including those of other operators) can be plotted for reference and comparison.
As the asset team focuses on the leaseholds of interest, roads, rivers, towns and other surface features can be seen in the context of the subsurface. This “connectedness” continues throughout the exploration, drilling and production workflow, enabling improved decision making, Scollard remarks.
“The bottom line is that combining exploration through production in a single software platform for the entire asset team improves productivity,” he insists. “Learning from early drilling results and past production affects future drilling programs positively, and affords much more certainty in where you are drilling.”
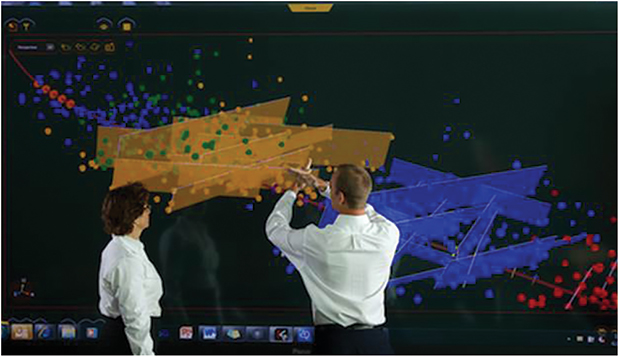
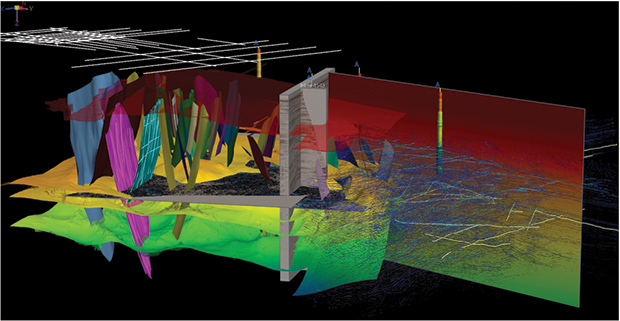
Shown at left is an example of combining reservoir quality properties with ant tracking in the Petrel software platform from Schlumberger to optimize well placement. As illustrated at right, surface data can be combined with production and seismic information in Petrel to optimize the understanding of unconventional reservoirs.
The biggest challenge for the asset team is incorporating all the data to better understand the reservoir, and then defining those new drill targets for the driller to optimize production, Scollard goes on.
Pointing out that there is generally no lack of data in resource plays, Scollard notes unconventional fields can have thousands of wells, each with significant amounts of data that can provide insights into reservoir and completion quality, and how they change throughout a basin. “The process starts with building data-rich 3-D models to identify high reservoir quality. The models include reservoir quality indicators such as porosity, total organic content, water saturation, volume of clay, volume of gas and oil in place, and production data,” he explains.
A key factor is the distribution of rock properties throughout the reservoir, according to Scollard. “The best reservoir quality can be identified rapidly using 3-D filters and analytical tools,” he says. “This information is critical to the well plan because improved placement leads to improved production.”
Completion quality determines whether the operator gets the most out of the well. “Seismic attributes are used to define faults and fractures within the seismic cube,” Scollard says. “Using natural stresses, fractures and faults results in more stimulated volume and optimal production, which helps identify the optimal drilling orientation for well placement.”
Scollard says many operators are faced with feeding the “drilling factory” in shale gas and tight oil plays, which demands a continuous supply of high-quality well locations. “If geologists and interpreters are not providing good quality areas of sweet-spot targets, the drilling department starts drilling to fill acreage,” he describes. “But a fast, integrated workflow can help find the best opportunities for high reservoir and completion quality in time to influence the field plan and eliminate unproductive wells.”
Simulation Modeling
The Petrel software platform from Schlumberger provides analysis that combines production data and other geological parameters, maps and 3-D seismic cubes to predict where the next best production area is within a given field, according to Scollard. “Instead of drilling to fill acreage, you can drill to improve production,” he states.
Simulation modeling is an invaluable tool for the asset team. “For field planning, you can run scenarios on uncertainty or optimization to get a full understanding from a very early stage of how many wells you need, what orientation gives the best production, and the optimal lateral length,” Scollard outlines. “You also can estimate field development costs.”
The asset team can specify details such as roads, rivers, the acreage owned, landholders, and the dip and terrain of the land itself. “You can specify that you would rather place a well or pad in a flat area than in a hilly area, for example,” he relates. “The simulations also take into account subsurface constraints such as existing wells and ‘no-go’ areas with overpressures or other subsurface drilling hazards. Simulation frequently is used to minimize environmental impact as well.”
At the individual well scale, the asset team can analyze the reservoir and completion quality to determine where to position the fracture stimulation. Rather than simple geometrical fracturing, operators can position stages in the optimum locations to get the best stimulated volume, Scollard reports.
Fracture simulation is based on geological information, fluid pumping rates, and other details that determine the stimulated volume. A history match to production data validates the understanding of the subsurface, Scollard adds.
“Using an integrated approach will optimize your understanding of an unconventional reservoir, allowing for accurate well placement based on all available information,” he concludes.
Creating Differential Value
Arshad Matin, president and chief executive officer of Paradigm, notes a critical distinction between conventional and unconventional formations that is greatly affecting the role of geophysics. “Exploration traditionally has been about finding hydrocarbons,” he says. “With unconventional reservoirs, we know where the hydrocarbons are; they are pervasive, but not necessarily recoverable. The challenge really is economic extraction.”
The critical business need revolves around identifying the optimal sweet spots and then drilling that area in a cost-effective manner. That demands greater speed in workflows, Matin asserts.
“Operators will tell you the ability to create differential value is how well they can operate their workflows for hydrocarbon extraction,” he remarks. “Field operations are being Web-enabled. Seismic data and drilling information are being collected in real time. All of this contributes to faster and more economic extraction.”
It also requires broader integration between different disciplines, according to Matin. An efficient workflow spans and integrates petrophysics, geophysics, geology and engineering in a seamless fashion, he adds.
“As larger companies move into unconventional plays, they bring a greater rigor and full portfolio of technology and techniques to bear,” he says.
Matin identifies three key changes that have a dramatic effect on economics:
- Integrating advanced science into a single platform;
- Making advanced science accessible and usable to everyone; and
- Improved computational efficiency.
“To perform high science, you often had to go to a specialized platform,” Matin observes. “That took time to move data back and forth, and the data looked different and felt different. The key is to integrate into the main platform advanced science that previously sat in specialized tools.”
Matin says he wants to “democratize” advanced science for everybody, and not just the most senior and experienced staff or the best capitalized operators. “To me, advanced science means precision science and mathematical algorithms that are not restricted to the domain of specialists,” he offers. “The balance that must be struck, however, is that the needed scientific precision cannot be lost in order to improve usability.”
Automating basic data analysis functions provides a way to streamline processes and improve productivity, Matin goes on. “With a shortage of experienced talent in the industry, anything that can create more capacity through automation will be helpful to everyone. Horizon and fault extraction are two excellent areas for automation,” he holds. “Making software more intuitive and easier to use, with comprehensive online instruction and training, is also very important to operators.”
Finally, Matin says next-generation display technology, coupled with advances in graphics processing units (GPUs) and multicore processors, are enabling new visualization and processing capabilities that can improve data interpretation productivity and effectiveness.
“Interpreters now can work on high-definition, large-screen displays and process massive amounts of data in real time,” he observes. “Multicore HPC and GPU solutions are making high science computing available to everyone at a low cost. Part of the reason people are making more use of seismic is that they can do things now on standard hardware that they could not in the past.”
General Purpose GPUs
Leveraging the GPU for greater processing efficiency is catching on with software application developers. It is also a growing area of research for institutions such as the Center for Research in Extreme Scale Technologies at Indiana University. Doctoral student Eric Holk has focused his attention on developing a GPU-optimizing language as a model for how to take full advantage of available computing resources.
Field operations in unconventional resource plays require broad integration between different disciplines with an efficient workflow that seamlessly integrates petrophysics, geophysics, geology and engineering. Shown here is an example of multisurvey, regional-to-prospect interpretation and visualization capabilities from Paradigm that are enabled by integrating advanced science into a single platform that everyone can access and use, as well as improved computational efficiencies.
The GPU was designed to focus specifically on rendering graphical elements of software applications. This focus required the device to parallel process, making it extremely efficient at repetitive calculations, Holk details, adding that it is increasingly recognized as a potential resource for dramatically speeding certain computations that are common in geophysical processing and interpretation, as well as other intensive tasks. This generalized use is referred to as general purpose GPU (GPGPU).
The first leap in easy access to the GPU came with the release of NVIDIA’s interface, the compute unified device architecture (CUDA). This architecture allowed programmers to direct code to the GPU without rewriting it from popular languages such as C++ and Fortran. “Prior to CUDA, programmers had to translate their code into graphical elements the GPU could render, then translate the results back,” explains Holk. “CUDA writes the code directly.”
Paradigm Software is among the geophysical software and service companies making extensive use of general purpose graphic processing units to improve interpretation accuracy and speed. Shown here is a Karst visualization in the Barnett Shale using graphic processing unit-based rendering.
CUDA has limitations, however, including its exclusivity to NVIDIA GPUs. As part of his doctoral studies, Holk began research into alternatives. One result is called Harlan, which he says is GPU agnostic and capable of running on central processing units as well as GPUs. “This makes code very portable and adaptable,” Holk states. “Harlan determines where to send the code, based on available resources and code requirements.”
Holk built Harlan as a research language to explore what was possible. It can be used as an embedded domain specific language, allowing programmers to use it as a sublanguage to C++ or .Net without rewriting their application. “This offers users the advantage of aggressive optimization,” he notes.
Harlan supports functional programming features on the GPU, including tree structures and arrays, plus higher-order procedures, providing tremendous power and flexibility. “Harlan’s macro system allows the programmer to write code that transforms code,” Holk adds.
GPGPU-Enabled Workflows
Paradigm is an example of a geophysical software company that makes extensive use of the general purpose graphic processing unit to improve interpretation accuracy and speed by assisting geoscientists who have to interpret and model data under tight project deadlines, says Duane Dopkin, executive vice president of technology at Paradigm Software.
The company uses GPGPU for such activities as voxel-volume rendering for generating extremely high-fidelity 3-D rendered images with rapid refresh speeds, and for eliminating the graphical artifacts common with slice-based rendering, according to Dopkin.
GPGPU also supports stratigraphic interpretation with multihorizon flattening and on-the-fly seismic attribute computations at Paradigm. The GPGPU is used in model operations to construct geologic grids, where the grids are created by solving large inversion matrices, continues Dopkin.
“While some of these algorithms are coded with CUDA specifically, other implementations are more general, where the same code base is compiled for both GPGPU and multicore CPU operations,” he details.
Interpreter Efficiency
The need for faster computing of ever-larger datasets and the demand for quicker drilling decisions have driven a renewed focus on interpreter efficiency, says Carl Huxohl, product manager at Jason, a CGG company. “Improvements come in key areas, including usability, visual display, on-the-fly conversions, iterative processes, tighter integrations and more comprehensive workflows for reservoir characterization,” he says.
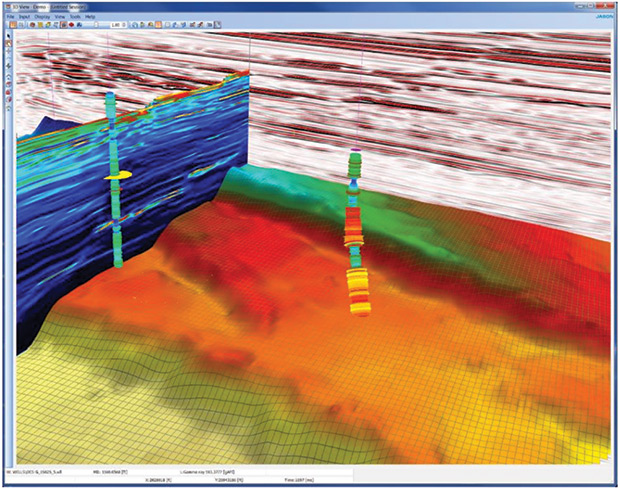
The need for faster computing of ever-larger datasets and the demand for quicker drilling decisions is driving a renewed focus on interpreter efficiency. Jason’s quantitative integrated interpretation workflow is designed to guide users through interpretation and ensure that the same path is followed by everyone involved for rapid, accurate and repeatable results. Shown here is an example of volume visualization and interpretation.
The potential user community is larger and more diverse in unconventional plays, Huxohl notes. In this new reality, it is helpful for users to have a specific workflow to follow. Jason’s quantitative interpretation workflow helps guide users through interpretation and ensures that the same path is followed by everyone, Huxohl says.
In this way, results are repeatable and multiple players can participate without changing the underlying approach. In addition, integrating the entire interpretation workflow lets users spend more time interpreting and less time moving data back and forth between application suites.
Huxohl says interactivity and interrelated 3-D views are expanding the way interpreters can rapidly review their data, particularly when looking for elusive sweet spots and potential hazards. “Histograms can be linked to color bars to show properties in vivid detail from a variety of 3-D perspectives,” he remarks. “Properties can be swapped interactively to compare and contrast the data at particular lines or as a whole to allow the interpreter to easily discern relationships between the data.”
Great effort has been made to simplify interactions without sacrificing functionality, says Huxohl, making the tools more broadly usable for occasional or nonspecialist users. “Interpreters need to review vast amounts of data in unconventional plays,” he holds. “Making it easy for them to interrogate and investigate data from many perspectives simultaneously has enabled them to make better, faster decisions.”
A new 3-D tracking tool in the Jason suite tracks a peak, trough, value or slope as set by the interpreter. “Automation is a practical way to speed interpretation, as long as there are ways to ensure quality control,” Huxohl adds. “For example, interpreters can set maximum jump per trace, minimum cross-correlation, and stop conditions such as faults. Threshold control can be tuned to find the best cross-correlation value.”
Fault visualization is another key in unconventional interpretation. “Interpreters want to view faults in different ways, depending on the particular objective,” Huxohl says. “The interpreter may want a ribbon view, fault view or intersection view, but multiple fault visualization is supported in all these views.”
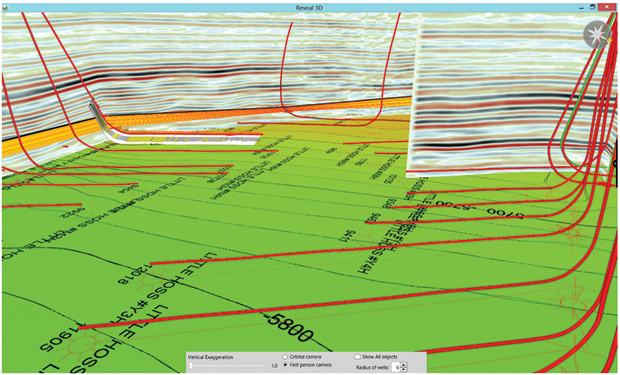
Oil and gas companies are analyzing well spacing in many resource plays to determine the optimal spacing units for efficient development and recovery. LMKR’s field planning solution is designed to integrate 3-D seismic interpretation, geomodeling and geology for fast and precise well planning and analysis across an asset.
Automatic conversion between depth and time displays provides a powerful visualization aid. A 3-D position tracker can be used to select any location in a 3-D view and see where the position is located in depth or time, and the operator can dynamically switch between time and depth. With “body checking,” interpreters can look at property ranges and spatial connectivity. This allows them to see geologic facies directly in the data.
“This helps interpreters trying to find geologically meaningful properties to perform very specific volumetric analysis to determine the potential volume of a play,” he describes.
The biggest challenge Huxohl sees is that engineers are generating data faster than they can be analyzed. “A widely quoted statistic is that 60-70 percent of fracture jobs were a waste,” he says. “Enabling interpreters to deliver better and faster drilling advice is one way that Jason helps clients reduce risk and boost reservoir productivity.”
Well Planning
Oil and gas companies are taking a hard look at well spacing in many resource plays to determine optimal spacing units. As operators gain more experience in particular resource plays, the need to quickly analyze field development options based on data acquired becomes an important part of the development workflow, says Stan Abele, vice president of product management at LMKR.
To that end, Abele says LMKR is stepping up its integration of 3-D seismic interpretation, geomodeling and geology. “At the same time, however, the ability to quickly make the most informed decisions possible is a critical element for interpreters working in unconventional reservoirs. That means a growing need for fast and accurate field and well planning,” he holds. “Interpreters need tools that are integrated and rapidly provide an updated understanding of the subsurface. In unconventional plays, that generally means faults and high natural fracture areas.”
As in all other aspects of unconventional reservoir development, Abele says economics is the biggest factor in well spacing decisions. “The higher cost of closer spacing must be offset by greater reserves recovery,” he reasons. “To see the results of different well spacing intervals, it must be quick and easy for the asset team to do field planning.”
Field planning is a complex process that begins with held acreage and reality of the surface. This is combined with an analysis of the subsurface to determine a program that optimizes recovery. “A key element is scenario analysis,” Abele points out. “Interpreters need to quickly evaluate different situations and outcomes.”
Abele advocates 3-D models that incorporate all available data to give the best perspective. “Interpreters need to be able to analyze field plans in the context of other information,” he says, noting that the latest well planning solutions let users very easily check the validity of field plans by creating actual directional surveys for the proposed wellbores. “This gives a much better idea of whether wells are optimally targeting the interpreted sweet spots. Once a plan is devised, the engineer likely will put it into his specialty tool of choice for finalization.”
Field planning tools should be straightforward to use and inexpensive to buy, according to Abele. Complex tools tend to put the work into the hands of a few who may be disconnected from the local geology and knowledge.
“It makes a lot more sense to put high-end solutions in the hands of the people with the most knowledge,” he offers. “Rather than having a specialist work on a field plan, if the asset team working a given area and is already familiar with it has the basic capabilities to do the field planning work, the whole company’s operations can become more efficient,” Abele concludes.
Advanced Attribute Analysis
Techniques that concentrate on a few key seismic attributes have proven highly effective in finding anomalies in subsurface datasets. But Tom Smith, chief executive officer of Geophysical Insights, says technological advances are making it possible to use seismic attributes in almost infinite combinations to delineate anomalies in unconventional plays.
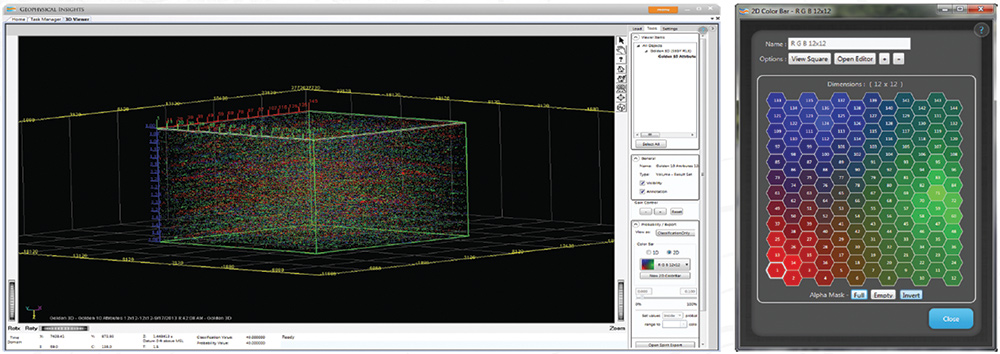
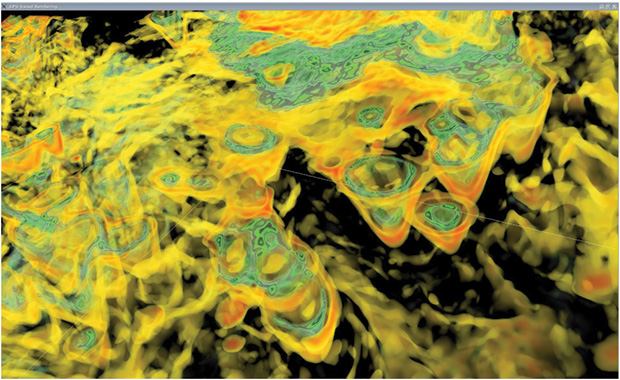
Geophysical Insights’ Paradise™ analytic software platform applies automated pattern recognition to analyze seismic attributes in almost infinite combinations to delineate anomalies in unconventional plays. The workflows use unsupervised neural networks and principal component analysis while taking advantage of high-power multicore processing using large-scale parallelism to accelerate performance. Shown here are attribute analysis results presented in a 3-D viewer with a 2-D color bar for interacting with the data volume.
There are hundreds of potential attributes of interest in seismic data, he notes. Reviewing them all to find the best attributes for analysis, and then using them to find sweet spots is a demanding task. “We set out to apply automated, unbiased analysis to this problem,” Smith says. “We developed Paradise™, an advanced geosciences analytic software platform, to enable interpreters to apply these advanced pattern recognition methods to address this problem.”
Smith says Paradise provides workflows that guide geoscientists through the application of unsupervised neural networks (UNNs) and principal component analysis (PCA). “Paradise also takes full advantage of high-power, multicore processing using large-scale parallelism to accelerate performance of these advanced techniques,” he says.
Unconventional reservoirs have introduced a new suite of rock mechanics properties, and Smith says the industry is still learning which ones provide the most valuable insights. UNNs have the advantage of running uninterrupted and unbiased by human assumptions.
“UNNs offer the advantage of operating on seismic data alone without the need for well logs. Where well logs are available, those data can be included in the UNN analysis, as can data from hydraulic fracturing,” Smith states. “The more data provided to the system, the more information we can discern from the results. We view this process as advantageous because we make no assumptions about linear or statistical combinations.”
Smith points out that even the most detailed well logs represent a tiny sampling of the subsurface. “It is not that obvious how to sort the properties,” he observes. “Running a supervised neural network is problematic in unconventional plays because the rock properties known at the borehole are an extremely limited sample set. Better tools are needed to lower exploration risk in unconventional plays. By applying both UNN and PCA on the seismic response, greater insights can be realized about the geology and sweet spots identified.”
UNNs look at the natural properties and find natural clusters that are not artificially biased in any way. “We are working in n-dimensional space, where n is the number of attributes,” Smith details. “Attributes can vary in data type and some parameters are predetermined.”
In unconventional formations, interpreters typically search for overpressured zones, sweet spots, AVO and fracture networks. They also look for anomalies and anything that is out of the ordinary. “Neural networks can scan large volumes to find areas of interest for further analysis,” Smith explains. “This capability enables interpreters to focus more effectively and efficiently.”
While the results of attribute analysis are presented in a 3-D cube, Smith says his team has built a 2-D color bar in the Paradise software to more effectively analyze and interact with the volume. The user selects a few neurons on the 2-D color bar, and the 3-D representation highlights only the regions in the volume that correspond to those neurons, enabling isolation of the classification results.
“Each neuron illustrates a different aspect of the data, including geologic features,” Smith says. “The 2-D color bar reduces the complexity to an interface that is more easily understood.”
To help “tease out” the best attributes, Smith says he recommends principal component analysis. “PCA looks at every possible pair of attributes for statistical correlation,” he says. “The covariance matrix is reduced through Eigen analysis to sort out in multidimensional space the primary direction that gives the best information and the highest variability of the seismic attributes. The attributes identified as contributing the most information then can be analyzed using UNN. This combination is very powerful for solving certain problems.”
Smith says he sees great potential for neural networks and their application throughout the industry. “There is a lot of number crunching that goes into each of the neurons, which learn, adjust and are attracted to natural clustering. We should not simply throw them away, but instead, gather them into libraries of corporate wisdom. In the Paradise software, we refer to this capability as enterprise neural assets (ENAs),” he attests. “We believe ENA is the next generation in the evolution of geoscience analysis tools, building libraries of knowledge assets in the form of neural network results that can be shared among disciplines to reduce exploration time and risk.”

KARI JOHNSON is a writer and marketing professional with decades of experience in computing technology and the oil and gas industry. Her company, Bold Stroke, helps companies understand market trends and communicate value. Johnson serves as a special correspondent for “The American Oil & Gas Reporter,” covering a variety of industry technologies and applications, including advancements in the geosciences and computing tools and techniques. She began her career at Shell Oil Company, where she held a variety of technology and information-related positions, then moved into high tech companies, where she held numerous positions in marketing and sales support. Johnson holds a B.A. and a master’s in information and library science from the University of Michigan.
For other great articles about exploration, drilling, completions and production, subscribe to The American Oil & Gas Reporter and bookmark www.aogr.com.