


Shale, Tight Sands ‘Mega’ Plays Changing Behavior Of North American Gas Market
By Tim Beims
If 2008 is remembered as the year in which the bubble burst on the U.S. economy, 2009 may well go down as the year in which the bubble returned in domestic natural gas supply–at least temporarily.
Throughout the 1990s, the North American gas market was characterized by a buffer between productive capacity and demand. The supply bubble burst as the 1990s came to a close, the result of accelerating decline rates in legacy basins and incremental demand growth. Then along came a new type of supply: gas sourced from ultralow-permeability rocks once considered little more than “trouble” formations that could be a nuisance to drill through on the way to underlying targets.
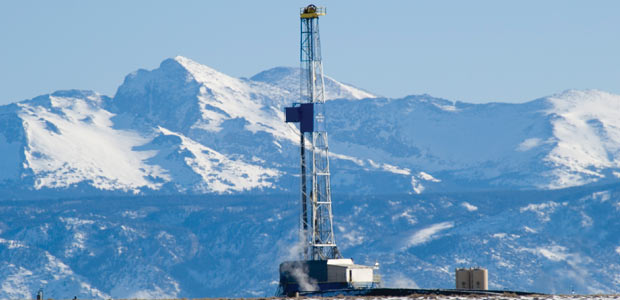
With vast amounts of gas, huge stretches of continuous prospective play acreage, and horizontal drilling and multistage completion techniques delivering off-the-chart initial production rates, shales and tight sands quickly have become dominant variables in the supply/demand equation. The emergence of these plays looms large in explaining U.S. Energy Information Administration reports of record reserves and storage inventories.
More to the point, after years of “holding the line” on production, EIA says domestic supply output experienced its first significant growth in years, with total 2008 marketed production jumping to its highest level since 1974.

Combined with an erosion in gas demand related to what economists have dubbed the most severe economic downturn since the Great Depression, a cushion between supply and demand has re-emerged in domestic natural gas. But does it mean the industry has a new bubble on its hands?
“Anyway one cares to looks at it, U.S. gas producers certainly have the capability to generate a supply bubble. As unlikely as that would have sounded a few years ago, when the concerns were all about supply tightness, the development of unconventional shale ‘mega’ gas plays is dramatically changing the behavior of the market. We now have huge, high-productivity unconventional gas resources to meet future demand,” responds Philip H. “Pete” Stark, vice president of industry relations for IHS CERA in Englewood, Co.
According to Stark, IHS economic models indicate that 2010 North American demand should recover roughly in line with the levels of mid-2008. “While demand will be healthy, it is not going to represent an increase over prerecessionary demand, and we know we have the capability to employ more rigs to boost production well above that level,” he goes on. “The industry is learning as it goes forward in these plays exactly how much drilling–and where–will deliver adequate gas supplies.”
Profound Implications
Striking the correct balance between supply and demand will take time. The economy is still far from firing on all cylinders, the experts say, and looming regulatory and policy decisions could hold major sway in determining how much demand could expand going forward. Still, the lesson that should be learned from the past couple years is that watershed change has occurred in North American natural gas, and the implications are profound for both producers and consumers, according to John Harpole, president of Mercator Energy in Littleton, Co.
“The roller coaster ride is over,” he declares. “Because of the technological breakthrough of shale plays, natural gas can now be looked on as plentiful, dependable and secure. The industry is no longer exploring for gas, but manufacturing it. In this new manufacturing paradigm, utilities should realize that the days of natural gas price volatility are over.”
The development of shale and tight-sand reserves–pioneered by U.S.-based independents–not only changes the game in domestic energy, but also strikes a blow for liberty across the globe, Harpole contends. “It is hard to fully appreciate the historical significance of shale gas production, but it probably will prove the biggest thing to happen in natural gas in our lifetimes. Combining horizontal drilling and multistage hydraulic fracturing opens shale plays all around the world,” he says. “It may sound overly dramatic, but I think it will do more for freedom than anyone today can imagine.”
Citing the European market’s reliance on supply from Russia’s Gazprom as an example, Harpole adds, “With global shale gas development, it will be very difficult for any one country, cartel or company to force any group of users to accept a gas price. I will go a step further and say that the United States should be exporting gas to Europe. Looking at U.S. trade deficits, the question shouldn’t be why export gas, but why not?”
That would mark an abrupt about-face from only a couple years ago, when proposals seemingly were cropping up everywhere to build liquefied natural gas facilities to land imported gas, as well as construct long-haul pipelines to move Arctic gas southward. What has redrawn the supply picture so markedly in such short order, according to J. Marshall Adkins, director of energy research and managing director of equity research at Raymond James & Associates in Houston, can be summed in two words: unconventional gas.
“With shale and tight sands gas, it is going to be very long time before supply shortfalls become a concern again in North America,” he comments.
Fewer Rigs, More Gas
Adkins points to dramatically improved productivity per active rig as a key take-away point from the industry’s move into unconventional resources, which he says is driven by production and reserves recovery gains from long-lateral horizontal drilling and multistage completions. “It is becoming increasingly apparent that the shift to high-grading more prolific plays such as the Haynesville and Marcellus shales is allowing the industry to grow supply at a lower rig count,” he states.
The Baker Hughes U.S. weekly count averaged 701 gas rigs from the first week of June through the third week of November (touching a bottom of 665 in July), which was down from an average of 971 for the 21 weeks from the start of January through the end of May. That was off sharply from a weekly average of 1,491 active gas rigs in 2008 (peaking at 1,606 in September), and reversed a six-year upward trend in Baker Hughes’ gas rig counts (1,025 in 2004, 1,184 in 2005, 1,372 in 2006 and 1,466 in 2007).
Conventional wisdom holds that such a precipitous year-to-year reduction in drilling should result in an equally emphatic response in production. But through August, EIA data show that not only did each of the first eight months of the year experience higher production output than the corresponding month in 2008, but the totals through August were the highest volumes recorded for each month since the early 1970s.
“Supply is not coming off very fast, although directionally, the latest data points suggest supply is beginning to move downward,” Adkins reports. “Based on data from public companies, it looks as if U.S. supply was down 1.0 billion-1.5 billion cubic feet a day though the end of the third quarter compared with the first quarter. Our model predicts a supply decline of 3.0 Bcf/d by early next year. So while supply is trending down, there is no question that the magnitude of the response is nowhere close to what many expected.”
Why the disconnect between rig counts and production output? The answer, Adkins says, is in the type of well being drilled. While vertical well activity has plummeted by more than 60 percent, horizontal rig counts are down only about 20 percent since topping at 650 in October 2008. “The horizontal rigs are drilling the shale plays, and each of these rigs is much more productive than a vertical rig, offsetting the decline in the overall rig count,” he explains. “In essence, the correlation between total rig count and production doesn’t mean what it used to.”
Improved Rig Productivity
To better understand the impact of improved drilling efficiency and productivity, BENTEK Energy has developed a “rig productivity index” that takes into account not only the rig count, but also the impact of technological advances and efficiency gains on production, according to Tom Sherman, senior energy analyst at the Evergreen, Co.-based company.
“The productivity index shows that the ‘effective’ rig count is much higher than the actual rig count because the rigs that are operating are far more productive than the ones operating in the past,” he says. “We have seen evidence of these efficiency gains in pipeline flow data. While the rig count was falling, gas production receipts on the pipeline grid were continuing to increase.”
According to Sherman, natural gas production is now a function of rig efficiency, and not the absolute number of rigs, because horizontal drilling and multistage completions in unconventional plays enable operators to produce more gas with fewer rigs. “With the efficiency gains per rig that we are seeing in today’s fleet, production can remain flat or even increase with a rig count that is 50 percent less than last year,” he claims.
As an illustration, Sherman points to an analysis by Helmerich & Payne International Drilling Co. that indicates Barnett Shale wells drilled in 2008 were three times more productive than the average onshore gas well drilled in 2006, while wells drilled last year in the Haynesville Shale in East Texas and Northwest Louisiana averaged 10 times more production.
“This is a complex issue because improved technology has impacted almost every stage of the drilling process, from spudding to well completion. The time to drill and complete a well is significantly shorter than two years ago,” he says, noting that in the Green River Basin in Wyoming, the average number of wells drilled per rig per month increased from 1.4 in early 2007 to 2.1 by the second quarter of 2009.
In step with improved rig efficiency, the volume of gas produced per well also is climbing with the emergence of shale and tight-sands plays, Sherman continues. “For example, in the Green River/Overthrust, initial production rates have climbed to an average of 2.2 million cubic feet a day compared with 1.5 MMcf/d two years ago,” he observes. “Green River production gains have mainly come from directional and multiwell pad drilling in tight-sands formations in the Pinedale Anticline and Jonah fields.”
Shifting Well Demographics
So if the material evidence suggests unconventional resource plays can deliver more gas with fewer rigs, it begs the question of exactly how many rigs are enough. “I do not think we can grow supply running 650-700 total gas rigs, like the industry has been since last summer,” Adkins responds. “But supply probably would start growing again if the rig count gets back to 900-1,000.”
Again, the key is where those rigs are running, Stark says, noting that the proliferation of horizontal drilling and multistage fractures in emerging shale gas reservoirs is shifting the nature of the domestic production base as lower-volume, higher-cost mature gas plays are being passed over in favor of shale wells with many times the initial production rates. “The demographics of U.S. well quality have changed greatly over the past year. The realization of that is the fact that rig counts dropped almost 60 percent during the past year, but we still have no clear evidence that gas supplies are dropping,” he comments.
It also explains why horizontal drilling has increased this year in plays such as the Haynesville and Marcellus, even while drilling programs were pared virtually everywhere else, Stark goes on. “Recent Haynesville and Marcellus wells are delivering very high IPs,” he states. “The rapid evolution of the Haynesville and Marcellus, as well as the Horn River Shale in Canada, is creating huge new supply potential.”
Comparing 2007 with year-to-date 2009, Stark says IHS estimates there will be 6,000 fewer wells drilled this year with IPs of less of 500 Mcf/d. “Those 6,000 wells would have made 1.1 Bcf/d in initial production. On the other end, an estimated 300 more wells will be drilled with IPs greater than 10 MMcf/d, adding 4.7 Bcf/d of initial production. Even though 5,700 fewer wells will be drilled, the result is an increase in gas productivity of 3.6 Bcf/d. The 300 high-volume wells that are drilled have four times the initial productivity of the 6,000 wells not drilled,” he explains. “That, in a nutshell, is why gas production is not dropping.”
Demand Trends
The trouble is, of course, that while the industry has been busy proving up unconventional resources, demand has trended the opposite direction of supply in key sectors such as industrial consumption since the economy began flagging more than a year ago, Adkins notes.
“On a 12-month moving average, industrial demand is down 2 Bcf/d, bottoming in July. That is obviously a significant decline. While we do not see industrial demand completely returning next year, there should be improvement on the order of 1 Bcf/d by mid-2010,” he states. “Our confidence is based on the fact that inventories of numerous goods have been drawn down, which means manufacturers will have to fire up plants again to start replenishing inventories.”
The second key demand component is electric generation, a market that was hit hard by the recession, Adkins reports. “U.S. power consumption has been down by a phenomenally large number in 2009, pushing a 5 percent drop during the first half of the year,” he says. “The market has never seen anything like this; electric demand had never declined more than 2 percent in any given year.”
However, Adkins adds that the impact on natural gas has not necessarily been detrimental. “Gas prices were low enough that generators switched from coal to gas wherever they could. In fact, we think we have seen 1.5 Bcf/d more demand this year because of fuel switching,” he says. “Gas-fired power demand will remain very sensitive to price. If gas stays above $5.00 an Mcf in 2010, we probably will see switching back to coal.”
Even so, electric generation is the most viable growth area for natural gas in the intermediate term, Stark insists. “Significant demand potential exists either as a complement to wind, which is intermittent, or as a replacement for coal, with the growing carbon reduction concerns,” he remarks. “But there is a lot of uncertainty in Washington over policy issues that could impact gas consumption in power generation, and that is hanging over everyone’s head.”
Harpole says natural gas could emerge as a big winner if the mandate to add renewables to the nation’s energy grid proves ineffective at reducing carbon dioxide emissions. “Renewables are going to get a harder look in 2010, and wind energy is no longer going to get a free pass,” he remarks. “There is no peer-reviewed document in the world that says wind energy reduces CO2. It is a tough story for some people to hear, but it has seismic implications if true.”
That, indeed, appears the case in Colorado, he adds, where the state has embarked on a program to convert much of its generating capacity to wind. “The data indicate that Colorado may actually have higher CO2 emissions because of integrating wind into the grid,” Harpole holds. “Utilities are backing up wind and cycling with simple-cycle gas and coal plants. If the same volume of gas that is now backing wind in simple-cycle turbines was base-loaded to combined-cycle turbines, it would reduce CO2 emissions by 30 percent.”
Switching To Gas
Longer term, Harpole predicts that a significant amount of coal-fired generation will ultimately be switched to combined-cycle gas combustion turbines, driven both by economic and environmental factors. “If the 75 highest-polluting coal plants are plotted on a map, 40 percent of them overlay the Marcellus Shale play. Is gas the solution? Will it be the new steel in states such as Pennsylvania? If the market is allowed to function freely, I think gas will begin displacing coal in electric generation.”
A predictable seasonal demand load in stable power generation markets could lead to the resurgence of long-term, fixed price contracts, Harpole suggests. “The Achilles’ heel for gas in electric generation always has been price volatility. We can eliminate the volatility that makes electric utilities anxious by locking in a fixed price for 10 years while allowing the producer to earn an adequate rate of return,” he maintains. “Long-term, fixed-price contracts are back on the table, and I would bet that 15 percent or more of all gas sold will be on long-term, fixed-price contracts in five years.”
With the Obama administration proposing to overhaul hedging regulations in ways that Harpole says would substantially increase hedging costs, perhaps to the point of precluding smaller producers from hedging, long-term contracts with utilities could present a viable solution.
“For producers, long-term contracts act like a built-in hedge, bringing stability, price assurance and certainty of capital expenditures. We also will see volumetric production payment-type deals, where utilities buy into underground reserves,” Harpole predicts. “We are involved in a couple projects now, helping producers negotiate volumetric production payments with utility company counterparties.”
One of the challenges for producers is delivering to power generators the message that gas is affordable and reliable, Harpole concludes. “There are still decision makers in utilities across the country who do not know about the technological breakthrough related to shale gas,” he says. “We have in excess of 150 years of gas supply by some estimates, and base-loading gas-fired generation will help utilities meet their emissions goals.”
Sorting Out Process
In the short term, Stark says the market will continue to be characterized by plenty of supply and moderate prices, with the industry’s recovery mimicking the recovery of the broader U.S. economy. “IHS Global Insight predicts a fairly soft economic recovery in 2010, with slower growth in gross domestic product compared with late 2009,” he relates. “IHS Global Insight sees 2010 as a ‘sorting out’ year in the gas market, followed by the rebalancing of supply and demand in 2011-12.”
According to Stark, part of that sorting out process will include redirecting some traditional gas flows pressured by growing shale plays, as well as Rocky Mountain gas moving eastward on the Rockies Express Pipeline. “One of the biggest questions is how much gas can the market absorb? High-volume gas from the Haynesville, Marcellus and Horn River shale plays is likely to displace supply from other basins,” he comments. “These same plays are pushing significant volumes of LNG imports out of the market, which is very healthy for energy security and the economy, but is also part of the shakeout.”
One of the fundamentals dragging down the outlook for gas prices next year is storage facilities filled to capacity. The EIA reported a record 3.83 trillion cubic feet in inventory on Nov. 13, 12 percent above the five-year average. But not even that tells the whole story of how much gas is potentially available, according to Stark.
“We sampled three important plays–the Piceance Basin, Haynesville Shale and Barnett Shale–and identified more than 300 wells that had not been connected 90 days after they were completed,” he says. “This infers that a significant number of wells being drilled are not being connected because of market conditions. Deferred production could be as high as 1 Bcf/d or more.”
On the other side of the ledger, Stark confirms that IHS CERA analysis shows that shale and tight-sands plays are characterized by high decline rates, but he says what that ultimately could mean to supply is still subject to debate. “IHS calculated that annual depletion accounted for 16 Bcf/d (25 percent) of the 63 Bcf/d produced in 2008,” Stark says.
“That means we need to generate 16 Bcf/d of new gas each year to maintain production. Models indicate that 2009 gas drilling may fall short of the 16 Bcf/d target. But considering that we entered the year with several Bcf/d of excess production capacity, it really means that there are fewer hurdles to rebalance supply with demand.”
Adkins agrees that first-year decline rates are every bit as steep as advertised, but says replacing conventional production with gas from shales and tight sands nevertheless leads to supply gains over time. “A horizontal shale well may decline 70 percent in the first 12 months, but if it came on making 7 MMcf/d, it will still produce more than 2 MMcf/d for a long time,” he points out. “Once enough wells have been drilled, as in the Barnett Shale, a base of slower-declining production is established, and the ‘tails’ of these horizontal wells stack up to create a large, sustained volume of production.”
Price Expectations
So where does all this leave expectations for natural gas pricing, the trigger on industry activity? EIA reports that wellhead prices averaged $3.75 an Mcf through August (compared with $8.92 an Mcf during the same period in 2008), while the New York Mercantile Exchange price averaged $3.92 an MMBtu through September (compared with $9.80 an MMBtu during the first three quarters of last year).
“Oil looks rock solid for 2010, but the natural gas side remains in a state of flux. Overall, the rig count should move higher and things should improve in 2010, but we do not anticipate big jumps in either price or rig count,” Adkins relates. “Gas drilling activity is not going back to 1,500 rigs anytime soon. We are thinking more like 900 gas rigs on average next year.”
Earlier this year, Raymond James & Associates forecast a gas price of $5.50 an Mcf for 2010, but Adkins says market mechanisms now indicate a price closer to the $5.00 range. “From where the market was a year ago, $5.00 gas may seem low, but it is not a disaster by any means,” he remarks. “I was around when we celebrated gas going from $1.50 to $2.25 an Mcf, so I do not think $5.00 gas is that big a problem from an activity standpoint.”
In fact, Adkins says, $4.50-$5.00 is the likely price range not only for next year, but perhaps for some time to come. If, in fact, the market does stabilize at around $5.00 an Mcf, a large number of shale plays appear competitive at that price, which means there would be little economic pressure to reduce drilling in higher-performing plays in a $5.00 gas world. Two factors have combined to make unconventional resource plays profitable to develop at a lower commodity price threshold, according to Adkins.
“First, overall drilling and completion costs have fallen 40 percent in the past year. Second, operators are drilling half as many wells as before, so presumably they are drilling their best prospects. The result is that the price at which drilling and development becomes economic is far lower than it was a year ago,” he points out.
“Our view is that the industry can grow supply at $5.00 an Mcf. That price should support an activity level of 900-1,000 gas rigs, which is certainly an improvement from the lows of 2009,” Adkins concludes. “Although it may appear to outside observers that gas is in the doldrums at $5.00, given the cost structure, companies are going to make good money in 2010.”
For other great articles about exploration, drilling, completions and production, subscribe to The American Oil & Gas Reporter and bookmark www.aogr.com.