


Shifting Market Drivers Keep U.S. Demand Strong For Tubular Products
By Rick Preckel and Paul Vivian
ST. LOUIS–The consumption of oil country tubular goods is highly correlated to oil and natural gas drilling activity, which of course, is directly related to commodity prices. In mid-August, the September contract for West Texas Intermediate was trading above $105 a barrel, and natural gas prices were about $3.45 an MMBtu on the New York Mercantile Exchange.
For the week of Aug. 16, Baker Hughes reported 1,791 active rigs, with a year-to-date average of 1,763 rigs through the first 33 weeks of 2013. “Preston Publishing’s” forecast for full-year 2013 drilling activity is 1,775 rigs. Furthermore, because of improvements in drilling technology, rig efficiency and other factors, OCTG consumption in 2013 will be the third best since 1986, behind only 2012 and 2011.
All these positives should have the OCTG industry feeling euphoric, but the market does have (and always has had) a “what have you done for me lately” mentality. Over the past 12 months, the U.S. rig count has slipped by 123 rigs from 1,914 in the third week of August 2012. The expected decline in activity we wrote about in the September 2012 issue of “The American Oil & Gas Reporter” certainly has come to pass. However, despite the market’s retraction since late last summer, we continue to believe the future is bright from an OCTG consumption perspective.
Challenges abound, to be sure, and are somewhat different depending on where in the market one participates (buyer, manufacturer, distributor or importer). But the United States and the world markets need oil and gas, and OCTG products and services are an integral part of supplying those commodities.
Demand Drivers
Looking at OCTG demand drivers, the biggest factor is always oil and natural gas prices. There have been improvements to oil and gas prices over the course of the past year, with WTI at Cushing, Ok., climbing from $87.90/bbl in July 2012 to $104.67/bbl in July 2013, while Henry Hub natural gas spot prices increased from $2.95 to $3.62 an MMBtu over the same period. However, the structural components of supply and demand for these products have not necessarily been strongly positive.
Not only do oil and gas prices move on supply and demand factors, but of course, they also move on economic news, weather, inventory levels, etc. Natural gas prices are suffering from prolific production from shale wells, associated gas production from oil and liquids wells, and slow economic growth. These issues are going to impact gas prices in the near term, but in the longer term, there are clear positives for natural gas consumption. Among them are increased consumption of natural gas to generate electricity, an attractive U.S. manufacturing environment, future potential liquefied natural gas exports, and an economy that has to grow sometime (doesn’t it?).
On the crude oil front, we expect the developing world to primarily carry the ball, and once again, must rely on economic growth to light the fire. As global economies improve, the developing world will continue to consume more oil. The Organization of Petroleum Exporting Countries seems to be content with today’s oil price level, as well as with its share of the market.
However, there is an additional wrinkle with oil. Oil prices around the world are denominated in U.S. dollars. When the dollar is weak, as is the case now, it takes more dollars to buy. Using those same dollars to pay U.S. wages and buy U.S. goods and services (which is largely what the domestic oil and gas industry does) provides the U.S. oil and gas industry with a more favorable financial picture.
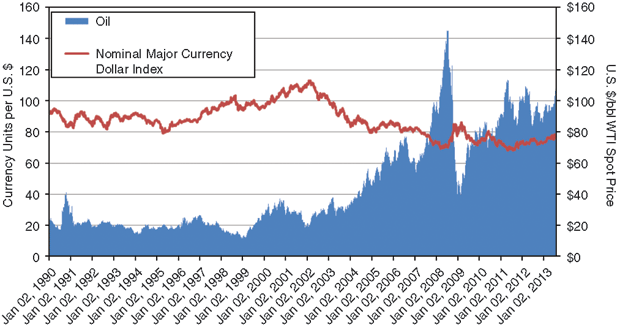
FIGURE 1
Currency Index and U.S. Oil Prices
Sources: U.S. EIA, U.S. Federal Reserve
The chart in Figure 1 attempts to demonstrate this, showing the relationship between U.S. spot oil prices and the strength of the dollar since the beginning of 1990. What this chart cannot show clearly is how much a weakened U.S. dollar contributes to the oil price makeup. Over the rest of this year and most of next, we expect modest growth in natural gas prices and modest declines in oil prices. In time, we expect lower-48 drilling activity ultimately to shift back toward natural gas. We do not anticipate this happening right away, since some of the natural gas demand factors will take time to contribute significantly to consumption.
Historically Strong
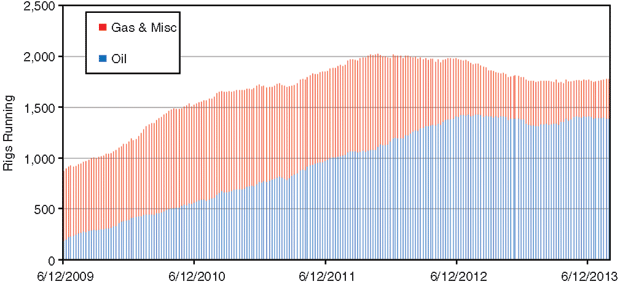
Despite the decline in rig counts since August 2012–with oil drilling edging down from 1,425 to 1,397, and gas drilling dropping from 484 to 388–activity remains historically strong (Figure 2). Knowing where that drilling is occurring is an integral part of understanding the consumption of OCTG products. Obviously, rig activity has shifted dramatically toward horizontal drilling to enable operators to better access hydrocarbons in shale gas and tight oil deposits. Since 2004, horizontal drilling has gone from 10 percent to 62 percent of the total U.S. rig count. This has caused per-well OCTG consumption to double, from about 80 tons a well on average across the United States in 2004 to about 160 tons a well through the first half of 2013.
FIGURE 2
U.S. Oil and Natural Gas Drilling Activity
Source: Baker Hughes
Each active rig is drilling fewer wells over a given period today than in 2004, but more footage (vertical and lateral sections in horizontal wellbores versus vertical only). As a result of the increased total footage per well and the complexity of the wells, rigs are burying twice as much pipe in each well they drill. This shift in tons per well is part of the rig efficiency component of OCTG demand, which comes in two forms: structural industry change and improved technology. The move to horizontal drilling represents a significant structural change to drilling’s influence on OCTG demand.
In regard to technology improvement, as horizontal drilling and completion techniques are refined and further improved, the amount of OCTG consumed per rig in a given period will continue to inch upward. Looking forward to 2014 and beyond, we expect a continued focus on exploring U.S. shale gas and tight oil plays, which should preserve the increase in tons per well. As drilling focuses more on natural gas over the longer term, the percentage of horizontal wells should begin to grow again, resulting in more average tons per well. However, plentiful natural gas supplies and questions about oil fundamentals likely will keep rig count growth in check through 2014, if not longer.
If Preston Publishing’s full-year 2013 rig count forecast comes to fruition, OCTG demand is projected to be the third highest in the past 27 years at 5.8 million tons total. This is an aggregation of strong drilling rates, an increase in tons per well, and continued improvements in drilling and completion technology.
But tonnage alone does not tell the story. Looking back at the years before the explosion in horizontal drilling occurred, heat-treated OCTG accounted for 30-35 percent of U.S. consumption. Today, with the more demanding completion and production environments of horizontal wells, heat-treated OCTG products account for nearly 60 percent of total consumption.
FIGURE 3
U.S. OCTG Consumption
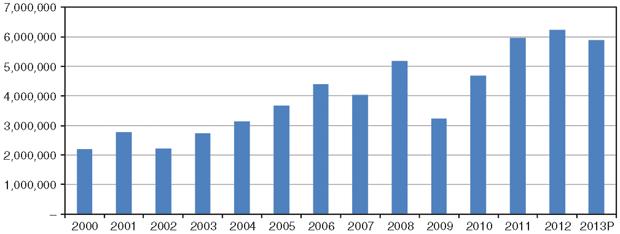
Source: Preston Publishing
Figure 3 demonstrates how OCTG consumption today compares with historical trends. In many ways, the market dodged a bullet coming out of the recession, and has experienced what appears to be a paradigm shift in the level of OCTG demand.
To further explain, throughout the period shown in Figure 3, the U.S. drilling profile has been predominantly natural gas-focused, with the exception of 2011 and beyond. Global oil consumption growth and other factors contributed to increasing oil prices and a shift in the U.S. drilling profile back to oil. This drilling shift had never happened with increased oil prices to any great extent, prior to the recession of 2008-09.
This was, in part, because of the advent of tight oil plays such as the Bakken and Eagle Ford shales. But there are two other reasons for the increased oil activity: Drillers were no longer as busy with gas, and OPEC’s former policy of keeping oil prices low to maintain market share seems to have changed. If these market conditions were still in force today, drilling and consumption would look a lot different.
OCTG Supply
Looking at tubular supply and demand, a phenomenon called inventory overhang occurs at an inflection point in the demand curve when drilling is moving from a growth to a decline pattern. Excess inventory can cause disruptions in the market because the sell-off of these inventories displaces new shipments, and depending on the severity of the activity decline, can occur at discounted prices. Given the reduction in drilling activity over the past year, one might expect to see an inventory issue today. Fortunately, the activity reduction was gradual enough to avoid an inventory sell-off. Industry inventory remains at the high end of historical rates. We typically advise clients to keep their supply chains short in times of uncertainty.
On the import front, the quick rebound in drilling activity after the recession and the lack of Chinese product availability because of the success of the steel industry trade case in early 2010 put import distributors on the hunt for new sources of material. The primary supplier that emerged to fill the void has been Korea. Typically, import sources are a bit slow to restart after a drop in drilling and a successful trade case, but this was not the situation this time.
Imports through the first half of this year have supplied about 47 percent of OCTG to the market. On July 2, several domestic manufacturers brought trade action against Korea and eight other countries accused of using unfair trading practices. The trade action successfully cleared its first hurdle when, on Aug. 16, the U.S. International Trade Commission voted 6-0 that it believed, on a preliminary basis, that the U.S. OCTG industry had been or was likely to be injured by unfairly traded imports from these countries. The investigation continues.
On the domestic front, a significant capacity expansion is well under way. The participants include existing domestic pipe producers, new producers and foreign producers apparently interested in avoiding trade entanglements. When we wrote about this last year, the announced capacity increases amounted to about 50 percent of installed capacity in 2009. Further announcements over the past year will result in a doubling of capacity since 2009, assuming all the announced capacity gets built.
Anytime OCTG capacity increases by that much, it is concerning. With capacity increases comes supply-side market fragmentation that can disrupt the market. In the case of this expansion, however, there are some mitigating factors that must be taken into consideration. First, as mentioned, U.S. drilling activity is structurally different than it was prior to 2005. While there will continue to be cycles, we believe OCTG consumption in the future will average at a significantly higher rate.
Second, horizontal drilling has resulted in expanding consumption of 4 ½-, 5 ½- and 7-inch casing, resulting in an “operating” capacity that is significantly below nameplate capacity.
Third, it is apparent, although not guaranteed, that the intention of foreign producers locating to the United States is to produce here, and not to import pipe into the U.S. market, meaning that this does not really amount to adding new capacity.
FIGURE 4
U.S. OCTG Capacity
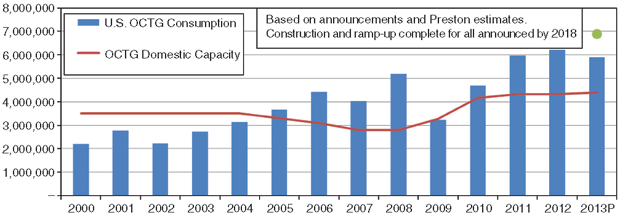
Source: Preston Publishing, news releases
Last, as in all industrial expansions, there likely will be rationalization after a period of competition. Longer term, assuming things happen as expected, the supply side will work itself out. As this new capacity comes on line and ramps up over the course of the next two to four years, there will be some hiccups and some heartaches.
And then there are imports. This much additional U.S. capacity will clearly cause an issue if imported pipe’s total percentage of U.S. OCTG consumption remains in the upper 40s or higher as the new capacity comes on line. Figure 4 compares “operational” capacity with current consumption rates.
OCTG Pricing
OCTG prices have been dropping since early in 2012, mostly because of a lack of a reason for them to increase. The decline could be characterized as more of a “leak” than anything else. Steel price movements have had an effect, as they have in the past. Import levels above 45 percent of total consumption, with a large portion coming from countries that are allegedly dumping, certainly have not helped the pricing situation. A favorable start for the domestic industry to the trade case would improve that aspect of the market. In the longer term, capacity increases coming on line need to be combined with less import penetration to avoid pricing issues.
Any microcosm of time in the OCTG industry is sure to present challenges for end-users, producers, distributors and other market participants. It is a cyclical industry, and that is the nature of the beast. A changing energy structure in the United States brought on by higher oil prices, lower and stable natural gas prices stimulating demand, and concerns about global warming as it applies to coal should all present opportunities for exploration, drilling and production companies and OCTG manufacturers as the industry moves into the future, especially when combined with an increasing global appetite for hydrocarbons.
The nearer term through 2014 should show flat to modest growth in demand for OCTG products as the world struggles to get back on its feet economically. Steeper growth should come in the mid- to longer term, all within the cycles that are inherent to the industry. Heat-treated OCTG demand will continue to improve at a steeper rate than the overall market as drilling technology improvements and more challenging environments continue to be a growing part of the picture.
The supply side is readying to take on the challenge of higher OCTG consumption levels. Will capacity overshoot? Probably; it almost always does in periods of expansion in any industry. But unless the wheels fall off, demand should not disappoint, with cycles excepted, of course.
RICK PRECKEL is a principal at Preston Publishing Company, a steel pipe and tubulars market research and consulting firm that publishes the monthly “Preston Pipe & Tube Report,” analyzing U.S. and Canadian supply. With 27 years of experience in the tubulars industry, Preckel’s background includes all key functions of running a business, including accounting, marketing, supply chain management, information technology, strategy and expansion. His former roles included chief executive officer, vice president of investor relations and business development, vice president of shared services, marketing manager, and controller. Preckel holds a B.S. in business with an emphasis in accounting from the University of Missouri.
PAUL VIVIAN is a principal at Preston Publishing Company in St. Louis. He has 31 years of experience in the pipe and tubing industry, working for both distribution and manufacturing companies. While in the distribution business, Vivian was involved in purchasing, inventory management, supply procurement, sales, and site selection. While in manufacturing, his focus was on business plan development, forecasting, international trade, and sales. Vivian holds a Ph.D. in economics with an emphasis on statistics, and is a graduate of the University of Wisconsin’s graduate school of banking.
For other great articles about exploration, drilling, completions and production, subscribe to The American Oil & Gas Reporter and bookmark www.aogr.com.