


Frac Tech
Simulation Sheds Light On Complex Relationships Between Parent-Child Wells
By Craig Cipolla, Garrett Fowler and Mark McClure
HOUSTON–Hess Corp. applied advanced numerical modeling and simulation to better understand complex relationships between a horizontal parent and two vertical child wells completed in the Middle Bakken formation. The results not only help make sense of diverse parent/child well observations, but also shed new light on effective frac length, the impact of frac hits on parent well production, proppant distribution and “trapping,” and more.
The high-quality dataset used in the simulations includes microseismic depletion delineation (MDD) data in the parent well, three diagnostic fracture injection tests (DFITs) in the two child wells, frac hits and an observed production uplift in the parent (H1). The second vertical child well (V2) was used for microseismic and deformation (downhole tilt) measurements, while the first vertical well (V1) was used for pressure measurements and hydraulic fracture characterization.
The horizontal parent is offset 1,000 feet by the two child wells, which are spaced 200 feet apart. After re-pressurizing and shutting in the H1, microseismic monitoring was used to map drainage. A DFIT was performed in the V1 before MDD to measure local stress and pore pressure. Following MDD, a small propped fracture treatment was pumped in the V1. The parent well then produced for four months and DFITs were pumped in both vertical wells.
Following the V1 frac job, the H1 experienced a significant production uplift. This is particularly notable because of V1’s distance from H1 and the fact that it was fractured with a small (18,000 pounds of ceramic 30/50-mesh proppant) treatment. It is very likely that the uplift was caused by production from rock around the hydraulically fractured V1 given:
- A strong frac hit was seen at H1 while fracturing the V1;
- The second V1 DFIT showed depletion of pore pressure and stress (even though the V1 was never produced); and
- Similar Bakken wells that undergo MDD injection do not see a production uplift, ruling out the alternative possibility that MDD injection caused the H1’s uplift.
Integrated Simulator
The study used a fully integrated hydraulic fracturing/reservoir simulator. The simulation was set up with nearly identical parameters to a previous simulation that had been used to match 10 years of production data in the H1. The new simulation results closely matched the original simulation results, except for a moderate deviation in water production. This discrepancy could have been resolved with minor changes to the relative permeability curves, but the same curves were used to maintain consistency with the earlier modeling work.
Following the H1’s 12-year production period, the simulation modeled the first V1 DFIT, the MDD injection in the H1, the hydraulic fracturing treatment in V1, the V2 DFIT and the second V1 DFIT. The simulation was history matched to a broad set of data, including:
- Production from H1;
- The pressure transient response in the three DFITs;
- The pressure trend in the H1 during MDD injection and during injections in the V1 and V2;
- Fracture geometry inferred from the microseismicity; and
- The observed production uplift in the H1 from the fracturing of V1.
Static model properties (permeability, porosity, saturation, Young’s modulus, Poisson’s ratio and stress) were populated with the same 18-layer property model that had been used in the previous simulation. The integrated simulator uses three nonconforming meshes: matrix, wellbore and fracture. The matrix mesh is rectilinear, with local refinement around the V1 fracture azimuth. Wellbore elements are line segments of equal length. Fractures are meshed using square elements of equal height and length. Fracture element aperture is recalculated constantly in each element as a function of proppant concentration and net stress.
The H1 fractures were created using “pre-existing fractures” in the model, which allows it to exactly replicate the fracture geometry used in the prior modeling with one exception: the fracture at the H1, along strike with the V1, was shortened to weaken the frac hit that occurred during the first V1 DFIT. While it would have been possible to simulate the H1 hydraulic fracture treatment using the simulator, that would have introduced differences between geometries in the previous and new simulation models. Furthermore, the geometry of the H1’s producing fractures is well known from MDD results.
The V1 and V2 were placed along the minimum horizontal stress (Shmin) azimuth, away from the H1. The V2 was offset 14 feet from the V1 in the direction of Shmin so that the V2 fracture did not directly intersect the V1 fracture.
Key Observations
Key observations to match in the simulation were:
- Production rates and bottom-hole pressures (BHPs) during parent well production;
- Pressure response in the H1 during the V1 DFIT, MDD injection and the V1 frac;
- Geometry of the V1 frac (from microseismic);
- H1 production uplift after the V1 frac; and
- Pressure responses during the two V1 DFITs and the V2 DFIT.
The H1 is produced at a controlled oil rate, so actual/simulated rates match perfectly during the 12-year production period. The gas rate is a very close match. Simulated water production is lower than actual (as noted). There were limited available BHP measurements, but simulated BHP was in the expected range.
The distribution of pore pressure and poroelastic stress change at the end of the H1’s production period show depletion concentrated around pre-existing fractures, with minimal depletion ahead of the crack tip. Pressure in the fractures is drawn down to near BHP, but significant regions exist between fractures that are several thousand psi higher than BHP. Depletion is greatest where fracture spacing is lowest (minimum fracture spacing is 50 feet). Poroelastic stress change correlates strongly with depletion. In the most depleted areas, poroelastic stress reduction reaches a maximum of 1,300 psi.
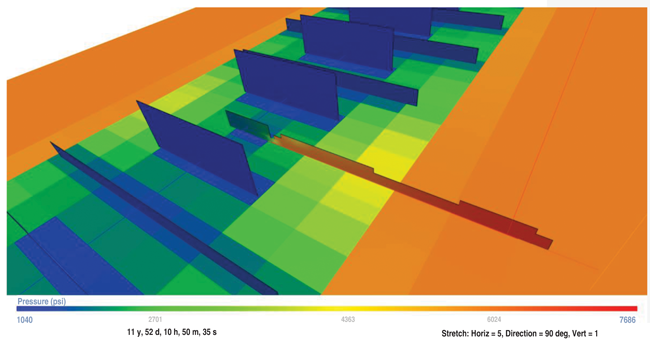
Figure 1 shows the distribution of pressure and fracture conductivity just prior to the V1 DFIT. The conductivity of the “legacy” fractures from the parent well is around 0.5 md-ft. Figure 2 shows pressure distribution in the fractures and formation at the end of the first V1 DFIT. Because of the lower stress near the H1, the fracture has propagated preferentially toward H1. Both simulated and measured H1 pressures show a small (100-200 psi) bump caused by the V1 DFIT, which probably indicates a minor frac hit. In the simulation, the V1 DFIT frac does, in fact, hit the pre-existing H1 fracture.
FIGURE 1
Pressure and Conductivity Distribution
Before First V1 DFIT
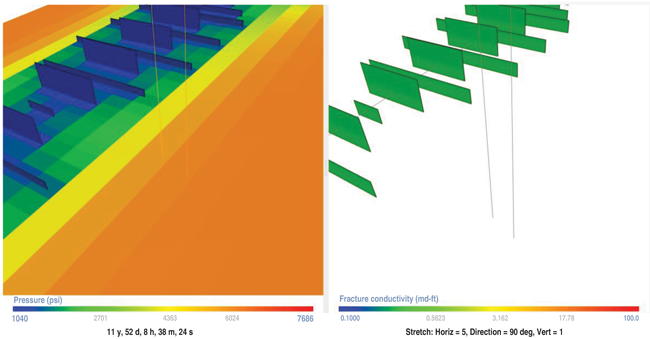
Note: To improve visibility, images have been stretched five times in the direction perpendicular to fractures.
FIGURE 2
Fluid Pressure Distribution at End of First V1 DFIT
Despite this frac hit, measured V1 pressure during the DFIT shut-in declines down to be approximately equal to the undistributed formation fluid pressure. This occurs for two reasons. First, the unpropped fracture conductivity rapidly drops off to a low value after closure, so fluid leak off from the V1 to the H1 is minimal after closure. Second, V1 is outside the region of pressure depletion around the H1.
Matching the loss of hydraulic connection between V1 and H1 after shut-in (despite the frac hit during injection) required selecting fracture properties that would cause unpropped conductivity to be 0.02-0.10 md-ft after closure during the DFIT. Because conductivity is a function of effective normal stress, conductivity was changing continuously over time as DFIT shut-in pressure decreased. The overall match was accomplished with a relatively high value of “aperture at contact” (0.096 inches) and low value of “90% closure stress” (100 psi). The 90% closure stress is the effective stress at which 90% of the aperture is lost.
These parameters suggest the hydraulic fracture is highly conductive during injection, but that conductivity and aperture drop sharply as pressure falls once the fracture walls come into contact.
The simulated and actual BHPs in H1 show a good match during MDD injection and the V1 frac job. During MDD injection in H1, BHP abruptly leveled out at 6,000 psi. This occurred because of mechanically re-opened fractures at pressure approaching the magnitude of the minimum principal stress. The initial magnitude of Shmin in the layer is 7,250 psi, suggesting a stress decrease of ±1,250 psi. This low stress decrease is related to pore pressure diminishing from 6,000 to 1,000-2,000 psi in the depleted region around H1.
The fracture length from the simulated V1 frac job is ±1,000 feet and mostly symmetrical, consistent with observed microseismic data. The instantaneous shut-in pressure (ISIP) from the simulated V1 frac was similar to the observed V1 frac ISIP and first V1 DFIT ISIP.
Production Uplift
Figure 3 shows the actual-versus-simulated H1 production uplift (left panel) and the distribution of fracture conductivity (right panel) after fracturing the V1. Figure 4 shows the distribution of pressure, poroelastic stress change, fracture conductivity and saturation at the end of the H1 production period after the V1 frac and prior to the V2 DFIT.
FIGURE 3
Actual and Simulated H1 Production Uplift (Left) and Fracture Conductivity Distribution (Right)
After the V1 Frac Job
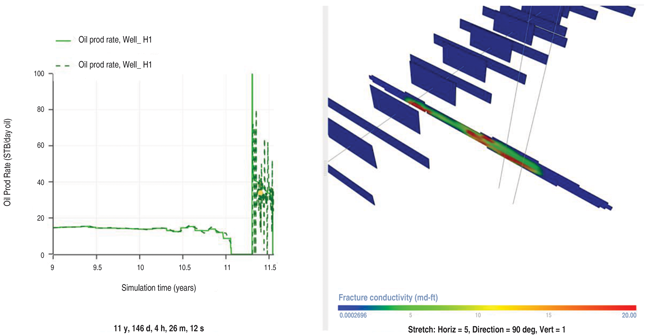
Operational experience shows that similar wells that have been shut in and/or experienced an MDD injection have not demonstrated similar production uplifts. This strongly suggests that the production uplift was caused by fracture connection to the V1. History matching the observed production uplift requires a continuous and fairly conductive pathway for flow from the V1 to the H1. Matching to the first V1 DFIT requires unpropped conductivity to be low. Therefore, the match to the production uplift requires forming a continuously propped pathway along the entire length of the fracture between V1 and H1.
The history match is constrained by some very specific features of the dataset. First, because of the relatively small mass of proppant used in the V1 treatment, the proppant concentration (pounds/square foot) along the fracture cannot be too high or the propped length will be insufficient. Second, the second V1 DFIT had a much more rapid pressure falloff than the first V1 DFIT, suggesting fracture conductivity at the wellbore was enhanced significantly by proppant injection. This implies that some proppant must have been placed at the well and did not entirely settle out into a bed along the bottom of the fracture below the well. This could occur because of the effect of fracture roughness on vertical proppant placement. To account for this effect, the simulator allows a certain amount of proppant to become ‘trapped’ along the fractures and not settle to the bottom because of gravity. The value of maximum proppant trapped per area is a history matching parameter.
This combination of observations requires the history match to set the maximum proppant trapped per area equal to 0.05 lbs/ft2. At a higher value, the propped fracture length would be too short. At a lower (or zero) value, no proppant would be deposited at the V1, and the second V1 DFIT could not be matched.
Fracture Conductivity
To explain the production uplift, this relatively light placement of proppant (~0.05 lbs/ft2) needs to create fracture conductivity of at least 5 md-ft. This may seem like surprisingly high conductivity for such a small amount of proppant, but it can be rationalized by considering a few key points.
First, the proppant is higher-strength 30/50-mesh ceramic. Second, 0.05 lbs/ft2 is the average concentration, but the proppant is probably distributed into patches and more tortuous connections, with localized areas of significantly higher concentrations. Third, the lab-measured conductivity of 30/50-mesh ceramic in a 2.9 lbs/ft2 proppant pack is on the order of 4,000 md-ft. If conductivity scales linearly with concentration, it would imply a conductivity of 100 md-ft at 0.05 lbs/ft2, which is actually 20 times higher than the conductivity values used in the simulation.
The scaling of conductivity with proppant concentration at low concentration is not necessarily linear because of the potential impact of monolayer (increased conductivity), crushing and embedment (decreased conductivity), and patchiness (uncertain effect). Regardless, the history match indicates that the field observations only can be explained if a pathway of approximately 5 md-ft was formed along the fracture between the V1 and H1. This conductivity was created by proppant injection from the V1 frac. The initial V1 DFIT caused a minor frac hit on H1, but did not create an apparent hydraulic connection between the wells.
There is noticeable pressure depletion around the V1 frac as it drains into the H1 (Figure 4), even at distances greater than 1,000 feet. However, the fracture does not behave like an infinite-conductivity feature. There is a roughly 2,500-psi pressure gradient driving flow across the 1,000 feet from the V1 to H1.
FIGURE 4
Pressure, Poroelastic Stress Change, Conductivity and Saturation Distribution Before V2 DFIT
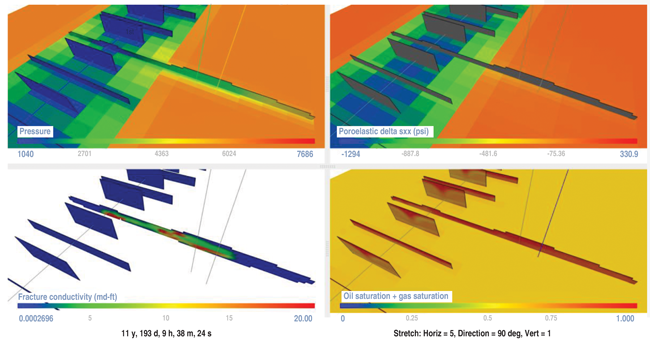
By the time of the V2 DFIT (after almost three months of production from the H1), fracture pressure in the vicinity of the V1 was roughly 2,500 psi lower than the undisturbed formation fluid pressure. The corresponding poroelastic pressure decrease is about 250 psi at the fracture face. If the region of pressure depletion was uniform across the entire formation, the uniaxial stress equation would predict a significantly larger poroelastic stress change. The lower-than-predicted poroelastic response is because of pressure depletion extending only a few feet from the fracture face.
Consequently, because of low formation permeability, pressure in the formation was depleted only within a few feet of the well after three months of production. In a long, narrow region of pressure depletion, the poroelastic response was weaker, asymptotically approaching zero as the width of the region of pressure depletion declined.
The V2 DFIT and the second V1 DFIT were performed after this second period of H1 depletion. The two DFITs are qualitatively different. The second V1 DFIT shows much more rapid pressure depletion than in either the first V1 DFIT or the V2 DFIT, quickly reaching subhydrostatic pressure of ~4,000 psi BHP (the test ended when the wellhead went on vacuum). Even with much longer shut-ins, neither of the other two DFITs approached subhydrostatic pressure.
The V2 DFIT’s ISIP is slightly lower than the ISIP from the first V1 DFIT, with pressure falling 500 psi lower by the end of the test (and with a greater slope at the end). These observations were matched by assuming that the V2 DFIT frac is close to the V1 frac, but not directly connected. If there was a direct connection, the V2 frac would drain into the V1 frac and behave more similarly to the second V1 DFIT. In the match, the V2 DFIT frac is in proximity (offset 14 feet) to the V1 frac so that it is impacted by pressure depletion and stress change, but does not directly contact it.
Study Results
The modeling exercise in this study shows that planar fracture modeling successfully explains all available observations. It has been proposed that capillary pressure effects cause the effectively producing fracture length to be one or two orders of magnitude less than the full-frac length and/or propped frac length. However, in this dataset, it is clear that the effectively draining fracture length equals the entire 1,000 feet separation between the V1 and H1. This finding has implications for well spacing.
If effectively draining fracture lengths are shorter, then shorter well spacing is optimal. If effective fracture lengths are longer, then the optimal well spacing is wider. This Bakken study echoes findings from an earlier study performed in the Utica Shale, which showed how inaccuracy in DFIT permeability interpretation could lead to overestimated permeability, underestimated fracture length and a subsequent loss of economic value associated with excessively close well spacing. In both cases, the data suggests that effectively draining fracture half-lengths are on the order of 500-1,000 feet.
Mechanisms of frac hit impacts on parent wells while stimulating child wells are not thoroughly understood. Obviously, parent/child interactions have the potential to impact production through pressure interference. Nevertheless, the severity of frac hit damage in some formations suggests additional damage mechanisms may be at play, such as the formation of chemical precipitation/emulsions or water leak off that reduces relative hydrocarbon permeability around fractures. In the Bakken dataset, however, the observed production uplift from the frac hit suggests that no other chemical or special damage processes were at play. This is consistent with other study results indicating Bakken parent wells are more likely to see production uplifts than production losses after frac hits.
The value of the history matching parameter maximum proppant trapped per area was rather low, but importantly, it was nonzero. Very likely, the amount of proppant trapping relates to natural fracture density and other formation properties, and so proppant trapping should vary by formation. It is an important parameter because the propped length decreases as proppant trapping increases.
Propped length is very difficult to measure directly, but it can be inferred from production interference tests and other field observations, as shown in this study. Once propped length is known, the amount of propping trapping in the model can be calibrated to match the measured propped length.
Editor’s Note: For more information on the Bakken study, see SPE 201566, a technical paper originally prepared for presentation at the Society of Petroleum Engineers 2020 Annual Technical Conference & Exhibition. The preceding article was adapted from the paper.
CRAIG CIPOLLA is a principal completions engineering adviser at Hess Corp. He joined Hess in 2012 after serving as chief engineering adviser for hydraulic fracture monitoring and optimization at Schlumberger, vice president of stimulation technology at CARBO Ceramics and vice president of engineering at Pinnacle Technologies. He is a former Society of Petroleum Engineers distinguished lecturer on hydraulic fracturing. Cipolla holds a B.S. in engineering and a B.A. in chemistry from the University of Nevada-Las Vegas, and an M.S. in petroleum engineering from the University of Houston.
GARRETT FOWLER is chief operating officer of ResFrac Corp. in Palo Alto, Ca. Prior to joining ResFrac as vice president of operations, Fowler was principal reservoir engineer at Tachyus Corp., where he worked with national oil companies, supermajors and independents on deploying data science solutions. Before that, he was a reservoir engineer for Occidental Petroleum specializing in waterflood surveillance, piloting and optimization. Fowler holds a B.S. in energy resources engineering and an M.S. in petroleum engineering from Stanford University.
MARK MCCLURE is co-founder and chief executive officer of ResFrac. Before founding ResFrac in 2015, McClure was an assistant professor at the University of Texas at Austin in the department of petroleum and geosystems engineering. He serves on a number of scientific and academic boards and committees, and as an adjunct professor at Stanford University. McClure holds a B.S. in chemical engineering, an M.S. in petroleum engineering and a Ph.D. in energy resources engineering from Stanford University.
For other great articles about exploration, drilling, completions and production, subscribe to The American Oil & Gas Reporter and bookmark www.aogr.com.