


Permanent Seismic Monitoring
Time-Lapse Monitoring Optimizes Fracturing, Reservoir Development
By Oscar Quezada and Thomas L. Davis
DENVER–The industry has improved productivities dramatically in tight oil formations, but overall recovery factors generally remain low in spite of ongoing optimizations to horizontal well architectures and multistage hydraulic fracturing treatment designs.
In the Wattenberg Field in the Denver-Julesburg Basin, for example, where the Niobrara and Codell reservoir intervals contain an estimated 2 billion barrels of recoverable oil equivalent, the combined recovery factor from the Niobrara and Codell averages only 6 percent. While continual improvements in engineering and operating practices have lowered costs and increased productivities across the play, they have not moved the estimated ultimate recovery needle in a meaningful way.
The future of reservoir development in the Niobrara/Codell and other liquids-rich resource plays depends on the ability to use integrated seismic monitoring technologies to improve recovery factors and recovery efficiencies in unconventional reservoirs. Given the size of the reserves in place in the Niobrara/Codell, improving recovery by only 1 percent would impact the play’s economics significantly, justifying the cost of seismic monitoring during the life of a field development. However, using permanent time-lapse seismic monitoring promises an order-of-magnitude change in recovery factors, potentially doubling or even tripling the average recovery factor.
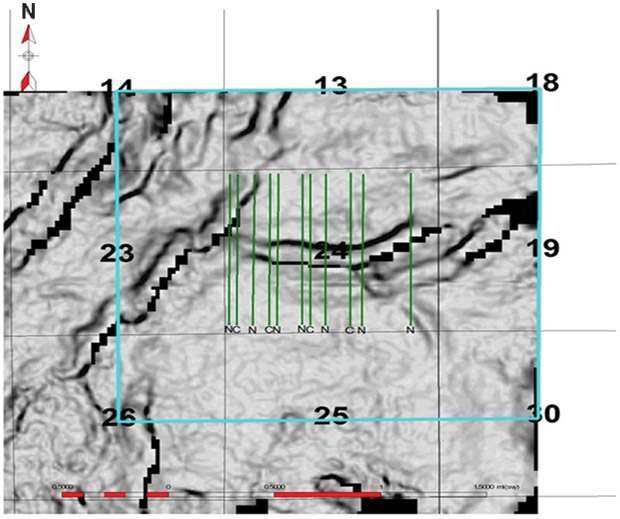
FIGURE 1A
Seven Niobrara and Four Codell Horizontal Wells in Wishbone Section (Dark Lines are Faults)
Seismic monitoring has the potential to play a critical role in managing unconventional reservoir development and improving the economic return on investment. Integrating 4-D multicomponent seismic, vertical seismic profiling and microseismic surveys provides a unique opportunity to monitor permeability and stress field conditions over time as wells are drilled, completed and produced.
By characterizing the reservoir under dynamic instead of static conditions, the permeability field created by hydraulic fracturing can be monitored over time. Natural fractures, faults and stress states profoundly influence the permeability field created by hydraulic fracturing. The permeability field is a continuum, and it constantly changes as a reservoir is developed. Monitoring changes in the permeability field can reveal the region where permeability is enhanced because of stimulation and how it changes in time, while enabling a better understanding of the effectiveness of hydraulic fracturing in accessing the hydrocarbons present in the low-permeability rock matrix.
Anadarko Petroleum Corp. and the Colorado School of Mines Reservoir Characterization Project teamed to conduct an integrated dynamic reservoir characterization study of a portion of the Wattenberg Field. Time-lapse multicomponent data were acquired during the hydraulic fracture stimulation of 11 horizontal wells as part of a well spacing test within a one square-mile section called “Wishbone,” as shown in Figure 1A (the dark lines are faults at the top of the Niobrara).
FIGURE 1B
Location of the Wishbone Horizontal Wells
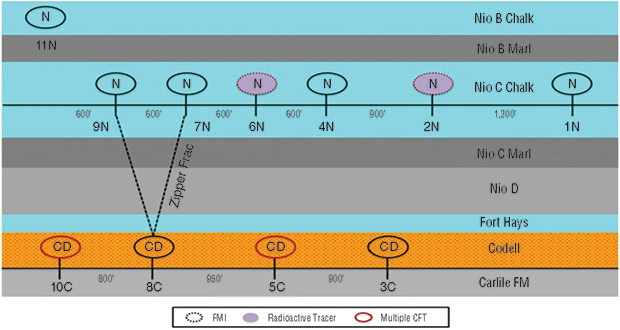
The integrated study sought to determine which parts of the reservoir were being accessed by hydraulic fracturing operations and which parts of the permeability continuum were being monitored by the various seismic methods. The integration of seismic and engineering technologies helps optimize well spacing and other parameters, including completion type and number of stages (Figure 1B). It is worth noting that the cost of conducting seismic monitoring operations on the one square-mile Wishbone site is less than half the cost of drilling and completing a single well in the section.
4-D Multicomponent Monitoring
Seven of the 11 Wishbone horizontals were landed in the Niobrara and four were landed in the Codell. The base line multicomponent seismic survey was acquired prior to drilling. During hydraulic fracturing, a surface microseismic survey was acquired. A monitor multicomponent survey then was acquired after the wells were stimulated, but before they were flowed back. The well trajectories were designed to facilitate hydraulic fracturing more than maintaining contact with the primary zone of interest. Most wells were drilled toe-up to facilitate gravity drainage. Formation image logs show open natural fractures as well as a considerable number of fractures with calcite fill.
Overpressures in the Niobrara/Codell interval extend several hundred feet above the reservoir into the basal part of the Pierre Shale, causing stress relief in the overburden, which is a critical factor in making the Niobrara a world-class reservoir. Evidence of pressure compartmentalization occurs in the reservoir set up by faulting associated with wrench fault tectonics.
Paragon Geophysical Services acquired both the post-drilling/pre-completion base line and the post-fracturing/pre-flowback monitor surveys. The first survey was conducted during relatively dry conditions in early summer, but there was considerable noise present related to operational efforts going on in the field at that time. The second survey was completed a couple months later, shortly before storm clouds darkened the skies as a prelude to a “100-year flood.” Paragon Geophysical used INOVA Geophysical’s wireless Hawk™ system to acquire the multicomponent data.
The nine-component (9-C) surveys had three components of vibrator source (one P-wave and two othogonal S-waves) at each source point, and three-component VectorSeis™ digital receivers at each receiver point. Approximately four square miles of surface seismic coverage was used to image the one square-mile section with full fold coverage in the subsurface at a depth of 7,500 feet. The surveys were acquired to provide at least 60 fold at the Niobrara level in the subsurface imaging area. The surveys also provided rich azimuthal and offset coverage to enable prestack analysis and interpretation.
Sensor Geophysical processed the P, PS and SS data. Data quality was good to excellent. Processing was undertaken to preserve survey repeatability. The time-lapse seismic data were processed simultaneously. Cross-equalization was performed on the datasets with normalized root mean square (NRMS) attribute differencing ranging down to 0.2 in the target interval for the P-wave data and 0.3 for the S-wave data.
Time-Lapse Results
Figure 2 shows a P-wave time-lapse anomaly within the reservoir interval associated with hydraulic fracturing. The majority of the P-impedance change is within the Niobrara “C” chalk and Codell intervals. The change is caused by hydraulic fracturing and is related to the pressure field being increased while lowering the acoustic impedance. The amount of pore pressure increase associated with hydraulic fracturing was as great as 3,300 psi.
FIGURE 2
Time-Lapse P-Impedance Change
Associated with Hydraulic Fracturing
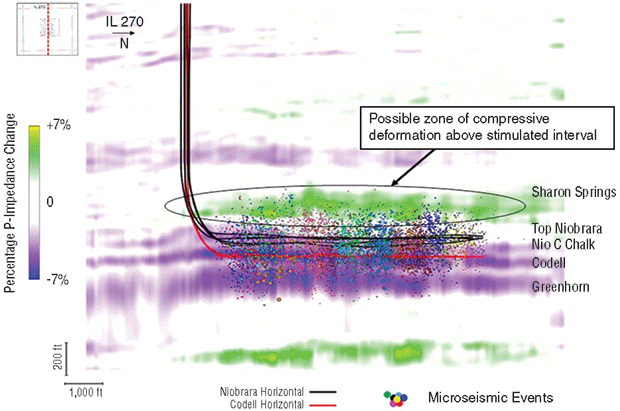
Overburden compaction in the Sharon Springs member of the Pierre Shale relates to top seal effectiveness. The rocks within the reservoir interval are stress-sensitive and naturally overpressured by the hydrocarbon maturation process. Pressurizing the middle Niobrara and Codell increases the effective stress in the overlying and underlying intervals, giving rise to “stress arching” associated with hydraulic fracturing. Fracture containment within the target zone is evidenced by the P-wave time-lapse analysis and associated microseismic data.
In map view, the change in P-impedance for the Niobrara C chalk is concentrated on the western side of the Wishbone section between two faults. The pressure field is influenced by the zone of increased permeability related to the opening of natural fractures associated with wrench and listric normal faulting on the western side of the section. The faults on the west side cause pressure compartmentalization and sealing conditions to occur because of their strike-slip or wrench fault movement, creating fault damage zones and clay smear along the faults.
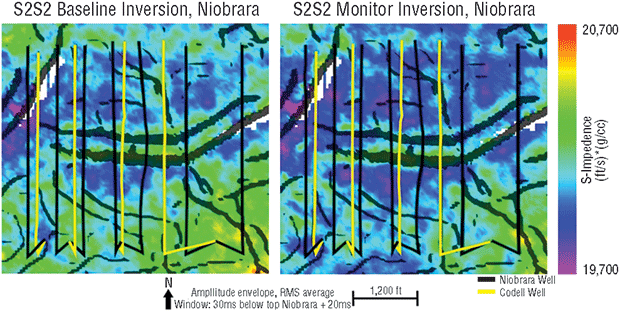
FIGURE 3A
S2-Impedance at the Niobrara C
(Pre- and Post-Fracturing)
P-wave velocities are influenced by compressibility, rigidity and density, while S-waves are influenced by rigidity and density. Compressibility in the Niobrara is affected by fractures and fluid in those fractures. S-waves are influenced by the presence of open fractures, and shear azimuthal anisotropy is a measure of fracture density and fracture aperture. The physical process of hydraulic fracturing is intended to “break more rock” and S-wave data identify the rock breakage zones. The fracturing associated with the stimulation process deceases S-wave velocity.
The areal extent of the S-wave anomalies is less than those for P-wave data because shear waves show the fractured reservoir volume, and not the pressure field sensed by P-wave data. There is considerable value in multicomponent time-lapse data in monitoring shale reservoirs versus P-wave monitoring alone.
The P-impedance change in the C chalk is pervasive on the western side caused by the pressure buildup associated with hydraulic fracturing and compartmentalization of the reservoir by faulting. Fracture zones that are effectively providing conductivity to the wells are shown by the change in S-wave azimuthal anisotropy. The reservoir volume providing the effective reservoir conductivity as evidenced by the S-wave data is reduced compared with that shown by the P-wave data.
FIGURE 3B
S1-Impedance at the Niobrara C
(Pre- and Post-Fracturing)
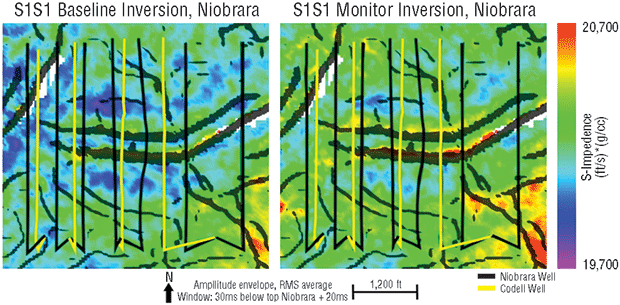
Time-lapse multicomponent seismic fast (S1) and slow (S2) shear-wave volumes have been created with a north-20 degrees-west predominant fracture orientation. Through prestack inversion, impedance volumes were created for the S1 and S2 volumes before and after the 11 wells were hydraulically fractured. Figures 3A and 3B show S2 and S1 impedance, respectively, at the Niobrara C level both before and after hydraulic fracturing.
Figure 4 shows the results of computing azimuthal S-wave impedance anisotropy from the S-wave impedance volumes for the Niobrara C and Codell intervals. The difference between S1 and S2 (“pseudo seismic splitting”) is a measure of S-wave azimuthal velocity anisotropy. The ability to differentiate the response of these two reservoir intervals separated by 100 feet at a depth of 7,000-7,500 feet is truly remarkable, and is of considerable value for improving recovery from the Niobrara and Codell.
FIGURE 4
S-Wave Impedance Anisotopy Difference
For Niobrara C and Codell
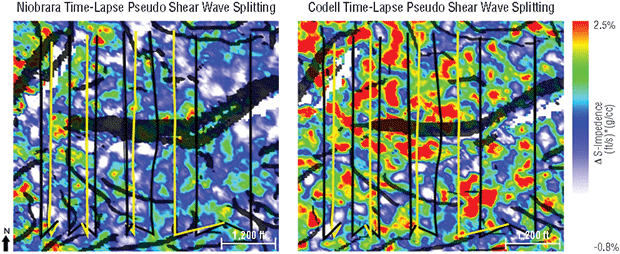
The time-lapse S-wave azimuthal anisotropy volume indicates that approximately 40 percent of the Niobrara C chalk and 60 percent of the Codell exhibit hydraulic communication to the wellbores. The shear data provide a robust means of imaging the reservoir volume that is being stimulated effectively. The P-wave data are more sensitive to effective stress and the microseismic data show fracture tip growth, but do not link to the effective stimulated volume since the opening of natural fractures may or may not create seismicity.
Multicomponent seismic monitoring shows that P waves identify pressure compartments, whereas S waves respond to dense fracturing and fracture aperture. Both are important to monitor dynamically. S-wave data show that 60 percent of the Niobrara reservoir is not being contacted effectively by the hydraulic fracturing process. Used in conjunction with microseismic event locations and attributes, this robust dataset covers the full extent of changes in the stimulated reservoir from distant to near-wellbore.
Microseismic Monitoring
Microseismic Inc. acquired the microseismic data from a surface array. The event density was mapped for each of the hydraulically fractured wells. Overall, the outline tends to suggest a fairly uniform stimulated reservoir volume throughout the section, in stark contrast to what the S-wave data show. In general, we believe the P-wave data show the overpressure area largely bounded by faults on the west side of the section, while the S-wave data show the zones of high fracture density that are open/propped. There is a greater volume of effective stimulated reservoir in the Codell than in the Niobrara C interval.
FIGURE 5
Microseismic Clusters Conforming
To S-Wave Time-Lapse Anomalies
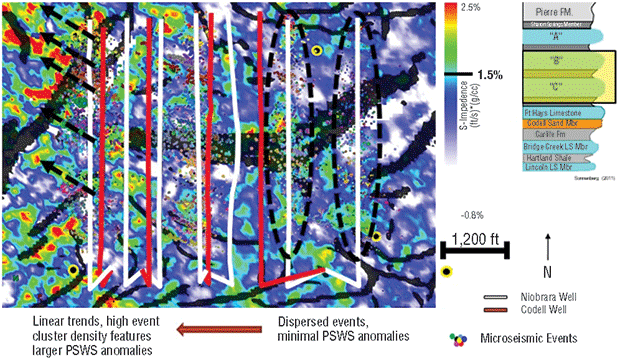
The variability of seismicity associated with the hydraulic fracturing process ranges from long linear trends to the clustering of events. There may be initial communication between hydraulic fracture length and the wells as evidenced, but in the Wishbone wells, the effective fracture length is much shorter than the microseismic data imply. Moreover, the better wells are not associated with instances in which the microseismic events exhibit long, linear trends. Instead, the better wells are associated with microseismic event clusters that conform to the shear-wave time-lapse anomalies, indicating complex fracturing (Figure 5).
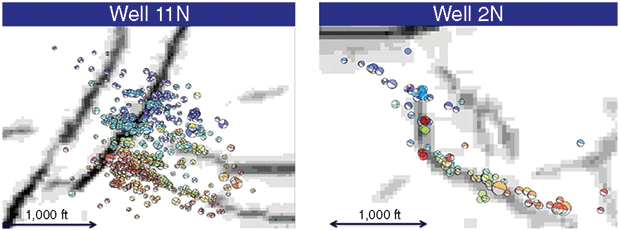
Faults are a major control on hydraulic fracturing effectiveness. Depending on fault orientation relative to maximum horizontal stress orientation, faults can be conduits or barriers to seismicity induced by hydraulic fracturing. The No. 2N well is one of the better producers in the section. The microseismic data show a strong influence in the presence of faults (Figure 6).
FIGURE 6
Microseismic Well Data in Areas with Faults
After two years on production, the 11 wells demonstrated as much as a 15 percent differential in relative production, which is expected to grow with time. Fundamentally, the difference relates to reservoir heterogeneity. There is the presence of increased spatial density of natural fractures in the western area near and between the major faults. Pressure compartmentalization associated with the faults also plays a role with higher pressures within the western fault block. Finally, the hydraulic fracturing treatment process was effective in creating larger volumes of stimulated reservoir in the western area, as exhibited by the monitor survey.
Based on the study, additional wells are warranted to access reserves from the Niobrara and Codell in the Wishbone section. Consequently, Anadarko has begun drilling six wells in the Codell and eight in the B and C chalk intervals in each section. It also is also studying the potential for refracturing existing wells.
The Road Ahead
Permanent seismic monitoring can aid operators’ quest to better develop tight reservoirs. Monitoring enhances hydraulic fracturing effectiveness to increase recovery and mitigate potential reservoir damage. The industry must move from static to dynamic reservoir characterization to fully understand the hydraulic fracturing process in a variety of reservoirs and settings using permanent reservoir monitoring systems that enable active and passive recording of the seismic wave field.
If refracturing can access more reservoir rock throughout a well’s life, additional reserves can be recovered and maximize the use of these valuable resources. Refracturing a well typically costs only 20-30 percent of the cost of drilling and completing a new well, but one of the largest hurdles to refrac treatments is understanding proper wellbore placement. For refracturing to be most successful in shale reservoirs, the new fractures need to access areas of the reservoir that the initial fracturing treatments did not adequately contact.
Permanent seismic monitoring will help to not only target areas for refrac treatments, but also help convey how the rock reacted to (and possibly changed as a result of) the initial frac treatment. This information will help to optimize treatments and determine how to design and apply refracs.
For oil and gas operators in the D-J Basin, a deeper understanding of hydraulic fracturing in these different formations will allow for the optimization of two of the most important technical factors in horizontal development: completions and well spacing. Monitoring the influence of rock mass and overburden changes also will be pertinent to addressing environmental and societal concerns with hydraulic fracturing.
OSCAR QUEZADA is a senior staff geophysicist at Anadarko Petroleum Corp. in Denver. With 17 years of experience in reservoir characterization and project management in both on- and offshore plays, he has expertise in integrated analysis of geophysical, engineering and geologic data. Quezada’s most recent experience includes reservoir characterization in areas of hydraulic stimulation by integration of seismic attributes, microseismic and engineering data. He holds a degree in geophysics from the University of Texas at El Paso.
THOMAS L. DAVIS is professor emeritus at the Colorado School of Mines and serves in an advisory capacity to CSM’s Reservoir Characterization Project, which he founded and led for more than three decades. Davis began his teaching career at CSM in 1974 as a professor of geophysics and retired in May 2016. He is the recipient of numerous professional awards and honors, and was a distinguished lecturer for the Society of Exploration Geophysicists. Davis holds a B.S. in engineering from the University of Saskatchewan, an M.S. in physics from the University of Calgary, and a Ph.D. in geophysical engineering from Colorado School of Mines.
For other great articles about exploration, drilling, completions and production, subscribe to The American Oil & Gas Reporter and bookmark www.aogr.com.