


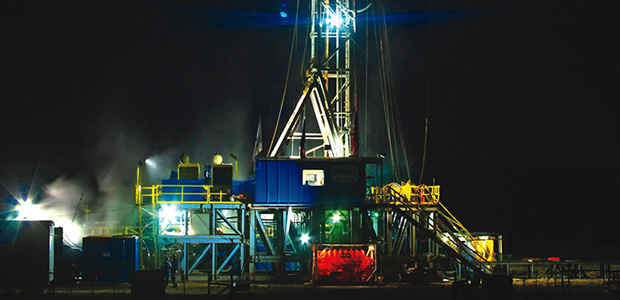
U.S. Independents Paint Optimistic Picture With 2012 Drilling Plans
By Bill Campbell
While a sample group of The American Oil & Gas Reporter’s U.S.-based independent oil and gas producer readers were responding to the magazine’s annual Survey of Independent Operators, two leading sources of activity levels were flashing warning signals.
The gold standard Baker Hughes rig count stood still during November and December, with no measureable gains after a steady upward trot throughout the year. Decreasing natural gas rig counts offset rising oil counts through year’s end. Meanwhile, IHS showed year-to-year declines in U.S. drilling permits of 5 and 10 percent for October and November, respectively. So is the party over?
Hardly.
For the third straight year, respondents to AOGR’s survey project a sizeable increase in drilling for the coming year. Following a 13.8 percent increase in well completions during 2010 and a 21.3 percent year-to-year increase in 2011 as of October, according to counts from the U.S. Energy Information Administration, respondents to the Survey of Independent Operators say they plan to increase drilling in 2012 by another 37.6 percent.
The American Oil & Gas Reporter mails its Survey of Independent Operators annually in November to oil and gas producers nationwide, selected at random from the magazine’s circulation list. No attempt is made to identify survey respondents, and AOGR staff compile and analyze the data. The Survey of Independent Operators does not account for dry holes, but merely asks operators what the intended target is when a well is spudded.
For purposes of comparison, survey respondents are grouped by “size” and drilling preference categories. Respondents who indicate they will drill 0-4 wells in 2012 are categorized as “small” drillers; those planning to drill 5-14 wells this year are “medium” drillers, and those who expect to drill 15 or more wells are “large” drillers. Respondents who say they targeted natural gas, including unconventional wet gas wells, on at least half their 2011 spuds are categorized as “gas” drillers, while those who targeted crude oil on more than half their 2011 wells are categorized as “oil” drillers.
Rig Count Dilemma
Is AOGR’s Survey of Independent Operators at odds with other leading indicators that show activity leveling? As is true of any data analysis, the analysis is only as good as the data, and as the saying goes, the devil is in the details. The American Oil & Gas Reporter’s survey may indicate a groundswell of conventional oil drilling activity flying under the radar that could bring more good news to a domestic industry experiencing a renaissance equal to any in its history.
Upper tier independent operators and many of their smaller peers continue to shift capital to unconventional tight oil and natural gas plays in states such as North Dakota, Texas, Oklahoma, Pennsylvania and Ohio. However, strong demand for goods and services is impacting total well costs in some areas. In fourth quarter 2011, a few large unconventional resource play operators went on record that increased field costs and limited manpower and equipment needed to drill and complete multimillion dollar, ultralong laterals in unconventional liquids plays were causing them to adjust their drilling plans. Meanwhile, natural gas prices hit their lowest levels since September 2009.
At the same time, healthy crude oil prices offer positive economic incentive to independents that drill conventional wells in states such as California, Colorado, Kansas, Illinois, Indiana and Kentucky, where high-horsepower rigs and well fracturing services aren’t stretched to the limit.
A case in point is Kansas. During the last week of December, Wichita-based Independent Oil & Gas Service Inc. (IOGsi), which includes smaller rigs and shallower drilling depths in its count than do some of the national services, counted 101 active rigs. IOGsi’s statistics show the Sunflower State rig count has exceeded 100 rigs since July. The 101 rigs in December 2011 compares with 69 in December 2010 and 71 in December 2009.
A similar example can be found in the Illinois Basin. Tri-State rig counts have remained relatively consistent over the past several years, including the 2009 aftermath of the financial crisis. According to rig count data from Evansville, In.-based Scout Check Report, active rigs in the basin hit a low of nine the week of March 10, 2010, when oil prices were $71.50. But they bounced back, Scout Check indicates, to a 2011 high of 28 rigs on Aug. 11, and the data service found 22 rigs making hole on its final, Dec. 22, count.
Bigger Is Better
Like the high initial production rates from unconventional resource plays, bigger does appear to be better in terms of the expectations of respondents to the Survey of Independent Operators for the coming year. The medium and large categories of drillers project 43.3 and 42.3 percent increases in drilling (Figure 1), respectively, compared with a 1.2 percent decline predicted by the small category.
FIGURE 1
Change in Operators’ Planned 2012 Drilling
Compared with 2011 Actual Drilling
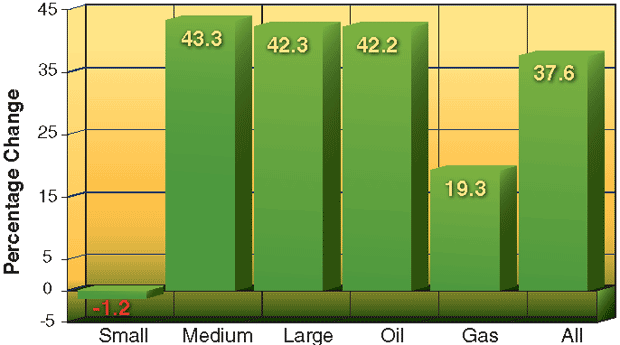
Operators designated as small are those who plan to drill 0-4 wells in 2012. Operators designated as medium plan to drill 5-14 wells this year, while those designated as large plan to drill 15 or more wells. Operators designated as oil targeted oil on more than half their 2011 wells, while those designated as gas targeted natural gas on at least half of their 2011 wells.
Approximately three-fourths (72.7 percent of medium category drillers and 78.9 percent of large drillers) say they will drill more wells this year than last year, compared with only 50.0 percent of small drillers (Figure 2). Only 4.5 percent of medium category drillers and 5.3 percent of large drillers say they will drill fewer wells this year than last, while 23.7 percent of small drillers say they expect their drilling levels to decline.
The disparity narrows somewhat when it comes to drilling budgets. As shown in Figure 3, 59.1 percent of medium category drillers and 63.2 percent of large drillers indicate their 2012 drilling budgets–assuming projected programs are fully subscribed–will be larger than 2011, while 51.4 percent of small drillers say they plan to spend more money drilling this year than last. Saying they will spend the same amount this year as last are 37.8 percent of the small category of survey respondents, 31.8 percent of medium drillers, and 31.6 percent of large drillers.
Oil Versus Gas
Not surprisingly, survey respondents who drill predominately oil wells are considerably more upbeat about 2012 than are those who drill more natural gas wells. Oil well drillers project a 42.2 percent increase in total 2012 drilling plans, compared with a 19.3 percent increase for gas well drillers (Figure 1).
FIGURE 2
Operators’ 2012 Drilling Plans
Compared with 2011
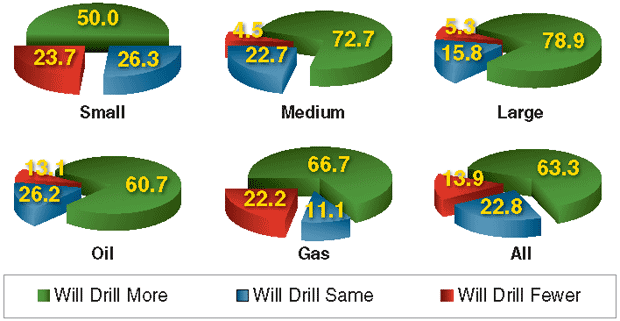
Interestingly, 66.7 percent of gas well drillers say they expect to drill more wells this year, compared with only 60.7 percent of the oil driller category (Figure 2). Another 26.2 percent of oil well drillers say they will drill the same number of wells in 2012 as they drilled in 2011, while only 13.1 percent say they will drill fewer wells, compared with 11.1 percent of gas well drillers who say they will drill the same number and 22.2 percent who say they will drill fewer.
Some of the apparent anomaly in drilling plans may be explained by the type of planned drilling. Half of the gas well drillers report at least some of their 2012 wells will be drilled horizontally, compared with only 21 percent of oil well drillers who expect to drill horizontal wells. Among survey respondents who indicate some horizontal drilling in 2011 or 2012, 58.3 percent say they will drill more wells this year, while only 12.5 percent will drill fewer.
Crude oil focused survey respondents regain their edge in spending plans, where 56.7 percent of the oil category say their 2012 drilling budgets will exceed their 2011 budgets (Figure 3), and another 35.0 percent say their drilling budgets will remain the same, compared with 50.0 and 33.3 percent, respectively, for gas well drillers.
FIGURE 3
Operators’ 2012 Spending Plans
Compared with 2011
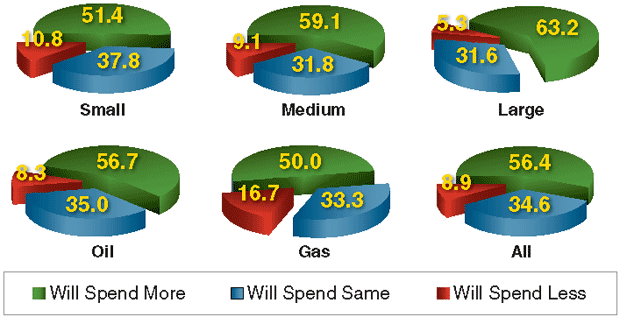
Altogether, 63.3 percent of survey respondents say they will drill more wells this year than last, while 22.8 percent say they will drill the same number of wells. More than half (56.4 percent) of all survey respondents indicate they will spend more this year drilling wells than last, while 34.6 percent say they will spend the same.
Getting ‘Oily’
There is no doubt 2012 will be an “oily” year. Survey respondents report 71.3 percent of their 2012 wells will target conventional oil formations while another 12.4 percent will seek unconventional oil targets. Conventional natural gas targets get the nod on 9.4 percent of survey respondents’ planned 2012 wells, while unconventional dry gas formations will be targeted on only 1.2 percent of 2012 wells, and unconventional wet gas will be the prize in 5.6 percent of wells.
Generally speaking, the 2012 Survey of Independent Operators indicates a strong preference for drilling conventional oil formations. Among all respondents, conventional oil wells comprised 66.9 percent of 2011 drilling and rise to 71.3 percent in 2012. “Small driller” respondents go from 67.1 percent conventional oil in 2011 to 76.9 percent in 2012; the medium category of drillers goes from 70.0 to 72.1 percent conventional oil wells; large drillers move from 66.0 percent convention oil in 2011 to 70.4 percent in 2012; while the oil driller category reports 77.8 percent conventional oil wells in 2011 and 81.0 percent in 2012. Gas well drillers are the only respondent category that does not project a sizeable increase in conventional oil drilling, and even here, the percentage remains essentially flat at 17.5 in 2011 and 17.6 in 2012.
This preference for conventional oil drilling comes at the expense of all gas-directed drilling. Conventional and both unconventional wet and dry gas wells accounted for 19.0 percent of survey respondents’ 2011 drilling and are projected for only 16.2 percent of 2012 wells.
The slide in gas-directed drilling carries across all survey categories. Small drillers’ proportion of total gas wells slips from 30.4 in 2011 to 17.9 in 2012. For the medium driller category, natural gas directed drilling slips from 27.5 percent in 2011 to 23.9 percent in 2012. Gas drilling drops from 14.4 percent in 2011 for the large driller category to 14.1 percent in 2012, and slips from 7.7 percent last year for the oil category to 7.2 percent this year.
Even respondents who are focused primarily on natural gas say their proportion of total gas drilling will drop from 70.2 percent last year to 66.9 percent this year. Gas-focused respondents say 40.4 percent of their 2011 wells targeted conventional gas formations, 2.6 percent were unconventional dry gas wells and 27.2 percent targeted unconventional wet gas. Those numbers go to 25.7 percent conventional gas, 4.4 percent unconventional dry gas and 36.8 percent unconventional wet gas this year.
The average respondent to the Survey of Independent Operators drilled 8.2 wells in 2011 and expects to drill 11.3 wells in 2012. Survey respondents report horizontal wells will comprise 19.6 percent of their total drilling this year, while 19.2 percent of their wells will target unconventional gas or oil formations. Survey respondents wildcatted on 23.3 percent of their 2011 wells, but say they expect wildcats to represent 16.3 percent of 2012 wells.
The average vertical well for survey respondents was drilled to 4,569 feet in 2011, and they project an average vertical well depth of 4,376 feet in 2012. Total measured depth of horizontal wells averaged 10,029 feet last year and is projected at 9,570 this year, while average lateral length of horizontal wells was 4,376 feet last year, going to 4,214 feet this year.
Price Projections
Percentages in Figure 4A represent the cumulative total of survey respondents who indicate they would have altered their 2012 natural gas drilling plans by the time wellhead prices reached the indicated amount. Prices at which drilling would decrease are plotted to the left of the graph in a downward curve; prices at which drilling would increase are plotted to the right of the graph in an upward curve.
FIGURE 4A
Natural Gas Prices at Which Operators
Would Alter 2012 Drilling Plans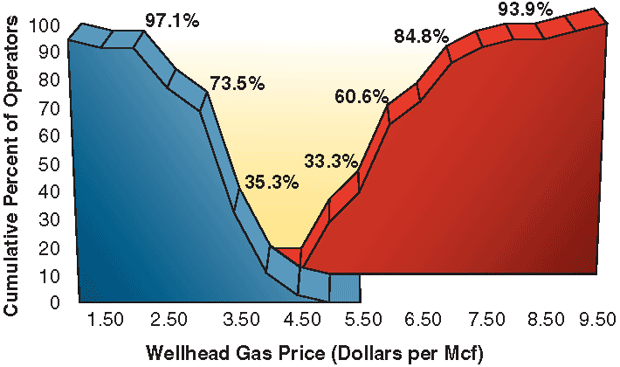
Survey respondents indicate they are making their 2012 drilling plans based on a West Texas Intermediate spot price at Cushing, Ok., of $82.39 a barrel and a natural gas wellhead price of $4.14 an Mcf.
AOGR assesses respondents’ sensitivity to price fluctuations by also asking what price would cause them to change their 2012 drilling plans. Similar to a year ago, respondents indicate much less tolerance for any drop in natural gas prices than they have for lower crude oil prices.
Better than one-third (35.3 percent) of survey respondents said they would reduce the number of wells they planned to drill if wellhead gas prices dropped below $3.50 an Mcf, and 73.5 percent would cut back at $3.00 (Figure 4A). If natural gas prices fall to $2.00 an Mcf, 97.1 percent of survey respondents say they will drill fewer wells.
FIGURE 4B
Oil Prices at Which Operators Would
Alter 2012 Drilling Plans
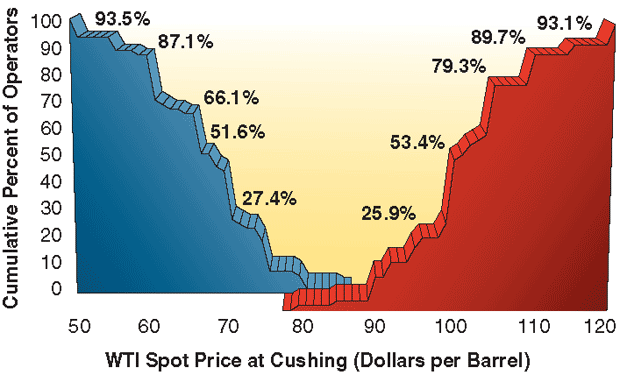
Percentages in Figure 4B represent the cumulative total of survey respondents who indicate they would have altered their 2012 crude oil drilling plans by the time West Texas Intermediate prices (delivered at Cushing, Ok.) reached the indicated amount. Prices at which drilling would decrease are plotted to the left of the graph in a downward curve; prices at which drilling would increase are plotted to the right of the graph in an upward curve.
Going the other way, exactly one-third of respondents would drill more wells at a wellhead gas price of $5.50 an Mcf, and 60.6 percent would drill more at $6.00 an Mcf. At $7.00 an Mcf, 84.8 percent of survey respondents would increase their gas well drilling, while 93.9 percent would increase at $8.00.
For crude oil, one-fourth (25.8 percent) of survey respondents would trim their drilling programs at a WTI spot price of $72 a barrel (Figure 4B). At $68 a barrel, 51.6 percent of respondents would cut drilling, while 67.7 percent would pull back at $64 a barrel. Those numbers go to 87.1 percent at $60 a barrel and 93.5 percent at $55 a barrel.
Perhaps indicating that any oil price north of $80 a barrel makes for generally acceptable economics, it is not until oil reaches $96 a barrel that a significant number of survey respondents would increase drilling, when 25.9 percent say they would do so. The percentage who would drill more wells jumps to 53.4 at $100 a barrel, climbs to 79.3 at $105 a barrel, and hits 89.7 at $110 a barrel.
For other great articles about exploration, drilling, completions and production, subscribe to The American Oil & Gas Reporter and bookmark www.aogr.com.