


2018 Industry Outlook
U.S. Independents Set Sights On Increased Activity In 2018
By Bill Campbell
In a Dec. 1 oil field services sector comment, commodities analysts at Evercore ISI observe, “We are well into a North American recovery and at the cusp of an international and offshore upcycle that is poised to unfold in 2018.”
And the headline on a news release announcing Wood Mackenzie’s 2018 Upstream Outlook declares, “Upstream companies shift focus from ‘survive’ to ‘thrive.’”
Those sentiments certainly are shared by respondents to The American Oil & Gas Reporter’s 2018 Survey of Independent Operators.
AOGR mails its survey to producers nationwide selected at random from the magazine’s subscription list. No attempt is made to identify survey respondents, and AOGR staff compile and analyze the data.
Those respondents predict they will drill 41.7 percent more wells this year than they did in 2017.
Respondents to the Survey of Independent Operators are broken into two categories. Category 1 respondents are less active drillers who project they will drill five or fewer wells this year. Category 2 respondents say they will drill six or more wells in 2018.
AOGR also tabulates results for “oil operators”–those who targeted crude oil on more than half their 2017 wells–and for “gas operators”–those who drilled any natural gas wells in 2017 or plan to drill any in 2018. The Survey of Independent Operators does not account for dry holes, and merely asks whether a well is targeting crude oil or natural gas when spudded.
FIGURE 1
Change in Operators’ Planned 2018 Drilling
Compared with 2017 Actual Drilling
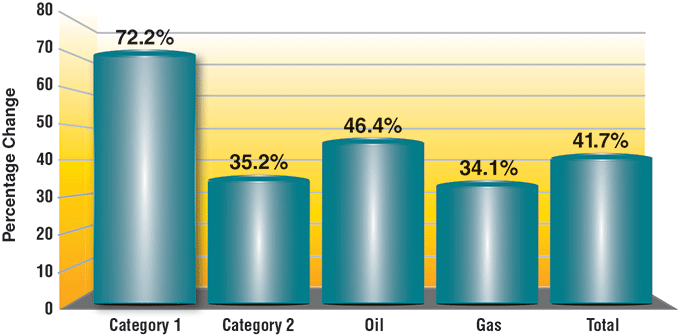
Category 1 respondents are those that plan to drill five or fewer wells in 2018. Category 2 respondents will drill six or more wells in 2018. Respondents included in the “oil” category targeted crude oil on more than 50 percent of their 2017 wells, while respondents that drilled some natural gas wells in 2017 or plan to drill any gas wells in 2018 are tabulated as “gas” drillers.
Category 1 operators are far more optimistic than those in category 2, projecting a 72.2 percent increase in wells drilled this year, compared with a 35.2 percent increase for category 2 (Figure 1).
It should be noted, however, that category 1 respondents drilled an average of only 1.5 wells in 2017 and are projecting an increase to 2.6 wells in 2018, whereas category 2 respondents drilled an average of 11.1 wells last year and project going to 15.0 wells this year.
Furthermore, because its recipients are selected randomly, the Survey of Independent Operators tends to be weighted toward the preponderance of small companies that comprise the majority of the U.S. independent oil and gas operator universe.
By comparison, the Market Intelligence Team at Drillinginfo predicts a 16 percent increase in wells drilled this year for the 85 large U.S. operators it tracks. What many of those operators tell Drillinginfo, Vice President of Market Intelligence Bernadette Johnson advised in early December, “is they are going to keep the rig count flat and may even pull back a couple rigs, but the number of wells drilled is going to increase, meaning we will do more with the rig count we have. And, of course, they are going to increase volume.”
Raymond James analysts project U.S. producers will put an average of 1,100 rigs back to work in 2018, which is a 19.6 percent increase over the 920 rigs the firm counted at the time of its November report.
Finger On The Trigger
Evercore ISI also projects about a 15 percent increase in 2018 well spuds over 2017 in its Nov. 14 Drilling Permit Monthly.
And in a Dec. 14 oil field services sector comment, the firm adds, “Since late September, permitting activity has outpaced the active rig count, suggesting that another correction is due after the first of the year. We believe that commodity price improvement will yield continued permit growth, which likely results in a U.S. rig count that grinds higher after stagnating during fourth quarter ’17.”
Evercore points out that through November, 2017 permits exceeded the 2016 level by 60 percent. With the four-week rolling permit average projecting that December permits likely would come in at the highest monthly total for the year, Evercore concludes, “U.S. land clearly has its ‘finger on the trigger.’”
But Evercore also says it sees a “handoff” in drilling activity from larger to smaller operators.
Again from its November Drilling Permit Monthly, “We have postulated for several months that continued robustness in permitting would force the rig count steadily higher, and instead we have witnessed more ‘stabilization’ than growth.”
Evercore offers two reasons for this. First, it says, “Softness in the rig count is symptomatic of the larger E&Ps out drilling their completion programs.”
But more importantly, the firm continues, “The number of smaller privates/independents operating rigs has increased substantially. With commodity prices again on the rise . . . we believe an influx of smaller private/independent operators will drive permitting activity into year end. This handoff . . . will result in another leg up for the rig count in first quarter 2018 if the strong macro continues.”
Drilling And Spending Plans
Nearly 88 percent of respondents to AOGR’s Survey of Independent Operators indicate they will drill at least as many wells this year as last (Figure 2), with 71.7 percent reporting a planned increase. Category 2 respondents have a somewhat more robust expectation, with 79.0 percent projecting an increase, compared with 68.3 percent of category 1 operators who expect to drill more wells.
FIGURE 2
Operators’ 2018 Drilling Plans Compared with 2017
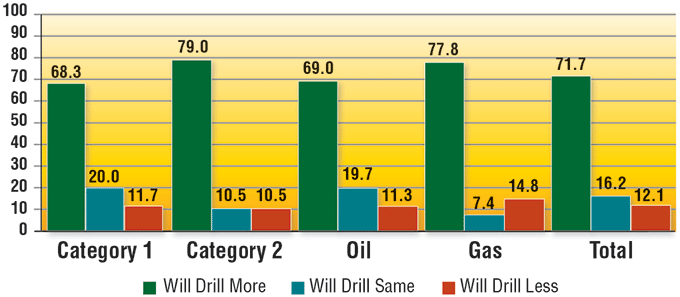
Gas operators track category 2, with 77.8 percent projecting an increase, compared with 69.0 percent of oil operators.
A slightly different, but somewhat comparable metric comes from Deloitte LLP’s 2017 oil and gas industry survey, conducted last summer. Deloitte says of the 250 industry professionals it interviewed, 15 percent expect an increase in rigs deployed this year, while 24 percent expect no change and 54 percent anticipate a decrease.
In its Third Quarter Energy Survey, the Federal Reserve Bank of Kansas City says “three-fourths of respondents expect rig counts to remain close to current levels,” and “slightly more than a fifth expect an increase.”
The Kansas City Reserve’s survey was conducted during the second half of September and surveyed companies in Missouri, Kansas, Colorado, Nebraska, Oklahoma, Wyoming and the northern half of New Mexico.
AOGR also asks operators whether their 2018 drilling budgets will increase, decrease or stay the same compared with 2017. Results show 72.0 percent of respondents say they will spend more, while 18.0 percent will spend the same and only 10.0 percent anticipate a budget decrease (Figure 3).
FIGURE 3
Operators’ 2018 Spending Plans Compared with 2017
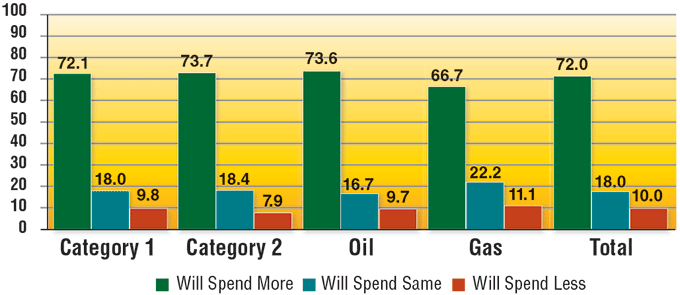
There is less difference among respondent categories in this measure, with 72.1 percent of category 1 drillers expecting budget increases, 73.7 percent of category 2, 73.6 percent of oil operators and 66.7 percent of gas drillers.
Drillinginfo reports that 66.7 percent of the companies from which it has received early guidance expect their capital expenditures to be larger this year than last, while 20.0 percent anticipate the same capex and 13.3 percent plan to spend less.
Deloitte reveals that 43 percent of the upstream respondents to its summer 2017 survey expect to boost capex while 51 percent project a decline.
And the Federal Reserve Bank of Dallas says in its third quarter survey of oil and gas companies in Texas, Louisiana and the southern half of New Mexico that 45.5 percent are anticipating a higher level of spending in 2018, while 36.4 percent report no change and 18.2 percent anticipate a decline.
“The company outlook index posted a sixth consecutive positive reading and rose from 20.3 in the second quarter to 28.3 in the third quarter,” the Dallas Fed says of the survey conducted in mid-September. “The uncertainty index regarding the outlook plunged from 35.0 to 4.9.”
Crude Oil Prices
At the end of the day, everything comes down to price. Most market analysts expect 2018 crude oil prices somewhere in the $50s.
Toward the lower end, Moody’s Investor Service predicts a $40-$60 price band for West Texas Intermediate and Brent crude “in spite of the extension of OPEC-led production cuts to the end of 2018.”
BMO Capital Markets predicts a WTI price range of $50-$60 with “a reduced risk they will decline into the $40 range,” according to one published report.
The U.S. Energy Information Administration projects a WTI average spot price this year of $51.04 a barrel in its December Short Term Energy Outlook, with fourth quarter prices reaching $53.95 a barrel.
Drillinginfo forecasts WTI prices to average $52.00 a barrel.
In an article written for the Texas Independent Producers & Royalty Owners Association’s newsletter, Boston Energy Research analyst Paul Kuklinski suggests an average of $53.00 a barrel, and a Reuters poll of 30 economists following OPEC’s Nov. 30 announcement that it was extending its production cuts through 2018 predicted crude futures would average $54.78 a barrel in 2018, up from a previous forecast of $52.50.
Evercore ISI’s 2018 price projection comes in at $56 a barrel, as does the World Bank Group in its Commodity Markets Outlook released Oct. 26 “on strong oil demand and restraint in OPEC and non-OPEC production.”
RBC Capital Markets predicts WTI will average $59 for the year, rising from $57 in the first quarter to $63 in the fourth quarter. And the Royal Bank of Canada thinks WTI will average $58 a barrel, remarking, “While we see prices as largely range bound, (2018) is fraught with potential ‘gap’ risk, given that many variables have upward skew potential.”
At the top of the range is Raymond James, which is projecting $65 WTI, based on an analysis of oil inventories in Organization of Economic Cooperation and Development-member countries.
Raymond James explains its departure from the norm in price projections in its Dec. 4 energy sector Industry Brief: “Approximately 30 days of consumption has been the long-term average or inventory ‘balancing point’ for the right level of OECD inventories relative to global demand. Using a simple five-year average, many are assuming that ‘normal’ inventories today should be closer to 2.85 billion barrels, but that ignores the additional inventories needed to accommodate demand growth.
“Over the past five years,” Raymond James continues, “global demand has risen by about 7 percent. Normal OECD inventories today should be closer to 2.95 billion barrels. That means that as of September, OECD inventories were just hitting the right, or normal level, based on global oil demand.
“We expect (OECD oil inventories) to continue falling through 2018 to about 28 days,” Raymond James concludes. “Keep in mind, 28 days of consumption is close to the lows seen in late 2013-early 2014 when oil prices were above $100 a barrel.”
Price-Induced Drilling
Respondents to AOGR’s Survey of Independent Operators are basing their 2018 drilling plans on a $53.43 a barrel spot price for WTI delivered at Cushing, Ok. Price expectations range from $50.33 a barrel for category 2 drillers to $55.26 for category 1 drillers. Oil operators are expecting a WTI price of $51.44 a barrel while gas operators anticipate $54.38 a barrel.
The Dallas Fed reports that about 30 percent of its 11th District operators expect oil prices to range between $45.00 and $49.99 this year with another 54 percent coming in at between $50.00 and $54.99 for a survey average of $50.20 a barrel.
AOGR also asks at what price survey respondents would increase or decrease their 2018 drilling plans. The first key inflection point for increased drilling is $60, at which 33.3 percent of respondents say they will increase their 2018 drilling budgets (Figure 4A). The percentage rises to 60.0 percent at $65 a barrel and to 82.7 percent at $70 a barrel.
FIGURE 4A
Crude Oil Prices at Which Operators
Would Alter 2018 Drilling Plans
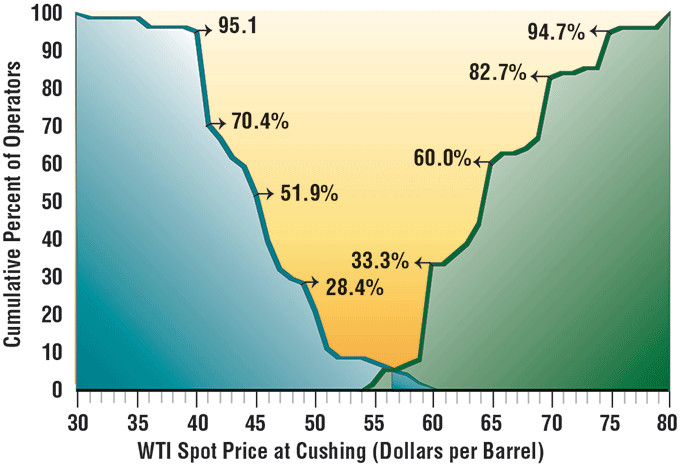
Percentages in Figures 4A and 4B represent the cumulative total of survey respondents that indicate they would have altered their 2018 drilling plans by the time the spot price for West Texas Intermediate crude oil delivered at Cushing, Ok. (Figure 4A), or the wellhead natural gas price (Figure 4B) reached the indicated amount. Prices at which drilling would decrease are plotted to the left of the graphs in downward curves; prices at which drilling would increase are plotted to the right of the graphs in upward curves.
On the downside, 21.0 percent of AOGR survey respondents say they will cut back their 2018 drilling if crude oil prices drop to $50 a barrel. That percentage rises to 28.4 percent at $49 a barrel, then jumps to 51.9 percent at $45 and to 95.1 percent at $40.
By comparison, in its 2018 Global E&P Spending Outlook, Evercore ISI, which reports producers on its watch list “are quoting a 2018 WTI price average of $51.50,” says while only 14 percent of its survey group would increase drilling at $55-$60 crude, another 40 percent would do so when prices climb above $60, and the cumulative percentage climbs to 90 percent at $65 a barrel.
Going the other way, Evercore finds that 58 percent of operators would cut back on drilling programs if crude oil fell to $45 a barrel, and 96 percent would do so at $40.
Drillinginfo calculates break-even prices for 300 oil and gas formations around the country. “There are a lot of fields on the margin between $52 and $60,” Johnson reveals. “If prices drop below $52, and certainly below $48, we would expect a pullback. If prices jump up to $60, we will see some ramp up.”
Natural Gas Prices
Natural gas price expectations–and projections–come in a fairly narrow range. Raymond James is projecting an average of $2.75 an Mcf in 2018, down from $3.11 in 2017. The Kansas City Fed reports that the 10th District operators it surveyed say they need $3.05 an MMBtu to be profitable. Asked what prices they expected six months and a year out from the late-September survey, the Kansas City Fed says its respondents predicted $3.01 and $3.11 an MMBtu.
The World Bank is predicting a 2018 average natural gas price of $3.10 an MMBtu based “on strong domestic demand, expanding exports and an only modest increase in production.” It adds, “Demand for gas is expected to strengthen from new chemical and fertilizer capacity, and from rising exports by pipeline to Mexico and by way of liquefied natural gas worldwide.”
Drillinginfo projects an average Henry Hub cash price for natural gas this year of $3.00 an Mcf. Again referring to Drillinginfo’s analysis of formation break-even prices, Johnson comments, “The band between $3.00 and $2.50 brings a lot of stuff into or out of the money. You don’t really see a marked increase in gas supply until you get to $4.00. Then to the downside, $2.50 knocks out a fair amount of activity.”
The EIA’s December estimate for natural gas prices is a $3.21 average for 2018, beginning the year at $3.36 and ending at $3.23.
Respondents to the Survey of Independent Operators say their 2018 drilling plans are based on an expectation of a $2.96 wellhead natural gas price with very little variance among categories. Both category 1 and 2 drillers come in right on the average at $2.96, while oil operators say they need $2.98 an Mcf and gas operators require $2.94.
FIGURE 4B
Natural Gas Prices at Which Operators
Would Alter 2018 Drilling Plans
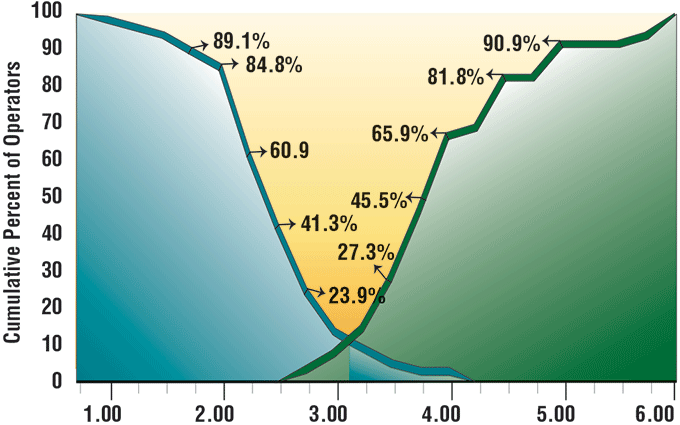
Percentages in Figures 4A and 4B represent the cumulative total of survey respondents that indicate they would have altered their 2018 drilling plans by the time the spot price for West Texas Intermediate crude oil delivered at Cushing, Ok. (Figure 4A), or the wellhead natural gas price (Figure 4B) reached the indicated amount. Prices at which drilling would decrease are plotted to the left of the graphs in downward curves; prices at which drilling would increase are plotted to the right of the graphs in upward curves.
About a 50-cent bump in prices will get more rigs turning to the right, according to AOGR respondents, with 27.3 percent saying they will drill more wells at a $3.50 wellhead gas price (Figure 4B). That goes to 45.5 percent at $3.75 and 65.9 percent at $4.00.
On the other side, 23.9 percent of survey respondents say they will drill fewer wells if gas prices fall to $2.75 an Mcf. That grows to 41.3 percent at $2.50, 60.9 percent at $2.25 and 84.8 percent at $2.00.
Oil And Gas Production
Finally, the Survey of Independent Operators asks respondents how much their first quarter 2018 crude oil and natural gas production will be up or down compared with first quarter 2017.
Active drillers–defined as companies that drilled at least one well in 2017 or expect to drill at least one in 2018–report they expect this year’s first quarter crude oil production to be up 4.4 percent and first quarter natural gas production to be up 2.9 percent. Add respondents who did not drill any wells last year and don’t expect to drill any this year, and those percentage increases in oil and gas production drop to 2.9 and 1.5, respectively.
In its December Short-Term Energy Outlook, the EIA puts first quarter 2018 crude oil production at 9.58 million barrels a day, up 9.2 percent from first quarter 2017. EIA projects first quarter 2018 natural gas production at 83.81 billion cubic feet a day, up 9.5 percent from 76.47 Bcf/d in first quarter 2017. EIA says it expects U.S. crude oil production to end the year at 10.07 MMbbl/d and to average 9.95 MMbbl/d this year, up 7.8 percent from last year’s 9.23 MMbbl/d average. It projects natural gas production will end the year at 85.65 Bcf/d and will average 84.80 Bcf/d, up 9.0 percent from 2017’s average of 78.76 Bcf/d.
Johnson says Drillinginfo anticipates 900,000 bbl/d of incremental crude oil production to be brought on by December this year along with about 5 Bcf/d of incremental gas production. “Since November, we have seen more than 2.0 Bcf/d of growth out of the Northeast,” she elaborates. “They built pipes, brought them on, and we are filling them pretty quickly. We are going to see a bump up there in the first quarter as the Rover Pipeline and some of the other pipelines that were delayed come on. Then you have the Permian and the Anadarko growing. Those combined get us to about 5 Bcf/d by the end of 2018.”
Other predictions come from the Kansas City Fed, which says 10th District producers expect U.S. crude oil production to hit 9.9 MMbbl/d by the end of 2018, while an article published Dec. 4 quotes Barclays Capital analysts projecting 1.0 MMbbl/d in U.S. production growth by 2018 year-end.
In its mid-September survey, the Dallas Fed reports, its 11th District oil companies anticipate U.S. crude production will reach 9.9 MMbbl/d by 2018 year-end “with about 30 percent of responses falling between 9.5 MMbbl/d and 9.99 MMbbl/d, and 39 percent falling between 10.0 MMbbl/d and 10.49 MMbbl/d.”
In its October Commodity Markets Outlook, the World Bank projects U.S. crude oil production to comprise 1.1 MMbbl/d of a total non-OPEC world supply increase of 1.5 MMbbl/d.
Focus On Profitability
Several analysts comment on a perceived shift among the country’s top publicly-traded E&Ps from focusing on production growth to paying dividends. In its December Sector Comment, Moody’s remarks, “U.S. shale producers are paying increasing attention to capital discipline and return-focused performance,” although the firm quickly adds, “With prices rising and the ability to hedge and lock in favorable returns, we believe U.S. shale production will continue to grow as prices rise, increasing global production and keeping a lid on prices.”
Evercore ISI observes, “E&Ps have acquiesced to shareholders’ demands for the industry to realign itself around returns rather than unbridled production growth. While E&P austerity messaging may mean that we no longer can bank on them outspending cash flow, higher oil prices provide more latitude to spend more and stay within cash flow. Time will tell whether the industry relapses into its old ways of outspending cash flows, but the long-term health of the industry stands to benefit if the industry maintains discipline during this transitory obsession with short-cycle shale.”
The Survey of Independent Operators doesn’t identify shale players per se, but does ask whether wells are targeting conventional or unconventional crude oil, and conventional natural gas, unconventional dry gas and unconventional wet gas.
In 2017, 44.7 percent of wells drilled by survey respondents targeted conventional oil, which grows to 55.1 percent in 2018. Unconventional oil was the target for 23.3 percent of respondents’ 2017 wells, while only 17.0 percent will do so in 2018.
13.1 percent of respondents’ 2017 wells targeted conventional natural gas, 16.0 percent were aimed at unconventional dry gas and 2.7 percent sought unconventional wet gas. This year the numbers are 10.1 percent for conventional natural gas, 15.9 percent for unconventional dry gas and 1.9 percent for unconventional wet gas.
The ratio of wildcats to development wells is practically unchanged, at 21.8 percent wildcat and 79.2 percent development wells in 2017 going to 22.0 percent wildcats and 78.0 percent development wells in 2018.
For other great articles about exploration, drilling, completions and production, subscribe to The American Oil & Gas Reporter and bookmark www.aogr.com.