


Natural Gas White Papers
U.S. Natural Gas Demand, Exports And Production To Set Records This Winter
By Orlando A. Alvarez
WASHINGTON–Both U.S. natural gas supply and demand are projected to reach historic highs this winter, according to the Natural Gas Supply Association’s annual forecast of the wholesale winter natural gas market.
Soaring demand will be driven by record volumes of liquefied natural gas exports, pipeline exports to Mexico and demand growth in the domestic electricity sector. Even with demand jumping by an estimated 3.1 billion cubic feet a day compared with last winter to reach a record 109.3 Bcf/d, U.S. production is forecast to ably satisfy demand.
Total gas production is projected to grow by 3.8 Bcf/d winter over winter. That level of annual growth is substantial, particularly when it is added to the remarkable increase of more than 10 Bcf/day that occurred last winter.
Production continues to reach new milestones, with U.S. production growing by an amazing 40 percent since 2013. Building on the past six years, the combination of abundant supplies and healthy storage inventories points to good news again this winter for natural gas consumers. Wholesale natural gas prices averaged $3.33 per MMBtu in Winter 2018-19. U.S. natural gas should stay even more reliable and affordable this winter while satisfying growing demand for cleaner-burning electricity, manufacturing and heating both at home and around the world.
The shale revolution not only has benefited customers with stable and low prices, but it has enabled U.S. carbon emissions to be reduced to 25-year lows. Natural gas producers continue to work to do even more to support a clean energy future.
Strong Momentum
Lower-48 dry gas production has showed strong momentum this year, thanks to more than 12 Bcf/d of new Northeast pipeline take-away capacity placed into service since 2018 and growing associated gas production in the Permian. In total, dry gas production is forecast to climb 4% over last winter to average 92 Bcf/d, up 20 Bcf/d since winter 2015-16. Figure 1 shows gas production output by region from 2013 through August 2019.
FIGURE 1
U.S. Natural Gas Production Growth
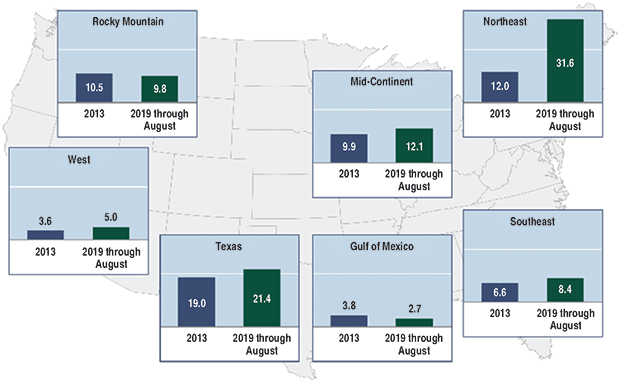
Through the first nine months of 2019, Energy Ventures Analysis (NGSA’s consulting and forecasting firm) estimates that associated gas production accounted for the majority of U.S. gas production growth, although Marcellus output continued to lead the way by adding 3.3 Bcf/d. Permian Basin associated gas production jumped by 2.2 Bcf/d year over year, representing a 29% increase. Take-away capacity constraints put downward pressure on regional Permian gas prices this year, resulting in El Paso Permian and Waha delivered prices trading in negative territory on occasion as production outpaced take-away capacity. The completion of several new crude oil pipelines, allowing incremental growth of associated natural gas production, further added to the imbalance.
In 2020, Permian associated gas is expected to be the largest contributor to increased U.S. production, with production likely to ramp up quickly as the 2 Bcf/d Gulf Coast Express pipeline (it entered service in September) and cross-border Mexico export pipelines begin shipping gas. Several other pipeline projects in various stages of development will enable Permian gas production to expand, including the 2 Bcf/d Permian Highway and 2 Bcf/d Whistler projects, which are scheduled to come on line in late 2020 and mid-2021, respectively. As this new take-away capacity becomes available, the Permian’s backlog of drilled but uncompleted wells could add up to 5.5 Bcf/d in new supply.
The huge wave of new take-away capacity that came on line last year in the Northeast, along with stronger regional demand, has allowed Appalachian gas production to grow by nearly 8 Bcf/d. Dry gas production from the Marcellus, Utica and Haynesville shales is forecast to increase this winter to meet regional demand. However, while the region appears to have ample spare take-away capacity installed, the effective capacity might be smaller given downstream pipeline constraints. For example, the Mountaineer Xpress pipeline has been flowing at approximately 1.8 Bcf/d, which is only 70% of the pipeline’s design capacity. Other proposed regional pipeline projects in the Northeast may face additional delays because of anti-fossil fuel activism.
Looking at Canadian imports into the United States, net imports fell from 6.7 Bcf/d in 2017 to 6.5 Bcf/d in 2018. That declining trend has continued in 2019, and Canadian imports are expected to remain flat to declining in 2020 mostly because of strong competition from low-cost U.S. Appalachian gas.
Record Export Volumes
TABLE 1
Wintertime Natural Gas Demand
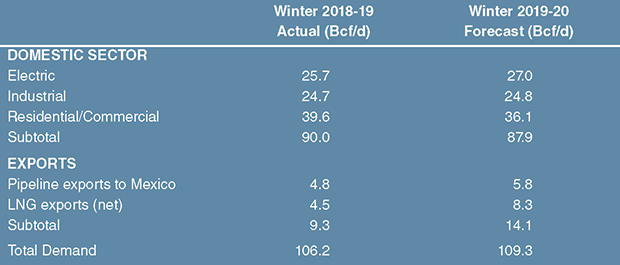
Table 1 shows domestic demand and export projections for winter 2019-20 compared with last winter. Liquified natural gas exports and pipeline exports to Mexico will lead the demand growth. Total U.S. natural gas exports are expected to grow by 4.8 Bcf/d to a record 14.1 Bcf/d this winter compared with last (an increase of 52 percent).
LNG exports are bringing the environmental benefits of lower emissions to overseas customers, while providing jobs, economic benefits and stability to the U.S. market. Three new LNG trains–Elba Island Phase II (100 MMcf/d), Freeport Train 2 (700 MMcf/d) and Cameron Train 2 (700 MMcf/d)–are expected to start up soon, bringing total LNG export capacity to 8.5 Bcf/d by March 2020. That would be a whopping 3.8 Bcf/d higher than last winter’s average of 4.5 Bcf/d (Figure 2).
FIGURE 2
U.S. LNG Export Capacity
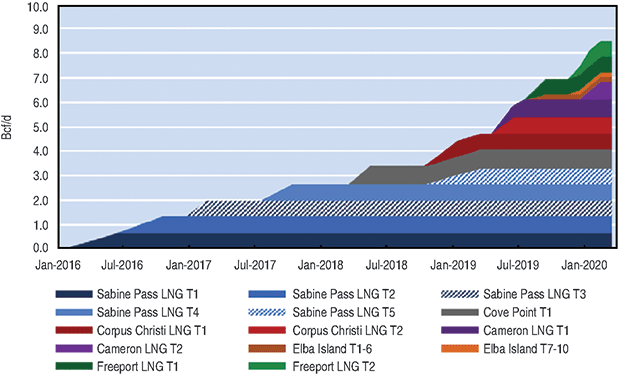
Last summer, Cameron Train 1 (700 MMcf/d) and Corpus Christi Train 2 (700 MMcf/d) began commercial operations. Last fall, commissioning of Elba Island (200 MMcf/d) and Freeport Train 1 (700 MMcf/d) followed. Assuming normal global winter conditions, U.S. LNG export demand is forecast to average 8.3 Bcf/d over the winter months.
Looking beyond this winter, additional U.S. LNG export projects have made progress by reaching positive final investment decisions, including:
- The third train at Cheniere Energy’s Corpus Christi facility and the sixth train at its Sabine Pass facility, bringing the company’s total nameplate export capacity to 42.3 million metric tons per annum (~5.9 Bcf/d);
- The first of three trains planned for completion in early 2024 at ExxonMobil and Qatar Petroleum’s Golden Pass facility (~2.1 Bcf/d); and
- Venture Global’s Calcasieu Pass project (~1.7 BCFD).
U.S. pipeline exports into Mexico have more than doubled over the past five years, growing from 2.2 Bcf/d in 2014 to 4.8 Bcf/d in 2019 thanks to cross-border pipeline build-outs. Driven by the new pipeline capacity, U.S. natural gas pipeline exports to Mexico are projected to average 5.8 Bcf/d, up 21% from last winter.
New pipelines and expansion projects constructed over the past five years have almost tripled the volume of natural gas exports from Texas to Mexico. In September, the 2.6 Bcf/d Sur de Texas-Tuxpan marine pipeline that runs under the Gulf of Mexico began operating. The increase in natural gas flow through Sur de Texas-Tuxpan is expected to replace LNG imports into the Altamira terminal. Several other pipeline projects have been completed over the past two years or are currently under construction, including the Wahalajara system that could provide take-away for Permian gas production into Central Mexico.
Robust Power Burn
Demand for electric generation has been very strong, averaging 1.4 Bcf/d higher on a year-over-year basis. The robust power burn is the result of stable and affordable natural gas prices, which encourage the dispatch of gas-fired generation units as well as structural growth related to highly efficient combined-cycle gas turbine (CCGT) units. CCGT additions have created a strong base for power burn growth. Energy Ventures Analysis estimates that a $0.20/MMBtu decline in price would increase power burn by 1.2 Bcf/d, while a $0.20/MMBtu increase would reduce power burn by only 0.6 Bcf/d. Therefore, there is more potential upside to power burn for this coming winter because of the market price sensitivity of demand.
FIGURE 3
Natural Gas Demand in Power Generation Sector
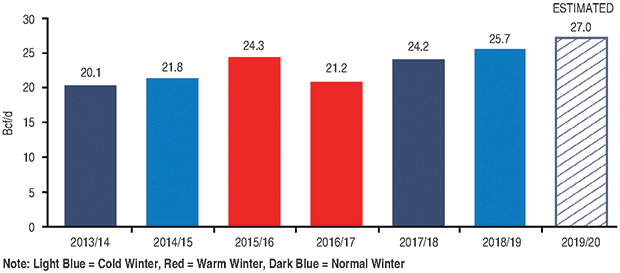
As a result, demand in the power generation sector is forecast to average 27 Bcf/d this winter, or 1.3 Bcf/d higher than last winter (Figure 3). On a regional level, power burn in the East Coast is expected to grow by 600 MMcf/d this winter to average 12.1 Bcf/d. The South Central and Midwest regions also are expected to see strong growth, with power burn forecast to increase by 400 MMcf/d and 200 Mcf/d, respectively. The strong growth in these regions is attributed to the proximity to abundant low-cost natural gas resources and new natural gas-fired unit additions over the past few years.
Industrial natural gas demand has grown substantially in recent years, thanks to continuing economic growth and the availability of low-cost natural gas supplies. Between 2015 and 2018, 40 new industrial projects came on line. Those projects represented an estimated 1.7 Bcf/d in new gas demand and a total investment of $50 billion. An additional 47 projects are expected to come on line between 2019 and 2023, which potentially could add another 2.0 Bcf/d of incremental demand at a total investment of $82.8 billion. Among these new projects, petrochemical facilities will continue to dominate.
For example, two large new methanol plants on the Gulf Coast, the Big Lake 1 and St. James 1, are both expected be in service in 2020. In addition to Gulf Coast methanol projects, two smaller methanol facilities, Primus Green Energy and Liberty One, also are commencing operations in West Virginia. Their proximity to the Appalachian Basin ensures feedstock natural gas supply at a relatively low cost.
It should be noted that like the residential and commercial sector, some industrial demand also is closely correlated to wintertime weather. Consequently, industrial demand can swing 3 Bcf/d-4 Bcf/d depending on seasonality, representing 10-15% of industrial demand. With the National Oceanic & Atmospheric Administration’s forecast calling for 4 percent warmer weather than last winter, industrial demand is projected to be up only slightly to 24.8 Bcf/d.
Demand in the residential sector has remained largely flat over the past few years. Natural gas usage in the commercial sector is driven by economic growth and energy efficiency improvements to heating and building components. Much of the growth in commercial use is related to business expansion and is mostly offset by continuing improvements in energy efficiency.
However, residential and commercial consumption remain strongly correlated with wintertime weather. Historically, combined winter residential and commercial gas demand has swung from 31.9 Bcf/d to 41.3 Bcf/d, depending on weather conditions. Assuming 4% warmer weather than last winter results in 3,469 gas-weighted heating degree days and average residential and commercial demand of 36.1 Bcf/d, about 3.5 Bcf/d lower than last winter.
Based on the near-term supply and demand dynamics, natural gas storage levels are forecast to finish the 2019-20 winter withdrawal season at 1.83 trillion cubic feet, or slightly above the five-year average. That assumes 10-year normal weather and total gas withdrawals of 1.88 Tcf, which would be slightly lower than the five-year average. Production growth is expected to respond quickly to demand gains, resulting in lower-than-average storage withdrawals this winter.

ORLANDO A. ALVAREZ is chairman of the Natural Gas Supply Association and head of BP’s North American gas marketing and trading business. Alvarez also is a member of BP America’s board of directors and BP’s global supply and trading organization’s executive leadership team. His tenure at BP spans more than 20 years with current accountability for North American trading, marketing, supply and derivatives activities, specifically pertaining to natural gas, power and natural gas liquids.
For other great articles about exploration, drilling, completions and production, subscribe to The American Oil & Gas Reporter and bookmark www.aogr.com.