


Natural Gas White Papers
Uncertainties Persist, But Market Fundamentals Point To Higher Winter Prices
By Orlando A. Alvarez
WASHINGTON–The U.S. natural gas market has experienced remarkable change during the past decade, yet gas supply has demonstrated equally remarkable resiliency and reliability–even during the ongoing COVID-19 pandemic, which has caused significant disruption to domestic and international energy markets.
The Natural Gas Supply Association has issued market outlooks for every winter heating season since 2001-02 to provide an indication of whether market pressures on natural gas prices would be upward, downward or neutral compared with the previous winter. To appreciate precisely how much the market has evolved in a short timespan, consider that in NGSA’s 2012-13 winter outlook, total domestic production was forecast to average less than 65 billion cubic feet a day and liquefied natural gas was mentioned only in relation to a relatively small (less than 1 Bcf/d) volume of LNG to be imported that winter.
Since then, the United States has become the world’s top natural gas producer and one of the largest LNG exporters, with 65 Bcf equivalent of LNG cargoes departing Gulf Coast LNG terminals in the first full week of November, according to the U.S. Energy Information Administration. That was the equivalent of some 10 Bcf/d of pipeline feed gas deliveries.
With a 33% increase in production since 2013, the shale revolution has ushered in a remarkable era, with ongoing improvements and efficiencies that keep supply flowing. It has benefited customers with stable low prices, and shrunk carbon emissions to 15-year lows, thanks in large part to natural gas displacing coal in the power generation sector. Natural gas producers are working to do even more to support a clean energy future that is affordable for all.
But with the winter of 2020-21 now underway, the market again finds itself in a very different place than at the start of the prior winter. Looking at market fundamentals, the good news for gas producers is that key supply and demand variables–weather included–indicate upward pressure on the natural gas market this winter as compared with last winter, when Henry Hub prices averaged a lackluster $2.08/MMBtu. Total natural gas demand this heating season should recover to within 1 Bcf/d of last winter’s average daily consumption. The good news for consumers is that, according to NGSA’s Winter Outlook, supply is expected to ably satisfy demand and natural gas will remain affordable and reliable.
Historically, the weather has been the biggest wild card in projecting how supply and demand may balance during the course of a November-to-March heating season. This winter started with one of the warmest Novembers on record, but the coldest potential months with peak demand are still ahead and the long-range forecasts call for colder temperatures than last year. However, this winter is especially unpredictable with the effects of the COVID-19 pandemic.
NGSA bases its analysis on publicly reported data in five key areas:
- Economic indicators;
- Weather;
- Demand;
- Natural gas production; and
- Storage.
Although each of these potential “pressure points” is identified separately, all of them are interrelated. Any significant deviation of a single pressure point is likely to affect the other assumptions in the equation. As winter began, highly encouraging announcements of multiple successful COVID vaccines hit the news. At the same time, however, COVID infection rates were increasing across much of the country and Europe, which reinforced the risk to near-term economic growth and energy demand.
Flexible And Adaptable
Factoring in all five potential pressure points, and considering the extraordinary circumstances that affect everyone’s lives both in and outside the natural gas industry, the picture that emerges from the NGSA’s study of winter 2020-21 is one of a flexible and adaptable market that is able to respond to variations in weather and changing demand drivers with ample supply and sufficient storage.
TABLE 1
Summary of Winter Supply and Demand Forecast
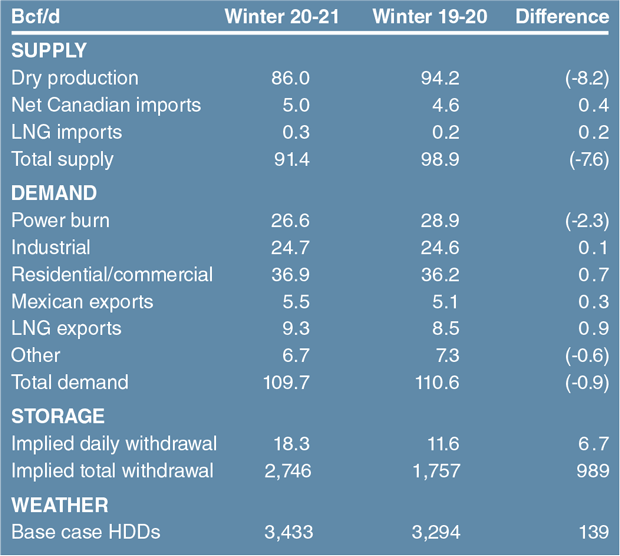
Table 1 summarizes the winter’s supply, demand and storage forecasts. Notwithstanding the unseasonably warm weather in November, which had the effect of reducing December-February natural gas futures strip prices to below $3.00/MMBtu by the third week of November, the expected upward pressure on prices comes from the combination of weather–which is forecast to be 4% colder than last winter (though still 3% warmer than the 30-year average)–and supply, which is projected to average 8.2 Bcf/d less than last winter’s 94.2 Bcf/d.
Two factors are exerting downward pressure on the market: the economy and gas storage. With so much uncertainty and gross domestic product growth down significantly, both U.S. and global economic indicators can be characterized as moving from “slow growth” to a “recovering from recession” mode.
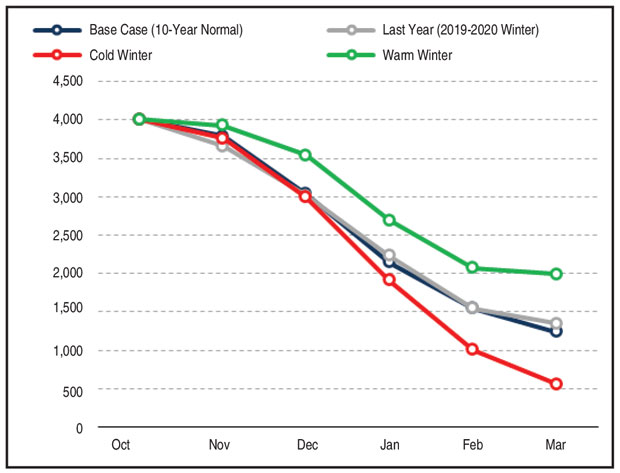
In regard to storage, Lower-48 inventories stood at 3.93 trillion cubic feet at the start of November, which was 200 Bcf higher than a year earlier and 9% higher than the five-year historical trend. There is a caveat, however. Colder average seasonal temperatures and an anticipated 8%-9% decline in wintertime production on a year-over-year basis mean the daily withdrawal from storage should average 6.7 Bcf/d more this winter, at 18.3 Bcf/d (up from 11.6 Bcf/d in winter 2019-20). That would draw down storage to well below the five-year average by the end of March (Figure 1).
FIGURE 1
Projected End-of-March Storage Under
Different Weather Scenarios
Demand is neutral overall, with total consumption forecast to average 109.7 Bcf/d this winter, down only 1% from 110.6 Bcf/d last year. Domestic demand from the residential/commercial, electricity generation and industrial sectors combined is forecast to dip 1.5 Bcf/d winter-over-winter (from 89.7 Bcf/d to 88.2 Bcf/d). By sector, residential/commercial demand is estimated to increase 2% thanks to colder weather and the fact that so many people are working and schooling from home. Industrial demand will be steady, increasing by 0.1 Bcf/d. The biggest decline is anticipated in electricity generation, with power burn slipping 9% as higher gas prices prompt utilities with fuel switching capabilities to dispatch more coal.
FIGURE 2
Feed Gas Demand by LNG Terminal
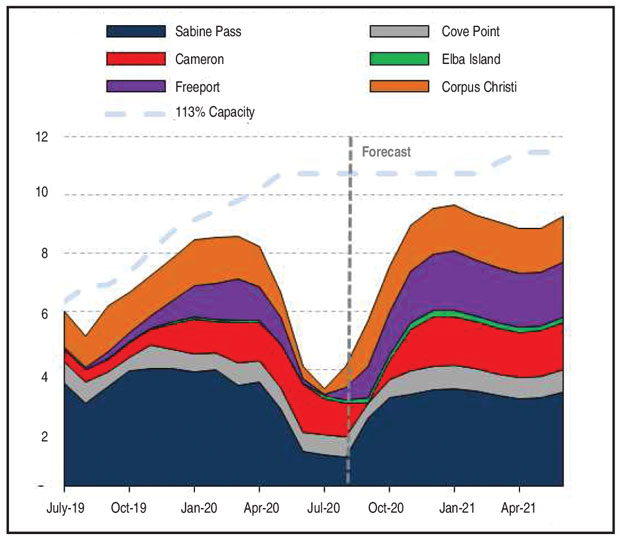
Total exports, including pipeline shipments to Mexico and outbound LNG cargoes, are forecast to climb 1.2 Bcf/d, from 13.6 Bcf/d to 14.8 Bcf/d. Pipeline shipments to Mexico continue to be robust, and the analysis projects an 8% winter-over-winter increase to 5.5 Bcf/d. U.S. LNG exports were running as high as 8.5 Bcf/d late last winter prior to the pandemic, and then slumped to 3.4 Bcf/d last summer. This winter, we see LNG exports averaging 8.7 Bcf/d in the fourth quarter and 9.4 Bcf/d through the first quarter of 2021, pushing to new records as demand from U.S. LNG trading partners in Asia, Europe and other regions increases (Figure 2). LNG offers the promise of a cleaner energy future that is affordable, accessible and can help grow emerging economies around the globe.
Demand Drivers
Looking closer at each demand sector, winter weather will continue to play its important role in residential and commercial consumption. I have been in the natural gas business for 34 years, and I have seen weather forecasters get it exactly right sometimes and get it very wrong at other times, making weather a perpetual wild card for gas demand forecasts. For this winter, the National Oceanic and Atmospheric Administration predicts 4% colder average temperatures than last winter, and 1% colder than the average of the past 10 years, with 3,433 heating degree days.
For comparison, the 2019-20 winter was the sixth warmest on record, averaging 9% warmer than the previous winter with 3,294 HDDs. The warm temperatures reduced demand and contributed to wintertime Henry Hub prices that averaged only $2.08/MMBtu.
NOAA’s forecast was assumed as the base case, but the analysis also included three other weather scenarios using average temperatures and HDDs from winter 2019-20, the “cold” winter of 2013-14, and the “warm” winter of 2015-16. Under the base case, end-of-March storage would be well below the five-year seasonal average at 1,243 Bcf. But according to the analysis, residential and commercial gas demand could swing more than 9 Bcf/d depending on weather patterns. Under a cold winter scenario, the tightening market would create greater upside price pressure as the heating season progresses, which could incentivize increased natural gas production.
Power burn demand has been very strong in 2020, averaging roughly 2 Bcf/d higher than in 2019 through the first three quarters. For this winter, power burn is expected to average 26.6 Bcf/d. New combined-cycle gas turbine additions during the past few years have driven robust power burn levels, and structural growth associated with combined-cycle gas turbine additions will increase further, establishing a strong base for continued growth. As noted, however, anticipated stronger gas prices this winter should somewhat limit the economics of switching from coal to natural gas.
Adjusted for weather, winter power burns have risen 6.5 Bcf/d since 2013-2014, primarily because of gas-fired plant additions that have displaced retiring coal-fired and nuclear power plants, according to research by Energy Ventures Analysis Inc. Figure 3 illustrates “structural” gas-fired growth versus temporary “economic” fuel switching in the electricity generation sector. With low prices last winter, a sizable share of the power burn demand was associated with economic dispatches of gas versus coal. Although it is likely that higher prices will mean coal takes some of this winter’s economically dispatched power burn, more than 7,500 megawatts of gas-fired capacity have been built during the past year alone, structurally expanding the share of natural gas in electricity generation.
FIGURE 3
Power Burn Structural Change versus Economic Fuel Switching
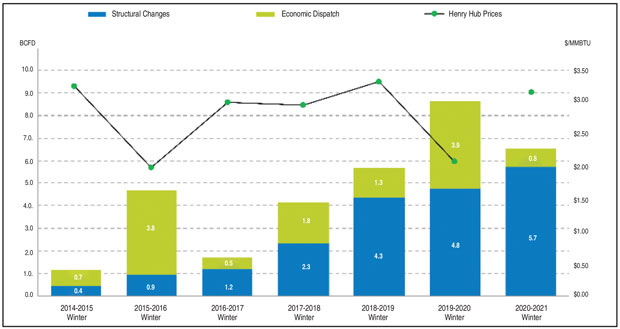
EVA’s research shows that today, 3 Bcf/d-4 Bcf/d of capacity is capable of temporarily switching fuels based on economics, a figure that is down from 6 Bcf/d a few years ago. That implies a larger percentage of the sector has switched permanently to natural gas as coal plants have retired, leaving less potential for temporary coal-to-gas switching for power burn.
Industrial natural gas demand has grown substantially in recent years thanks to continuing economic growth and the availability of low-cost natural gas. However, industrial demand tumbled last spring with the sharp fall in performance indexes across all energy-intensive industries after lockdowns were imposed to slow the spread of COVID. Industrial demand has stabilized, but with business uncertainty persisting about the pace of the recovery, it is expected to grow by only 0.1 Bcf/d during winter 2019-20.
However, new and expanding petrochemical, steel and fertilizer projects are poised to boost demand going forward. Between 2016 and 2019, a total of 39 industrial facilities came on line, representing an aggregate 1.5 Bcf/d in new incremental demand. Another 37 projects representing a $62 billion total investment are expected to enter service between 2020 and 2023 to add 1.6 Bcf/d of incremental demand, assuming no significant delays in project scheduling. This list includes 29 new-build facilities (21 petrochemical, five steel and three fertilizer plants), six expansions (five petrochemical and one steel), and two plant restarts (both steel).
Supply Picture
Turning to natural gas supply fundamentals, production has been declining since the second quarter, as producers have scaled back drilling and completion in response to low prices and slack demand caused by the negative economic impacts of COVID-19. Drilling rig and frac spread counts have increased since their summer lows, but production output is forecast to average 86.0 Bcf/d this winter, which is quite a change from the 94.2 Bcf/d produced last winter.
Between August 2019 and August 2020, production in dry gas plays grew 200 million cubic feet a day while associated gas production from oil plays fell 2.6 Bcf/d across U.S. supply basins. A four- to six-month lag time is typical before reduced drilling and completion activity is reflected in the production numbers. August was approximately four months after the start of last spring’s well drilling/completion downturn, and gas production was clearly falling, even with shut-in wells mostly back on line by that point. As we move farther into the activity downturn, the production impact should become increasingly more apparent.
Permian Basin associated gas has accounted for a sizeable share of recent years’ growth in U.S. gas output. According to EIA data, for the first time in the basin’s long history, associated gas produced from oil wells accounted for the majority of total Permian gas output in 2018, surpassing the region’s nonassociated gas production. In 2019, the basin saw 30% annualized production growth, up 3.4 Bcf/d over 2018. The Permian is prolific and has the capacity to meet substantial future demand growth, especially with new pipeline takeaway capacity scheduled to debut in 2021.
At some point, Permian output is expected to bounce back and resume growth, but with low oil prices, gas production across the basin is predicted to decline to 10.5 Bcf/d after flowing at 12.5 Bcf/d last winter. Additional declines also will be seen in the Eagle Ford, SCOOP/STACK, Bakken, Gulf of Mexico and other oil-rich plays, further tightening the market.
Consequently, nonassociated gas production from dry gas plays will respond to higher price signals and be called upon to offset the losses in associated gas. Assuming natural gas prices remain relatively supportive, month-to-month dry production growth in the Appalachia Basin and Haynesville Shale should emerge in early 2021.
Taking it all into account, the bottom line is that, on balance, the key factors point toward upward pressure on prices compared with last winter. However, in addition to the usual uncertainties about the weather, this winter has wild cards that could definitively impact demand and pricing pressures in either direction in the months ahead. The COVID-19 pandemic has made economic forecasting as challenging as forecasting the weather, but NGSA’s annual analysis underscores the responsiveness and resiliency of natural gas supply, providing certainty to consumers as the heating season unfolds. In short, the fundamentals show the market works.
Editor’s Note: The preceding article was adapted from the Natural Gas Supply Association’s 20th annual Winter Outlook report, which was developed using research from Energy Ventures Analysis Inc., demand and supply projections from the U.S. Energy Information Administration, and economic projections from IHS Markit. The analysis is based on publicly reported data. NGSA does not project wholesale or retail market prices.

ORLANDO A. ALVAREZ is chairman of the Natural Gas Supply Association and head of BP’s North American gas marketing and trading business. Alvarez also is a member of BP America’s board of directors and BP’s global supply and trading organization’s executive leadership team. His tenure at BP spans more than 20 years with current accountability for North American trading, marketing, supply and derivatives activities, specifically pertaining to natural gas, power and natural gas liquids.
For other great articles about exploration, drilling, completions and production, subscribe to The American Oil & Gas Reporter and bookmark www.aogr.com.