


Natural Gas White Papers
Winter Gas Market Forecast Calls For Record Demand, Surging U.S. Production
By A. Scott Moore
WASHINGTON–U.S. natural gas consumption is expected to reach an all-time high this heating season–exceeding even the memorable “polar vortex” winter of 2013-14–thanks to colder temperatures that are forecast to return to more normal seasonal averages and increasing U.S. pipeline and liquefied natural gas exports. However, anticipated rising domestic production combined with robust storage inventories at the end of the fall refill season are anticipated to easily match the record demand level.
Compared with winter 2016-17, increases in demand also are forecast this winter in the power generation sector, primarily driven by growing natural gas-fired electricity capacity. Also contributing is a projected modest winter-over-winter increase in industrial demand as the result of new natural gas-intensive industrial projects and capacity expansions now coming on line. Overall, demand is expected to average 7.2 billion cubic feet a day more over the course of this winter than the previous winter, averaging 96.8 Bcf/d total.
While the Natural Gas Supply Association does not forecast prices, the association’s analysis using publicly available information on the weather, economy, consumer demand, production and storage indicates that generally flat pricing pressure is expected on the natural gas market this winter. That is in contrast with last winter, when unseasonably mild temperatures (12.5 percent warmer than normal) across major consuming regions put downward pressure on prices. In fact, with an average wholesale Henry Hub price of $3.01 per MMBtu, last heating season recorded the third-lowest average winter price in more than a decade.
TABLE 1
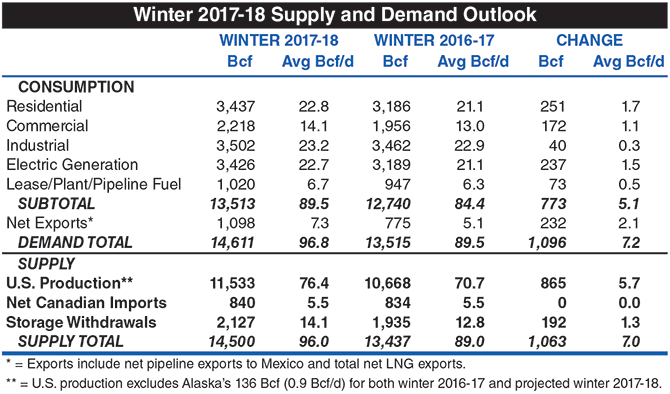
Courtesy of Energy Ventures Analysis Inc. using EVA and EIA data
Projected changes from last winter for each of the major components of consumption and supply are summarized in Table 1. At a glance, the natural gas market’s upward pricing pressure points for winter 2017-18 are significantly increased heating degree days resulting from more normal winter weather, increased volumes of exports via pipeline deliveries into Mexico and LNG shipments, and higher incremental demand in the electric generation and petrochemical sectors.
Two data points in the NGSA outlook have a neutral effect on prices: U.S. economic growth and natural gas storage. While most publicly available analyses predict the nation’s economy will continue strengthening overall, a forecast gross domestic product growth rate of 2.5 percent is similar enough to last winter’s 1.9 percent GDP that it translates to neutral pressure on prices compared with winter 2016-17. Although storage volumes were below year-ago levels at the end of the injection season, inventories are sufficient to have neutral pricing pressure heading into the heating season.
Turning to the final factor in the winter outlook equation, surging production is projected to increase supply, thus placing downward pressure on prices this winter. The forecast calls for a 7.0 Bcf/d increase in production this winter to an average of 96.0 Bcf/d, largely offsetting the projected 7.2 Bcf/d (96.8 Bcf/d) growth in demand.
It should be noted that all these projected pressure points are interrelated, and a deviation in one would impact the other assumptions in the equation. Clearly, some of the industry trends influencing the wintertime outlook transcend any short-term supply and demand scenario, and as always, there are possible “wild cards” that could affect either supply or demand, or perhaps even both. They include unexpected colder or warmer weather, or potential geopolitical events that could affect the economy.
Peak Winter Demand
Any discussion of wintertime demand must begin with the weather, which is the key determining factor of consumption patterns in the residential and commercial sectors during the heating season. Although growth in gas-fired power generation has created a second seasonal demand “peak” during the summer months when air conditioning usage boosts electricity demand, the predominant peak still occurs during the winter, driven by residential/commercial space heating (Figure 1).
FIGURE 1
Winter 2017-18 Projected Natural Gas Demand by Use/Sector
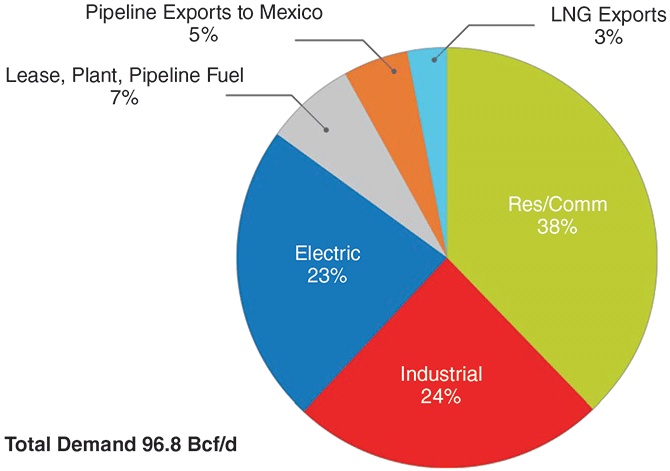
How important is weather to this year’s outlook projections? The residential and commercial sectors account for approximately 60 percent of the anticipated increase in demand this winter. In addition, another 34 percent of the net increase is attributed to heating-related demand in the electricity sector. The natural gas market has become more diversified with expanding exports and increased usage in industrial applications, but consumption remains highly sensitive to weather’s influence on residential and commercial usage.
Unfortunately, the greatest area of uncertainty in the market outlook is weather–the ultimate wild card–and projecting the net impacts of temperature variances on demand can be very challenging. Based on the National Oceanic & Atmospheric Administration long-range forecast, the continental United States is expected to experience a winter that will be 13 percent colder on average than last winter, and in line with historical trends (1 percent warmer than the 30-year average).
This is in stark contrast to last year’s five-month heating season, which NOAA data indicate was the sixth warmest on record. NOAA’s forecast divides the country into thirds, as shown in Figure 2. The northern-most tier, which stretches from western Pennsylvania to Oregon and Washington, is forecasted to be cold; the Northeast and middle band of the country is forecasted to be a little warmer than average; and the southern-most tier is projected to be much warmer than average.
FIGURE 2
National Oceanic & Atmospheric Administration Winter Forecast
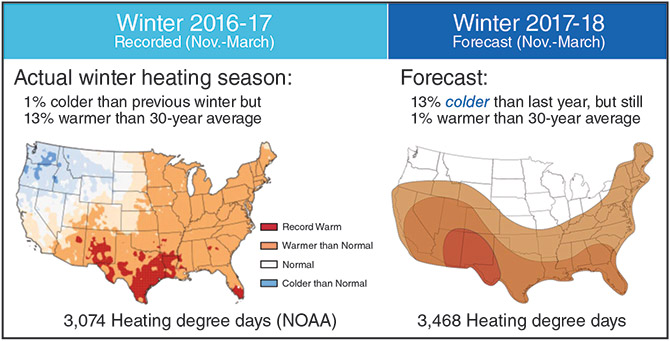
Using this regional forecast, total heating degree days are estimated to increase by 394 on a winter-over-winter basis, a significant (13 percent) increase from 3,074 heating degree days last year. From a percentage perspective, the NOAA forecast should result in an 8 percent increase in demand in the residential and commercial sectors. Total gas demand, excluding exports, is projected to be 5.1 Bcf/d (6.1 percent) greater than the winter of 2016-17.
Should winter weather turn out to be colder than the initial forecast, similar to 2014-15 (the sixth coldest winter in the past 20 years), demand could be 2.6 Bcf/d higher than projected. If this were to happen, storage inventories would likely still be adequate, but season-ending storage levels would be reduced to relatively low levels by the end of March. Alternatively, much-warmer-than-forecast temperatures would have the opposite result, reducing storage withdrawals about 2.8 Bcf/d and leading to higher, but not record high, end-of-season inventories.
Rising Export Volumes
One of the demand drivers this winter is a sector that literally did not exist two years ago: LNG exports. The first lower-48 LNG cargo departed U.S. shores near the end of the last heating season, during the midst of one of the warmest Februaries on record. By February 2018, there should be five liquefaction trains in operation: four at Cheniere Energy’s Sabine Pass facility in Louisiana, and one at Dominion Energy’s Cove Point facility in Maryland.
Over the balance of the five winter months, the United States is projected to export 3.1 Bcf/d of liquefied natural gas, which would be more than double the 1.5 Bcf/d exported last winter as Sabine Pass was starting up. With LNG imports at the Everett, Ma., regasification terminal on track to average 0.3 Bcf/d (about the same as last winter), net LNG exports are estimated at 2.8 Bcf/d. Although a historically significant shift, the amount of LNG to be exported still is projected to remain a small (3 percent) slice of overall demand.
However, that should be changing quickly. The U.S. Energy Information Administration predicts rapidly rising LNG volumes as more terminals commence operations, reaching 7 Bcf/d by 2019 and 9.3 Bcf/d by 2020. Cheniere Energy’s Corpus Christi facility in Texas, Sempra Energy’s Cameron LNG terminal in Louisiana, and Freeport LNG’s plant in Texas are all scheduled to commence operations in 2018, although generally not within a timeframe to impact the winter demand forecast.
While these projects, for the most part, are under long-term contract, the combination of these projects coming on line before contract start dates and commissioning cargoes, has resulted in the U.S. being very active in the global spot market for LNG. Nearly 200 LNG cargoes have been exported to date, with the most significant destination being Mexico, which accounted for 21 percent of all cargoes exported through the first nine months of 2017.
Net U.S. pipeline imports to Mexico also have been increasing, and are expected to continue this trend during the winter months. The two primary factors facilitating increased U.S. exports to Mexico are major expansions under way in the Mexican pipeline infrastructure, and increased supply output from the Eagle Ford Shale and Permian Basin plays, which is enabling Mexico to meet demand in its industrial sector and build gas-fired power generating units.
U.S.-to-Mexico net exports are expected to average 4.3 Bcf/d in 2017 and 5.0 Bcf/d in 2018, effectively doubling volumes from the 2013-14 time frame. Meanwhile, it is anticipated that net Canadian imports into the domestic market will average 5.5 Bcf/d this winter, essentially remaining the same as last year.
Industrial, Electricity Sectors
Demand in both the industrial and power generation sectors also has been on the rise in recent years. With the exceptions of a few years, there has been fairly steady growth in industrial sector demand since the recession of 2008-09. While a relatively small increase in industrial demand of 0.3 Bcf/d (1.2 percent) is forecast this winter, overall industrial demand for natural gas is setting records nevertheless. This winter’s growth is linked to the completion of major natural gas-intensive facilities and capacity expansions in the petrochemical and fertilizer industries.
From 2010 to 2016, a total of 57 new industrial projects or expansions to existing facilities were built, adding 2.2 Bcf/d in demand. New demand from these projects has been offset partially by declines in demand from existing industrial facilities, which has occurred because economic growth within the manufacturing sector has been limited in recent years.
However, another 61 new petrochemical, fertilizer, methanol, steel and gas-to-liquids facilities capacity expansion projects are expected to be completed by 2022 (25 projects with a combined 1.1 Bcf/d in demand were completed in 2017 alone). The total industrial capacity projected to be added between 2016 and 2022 represents 4.3 Bcf/d in demand.
In power generation, a steady winter-over-winter demand increase of 1.6 Bcf/d is projected primarily because of colder weather and new natural gas-fired electric capacity entering service. A total of 29.5 gigawatts of new natural gas-fired electric capacity has started up or is scheduled to enter service in 2017-18. More than 90 percent of that new capacity is in the form of highly-efficient and reliable combined-cycle gas turbines, with the remaining 7 percent represented by natural gas “peaking” plants that can quickly ramp up and down to backstop renewables.
This winter also is expected to mark 10 consecutive heating seasons during which some temporary, economically driven coal-to-gas switching has occurred. However, while coal-to-gas switching should continue this winter, it is estimated to fall by 9 percent compared with last winter because of modestly higher gas prices.
Surging Supply
A final factor impacting demand is the U.S. economy. IHS Markit projects that gross domestic product will expand by 2.5 percent this winter, with manufacturing growing 1.8 percent compared with last winter’s 0.5 percent. While these and other indicators generally reflect good news for the economy, the changes are not quite significant enough to add upward pressure on natural gas prices, although an unexpected upshift in GDP could change the direction of the arrow from pointing sideways to pointing higher.
FIGURE 3
Summary of Actual and Projected Winter Supply/Demand Components
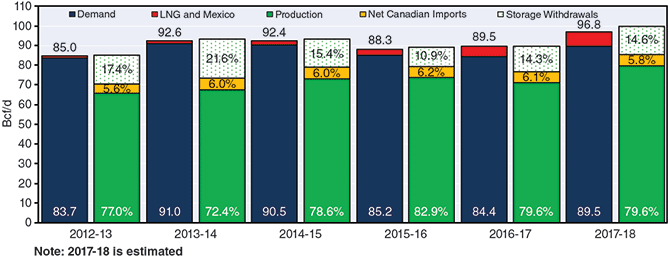
Courtesy of Energy Ventures Analysis Inc. using EVA, EIA and Point Logic data
Speaking of higher, Figure 3 shows the forecast for U.S. gas supply and demand compared with actual results over the past several winters. In addition to record demand this winter, the outlook calls for substantial growth on the supply side, with U.S. production topping the levels achieved during any of the five previous winters. Even with the expected increase in demand this year, production is estimated to account for 79.6 percent of total supply, identical to last winter.
During the winter months, domestic gas production is forecast to surge 5.7 Bcf/d–resuming a growth trend that was broken last winter, when falling production ended 10 consecutive years of increasing output between November and March. This higher production level is the result of substantially increased drilling activity through much of 2017 for both gas and oil (associated gas) in onshore resource plays. Offshore gas production is anticipated to be lower than last winter.
Within the seven major shale producing areas, there is no uniform trend. For instance, gas output from the Permian Basin, Marcellus/Utica and Haynesville is growing (the Haynesville reversed a multiyear production decline trend in early 2017), Eagle Ford production has been relatively flat, and Barnett and Fayetteville outputs are trending downward. The Permian continues to stand out, however. This winter, the basin is estimated to add 1.3 Bcf/d of incremental supply from the Wolfcamp, Bone Spring and Spraberry plays compared with the previous winter, or nearly 25 percent of the total expected increase in U.S. production.
For the week of Nov. 10, EIA reported the first inventory withdrawal of the heating season, totaling 18 Bcf and leaving 3.77 trillion cubic feet of natural gas in storage. That amount was 6.7 percent lower than the same week in 2016 (4.04 Tcf), and 2.6 percent below the five-year historical average (3.87 Tcf). Even with new demand highs forecast for this winter, the projected supply growth from onshore shale plays should be ample to meet market requirements, with storage volumes providing further responsiveness and flexibility to meet any higher-than-anticipated demand scenarios.

A. SCOTT MOORE is chairman of the board of the Natural Gas Supply Association and senior vice president of midstream and marketing at Anadarko Petroleum Corp. With 32 years' industry experience in marketing, trading, logistics, commodity derivatives, economics, risk management, LNG, commercial litigation, project finance and engineering, Moore manages Anadarko’s U.S. and international natural gas, crude oil and natural gas liquids marketing efforts as well as commodity derivatives and market fundamentals. He is chairman of the board of Coloradans for Responsible Energy Development and serves on the board of directors of the Denver Metropolitan Chamber of Commerce. He is a director and past chairman of the Colorado Oil & Gas Association. Moore holds a B.S. in chemical engineering from the University of Colorado and an M.S. in mineral economics from the Colorado School of Mines.
For other great articles about exploration, drilling, completions and production, subscribe to The American Oil & Gas Reporter and bookmark www.aogr.com.