


Natural Gas Outlook
Wintertime Forecast Calls For New Records In Production And Demand
By Donald “Blue” Jenkins
WASHINGTON–Last winter packed a few surprises, most notably a cold snap across much of the country as 2018 began that resulted in record single-day natural gas consumption of 151 billion cubic feet on New Year’s Day. This winter, the Natural Gas Supply Association’s annual Winter Outlook projects that U.S. gas demand will establish a new record, averaging more than 100 Bcf/d for the first time and topping the demand levels reached during even the polar vortex winter of 2013-14.
In total, the Winter Outlook forecasts demand to grow by 3.4 Bcf/d over last winter, to 102.7 Bcf/d. The growth is propelled by expanding export volumes and increased usage in the industrial and electric generation sectors. However, even with consumption climbing to an historic high point this winter and start-of-heating-season storage inventories at their lowest point in more than a decade, supply is expected to be sufficient to meet market requirements thanks to domestic production also surging to all-time highs.
The shale revolution has ushered in a remarkable era, as evidenced by dramatic growth in production over the past 10 years. As of August, U.S. production had reached 81.9 Bcf/d and should continue to push upward to 85.5 Bcf/d by the end of the winter, achieving 10 percent winter-over-winter growth. Drilling efficiencies continue to keep production flowing and new pipeline infrastructure is bringing it to customers.
The increased production has been split between dry gas and associated gas. From August 2017 to August 2018, total dry gas production jumped by 4.6 Bcf/d, led by the Haynesville Shale, the Marcellus dry gas play, and the Utica Shale. The Marcellus wet gas play, the Permian Basin and the SCOOP/STACK plays in Oklahoma accounted for the vast majority of the 4.4 Bcf/d rise in associated gas output.
Looking at all the variables in NGSA’s Outlook, the picture that emerges for the upcoming winter is of a natural gas market experiencing substantial growth in both demand and supply. Record demand will be driven by the longer-term shift to natural gas in the electric and industrial sectors resulting from natural gas’ competitive prices and environmental benefits.
Last winter, prices at the Henry Hub averaged $2.99 per MMBtu. In mid-November, Henry Hub natural gas futures for December and January were trading above $4.00/MMBtu range on the New York Mercantile Exchange, although April and May 2019 futures prices were ranging between $2.75-$2.85/MMBtu. The National Oceanic & Atmospheric Administration forecasts winter weather to be near-normal to slightly warmer than normal (1 percent warmer than last winter and 2 percent warmer than the 30-year average).
Industrial, Power Sectors
Looking at the Winter Outlook’s consuming sectors, demand levels in both industrial and power generation are expected to set new records, although increasing only about 2 percent compared with last winter. Industrial demand has been robust this year, growing by 1.2 Bcf/d through the first nine months. While some of this growth can be attributed to below-normal temperatures from January to April, NGSA says the rest is structural growth, which should continue. Industrial demand is forecast to grow by 0.45 Bcf/d over last winter to average 24.5 Bcf/d.
Healthier activity in energy-intensive industries has provided a solid base for industrial sector demand, and new facilities also are contributing to the growth. The sectors’ performance, as measured by the U.S. Federal Reserve’s production indices, as well as industrial capacity utilization, have been stronger than in either 2016 or 2017.
FIGURE 1
New U.S. Industrial Projects and Natural Gas Demand
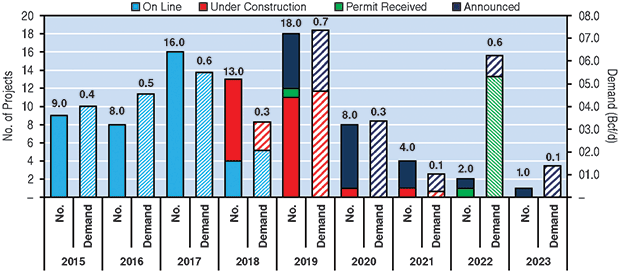
Note: 33 new projects in 2015-17 with 1.5 Bcf in new demand; 46 new projects in 2018-23 with 2.1 Bcf in new demand.
Source: Energy Ventures Analysis
New projects have come on line in 2018 to boost demand, and even more new builds and capacity expansions are scheduled to start up in 2019. Notably, Yara and BASF started a new ammonia plant in Freeport, Tx., in April that is expected to consume 60 MMcf-70 MMcf a day when running at full capacity. Also, OCI and G2X Energy’s NatGasoline methanol plant in Beaumont, Tx., began operations at the end of June with 163 MMcf/d of nameplate capacity.
Besides fertilizer and methanol plants, new ethylene, propylene and polyethylene facilities also are boosting natural gas and natural gas liquids demand this winter. Increased NGL production is leading to more NGL exports, and being absorbed by new domestic facilities that turn that feedstock into downstream products.
As shown in Figure 1, taken from the NGSA Winter Outlook, a total of 33 projects with 1.5 Bcf/d in combined demand and a total investment of $53 billion entered service between 2015 and 2017. From 2018 to 2023, another 46 projects representing 2.1 Bcf/d and a total investment of $79 billion are expected to come on line. In 2019, 18 projects with 700 MMcf/d of demand have been permitted, announced or are under construction. Most of these projects are located in Texas and Louisiana.
The Winter Outlook forecasts that power demand for natural gas will increase by 0.7 Bcf/d this winter compared with winter 2017-18, averaging 24.8 Bcf/d (Figure 2). This may seem relatively low in comparison with the 3 Bcf/d of year-to-year growth in power sector demand experienced last summer, but reflects the fact that heating degree days are expected to be slightly lower this winter, reducing electric heating demand. Also, fundamentals should place slightly upward pressure on Henry Hub prices this winter, discouraging coal-to-gas switching.
FIGURE 2
Electric Generation Sector Winter Demand for Natural Gas
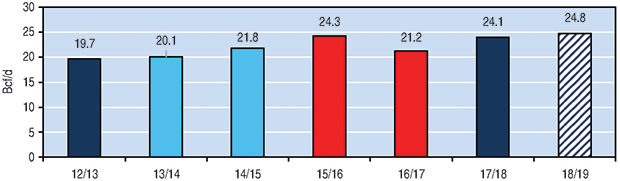
Note: Light blue represents cold winter; red represents warm winter.
Source: Energy Ventures Analysis
Another factor is the new combined cycle gas turbine capacity additions in the East region, which are more efficient and consume less gas than older turbines in the existing fleet. That should create gas-on-gas competition, displacing generation from less efficient units. Last but not least, continued gains in wind, solar and renewable capacity will also limit growth in gas burn and continue to compete for market share.
According to the Outlook, power demand will grow the most in the East and South Central regions, where more than 10 gigawatts of coal capacity has been retired since last winter. The Pacific region is expected to see some declines in power burn related to the retirement of 2.3 gigawatts of gas generation capacity since the beginning of last winter.
LNG, Pipeline Exports
Meantime, the Outlook says LNG exports and pipeline exports to Mexico should experience major growth of 57 percent–contributing more than any other sector to increased winter-over-winter demand–and bring the environmental benefits of low carbon emissions to overseas customers while providing jobs, economic benefits and stability to the U.S. market.
Demand for U.S. LNG exports is forecast to average 4.7 Bcf/d (Figure 3) this winter. Three new LNG trains–Elba Island phase one, Corpus Christi train one, and Sabine Pass train five–are scheduled to come on line this winter, translating into 1.7 Bcf/d in new demand for LNG exports to the 3 Bcf/d averaged last winter.
FIGURE 3
U.S. LNG Export Capacity by Project
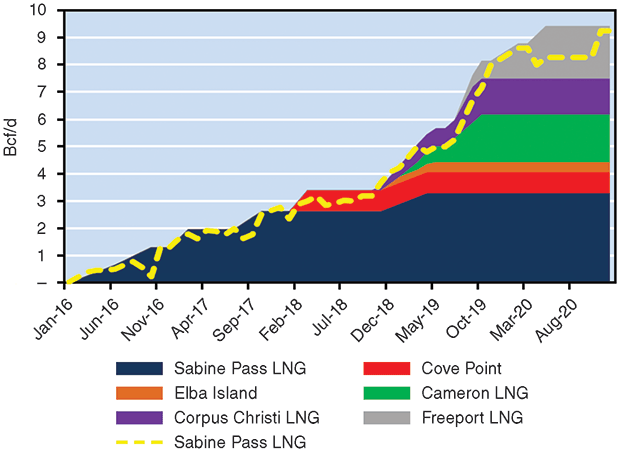
Source: Energy Ventures Analysis
The new trains have contracts with utilities in Spain, the United Kingdom and portfolio traders, indicating that some of the cargoes could land in Europe. This past June, Rough Storage, a facility that provided 70 percent of total U.K. gas storage capacity, closed after 30 years of operations. The closure means the United Kingdom now has about five days’ worth of storage capacity instead of 15, which could cause prices to spike during the winter months, attracting U.S. cargoes.
However, the majority of U.S. LNG cargoes still are expected to head to Asia, the destination for 60 percent of all U.S. cargoes shipped last winter. The global LNG market was tight in 2018, as a global supply glut caused by the newly commissioned U.S. and Australian trains was absorbed quickly by demand growth, especially in China. Three new regasification terminals came on line in August and October in China, further boosting demand projections for this winter. LNG demand also is poised to take off in India, where demand was already reportedly 20 percent higher in the first half of 2018, before two new large regas terminals were completed and commissioned.
U.S. LNG exports to Mexico remain high. Mexico’s domestic gas production stabilized this year, but shows no signs of recovering to pre-2017 levels. Growing demand in Mexico is requiring more imports in the form of either LNG or pipeline shipments. Pipeline imports already have pushed above 5 Bcf/d thanks to new pipelines that came on line this summer, and U.S. pipeline exports to Mexico are forecast to grow by 0.8 Bcf/d this winter compared with last. By 2020, pipeline exports to Mexico are estimated to reach 6.1 Bcf/d.
As more pipelines are completed to reach markets across Mexico, it is likely that LNG imports to Mexico will be partially displaced. TransCanada’s Sur de Texas-Tuxapan pipeline will bring gas from South Texas to Tuxapan, where demand previously has been served by LNG imports at Altamira on the eastern coast. Once this 2.6 Bcf/d pipeline enters service, LNG imports to Mexico are expected to drop. The La Laguna-Aguascalientes pipeline will ship gas from La Laguna to Central Mexico, completing the supply route all the way from the Permian Basin.
Residential and commercial are the only sectors not forecast by NGSA to increase consumption this winter. Of course, in both sectors, demand is highly dependent on weather, following an almost perfect linear relationship with total heating degree days. Assuming NOAA’s forecast of slightly warmer temperatures, combined residential and commercial demand is estimated to average 36.9 Bcf/d, or about 1 Bcf/d less than winter 2017-18.
However, it should be noted that consumption in these sectors could vary between 32 Bcf/d to 41 Bcf/d depending on actual weather conditions. In other words, colder or milder weather than forecast could swing total winter storage withdrawals significantly on the order of 600 Bcf.
Gas Supply, Storage
Given that associated gas (excluding the Marcellus wet play) accounts for more than one-third of total U.S. production, price fluctuations in the crude and NGL markets will impact total U.S. gas production over the medium to longer terms. As oil prices picked up this year, associated gas production also grew.
Even though the Permian has far and away been the most active drilling region over the past several years, the Marcellus and Utica plays in the Appalachian Basin continue to drive record U.S. production output (Figure 4). One of the reasons why the Permian has not contributed more to overall production growth is that Permian wells have lower initial gas production rates compared with Northeast wells. In fact, one Northeast well has the equivalent gas IP of three Permian wells. Also, the increasing number of drilled but uncompleted wells in the Permian could translate into 6 Bcf/d of new production over time as regional pipeline capacity becomes available.
FIGURE 4
U.S. Production Trends by Play (Aug. 2017-Aug. 2018)
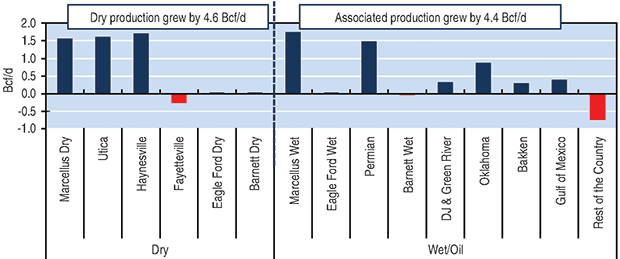
Sources: PointLogic, Energy Ventures Analysis
In a sense, the Permian has become the new Northeast in terms of pipeline proposals, with the obvious difference being that Permian infrastructure development is focused on crude oil versus dry gas and NGLs. However, large gas pipeline projects should start coming on line in the second half of 2019, enabling Permian output to grow to 11 Bcf/d by the end of 2020. Given the low break-even prices of Permian crude, the relatively friendly environment in Texas to build petroleum and natural gas infrastructure, as well as the high DUC inventories, there appear to be few risks to Permian production growth.
Overall, NGSA forecasts that U.S. production will grow by 7.4 Bcf/d this winter compared with last, getting as high as 85.5 Bcf/d by spring. Thanks to a number of pipeline capacity projects that are enabling production to ramp up–Rover Phase II, Atlantic Sunrise, Nexus, Xpress, etc.–Marcellus/Utica output is expected to jump by 3 Bcf/d. Soaring production will ably satisfy demand, likely resulting in flat pressure on prices compared with last winter.
The rapid increase in domestic production and the ongoing build-out of pipeline take-away capacity not only decrease the need to import supplies (net Canadian imports are projected to decline by 2 MMcf/d to 5.2 Bcf/d this winter), but also the need to withdraw as much gas from storage during the winter months. Domestic production is expected to satisfy some 80 percent of daily demand, with the remainder supplied primarily by storage withdrawals.
Injection season ended with the lowest amount of gas in storage since 2005 (14 percent below the five-year average), and inventories are projected to end the winter heating season at 1.43 Tcf, or 200 Bcf lower than the five-year average. However, the combination of production growth and pipeline capacity additions increases deliverability and flexibility, effectively replacing part of the need for storage withdrawals to meet demand fluctuations. Historically, 16 percent of winter supply comes from storage, on average.
Looking at expectations for winter 2018-19, the important take-away is the strength and responsiveness of natural gas supply. When one takes into account the expectation for tremendous production, the industry is well-positioned to meet record demand.
Editor’s Note: The preceding article is based largely on information presented in a report prepared for the Natural Gas Supply Association by Henan Xu and Michael Schaal at Energy Ventures Analysis. An overview of that report, and an executive summary of NGSA’s 18th annual “Winter Outlook for Natural Gas,” are available at www.ngsa.org.

DONALD “BLUE” JENKINS is executive vice president, commercial, business development, information technology and safety at EQT Corporation, and vice chairman, Natural Gas Supply Association. With more than 18 years of industry experience, he joined EQT in 2012 as senior vice president of trading and origination, overseeing commercial natural gas operations, commodity trading and asset optimization. Jenkins held various senior management positions on BP’s North American gas and power leadership team prior to joining EQT. He holds a B.S. in accounting from Brigham Young University and an M.B.A. from Northwestern University.
For other great articles about exploration, drilling, completions and production, subscribe to The American Oil & Gas Reporter and bookmark www.aogr.com.