


Barnett Shale Case Study
Advanced Quadrapole Sonic And Borehole Imaging Optimize Shale Well Placement
By John Spaid, Jeff Dahl, Susana Gutierrez Carrilero, Eric Shearer, Glenn Carpenter and Dan Buller
OKLAHOMA CITY–Horizontal completions within a complex oil condensate window of the Barnett Shale have proven challenging because of problematic well placement within an optimum reservoir section, and because of the vertical and mechanical proximity to mobile water in the Viola Limestone. Accurate formation properties along the horizontal well are required to identify both conditions.
An integrated interpretation of all sensor data was used to first confirm stratigraphic placement, and then to evaluate effective porosity, anisotropic closure stress, geologic texture, and natural fracture distribution along the horizontal well. A re-evaluation was performed on the combined petrophysical data, including an advanced LWD logging suite consisting of electromagnetic azimuthal resistivity, neutron, azimuthal density, laterolog resistivity imager, and quadrapole sonic.
Combined with production data, recommendations were made for future wells in the area to optimize placement in the reservoir and to prevent water production from the Viola Limestone.
Closure stress and best possible total organic content, mineralogy, and porosity distributions were calibrated to vertical pilot-hole logs and full core properties. Fracture and cluster stages then were selected to target similar rock and the lowest closure stress along the well, while attempting to avoid initiating new fractures into existing natural fractures, as determined from the image log.
Fracture stage placement data, chemically traced production flow, and a flowing temperature log were used to interpret well flow versus the actual perforation cluster positions.
This article presents conclusions regarding both the engineering evaluation criteria used to fracture the well, and the geologic-based texture and fracture interpretation that explains the ultimate well performance. A new, automatic staging and cluster placement software solution was employed to utilize insight gained from the case study well to better plan future horizontal completions in the field.
Barnett Geology
Located in the Bend Arch-Fort Worth Basin of North Texas and spanning an area of approximately 5,000 square miles, it has been suggested the Barnett Shale has the largest producible reserves of any onshore natural gas field in the United States, with an estimated 2.5 trillion cubic feet of recoverable natural gas reserves and 30.0 Tcf of natural gas in place.
FIGURE 1
Stratigraphic Correlation of Horizontal Well
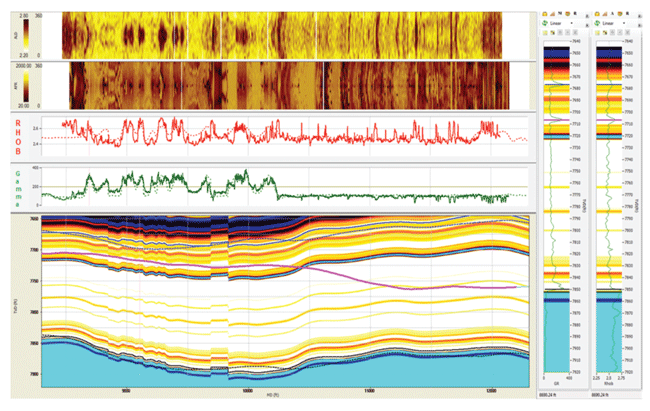
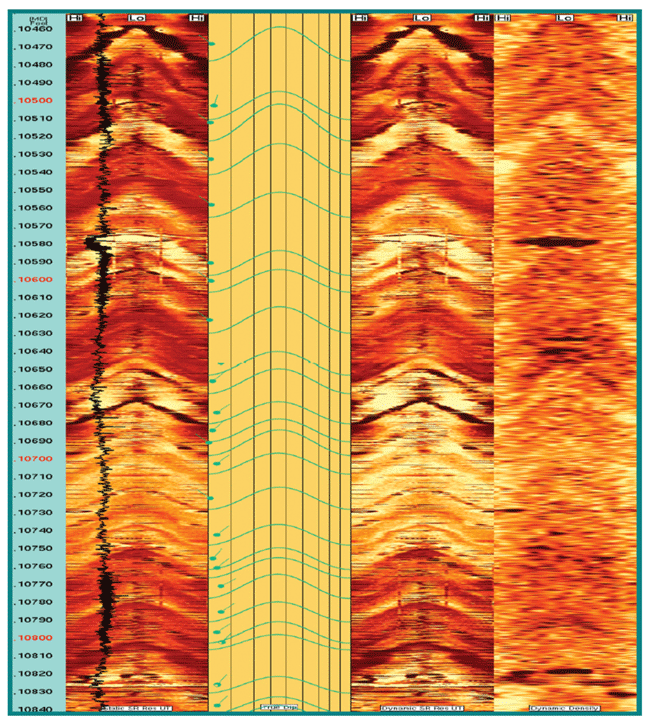
FIGURE 2
Borehole Imaging Software Example
From Horizontal Well Illustrating Dip
Magnitude
and Direction in Second Track
Composed primarily of sedimentary rocks dating from the Mississippian period, the Barnett Shale is classified as a tight gas reservoir, and is known for being highly impermeable. The Lower Barnett Shale is located stratigraphically between the Forestburg and the Viola limestones. The case study horizontal well was drilled inside the Lower Barnett above the Viola Limestone (Ordovician).
As understanding of the geology of unconventional resource plays such as the Barnett has evolved, it has become widely accepted that there is a large distribution of well productivity within the play. Development costs often are higher for unconventional resources than for conventional fields because of the need for close well spacing, horizontal drilling, and hydraulic fracturing. In addition, production decline rates are greater, relative to many conventional plays.
As a testing ground for new technologies, virtually all the wells drilled in the Barnett have been hydraulically fractured, using various approaches that have evolved throughout the past two decades. Although drilling was accomplished initially with vertical wells, horizontal drilling and multistage hydraulic fracturing have led to a dramatic improvement in hydrocarbon recovery–and ultimately the economics–by making it easier to extract gas from underdeveloped areas.
Horizontal drilling has become the prominent method for drilling wells in this area. In fact, it is virtually the exclusive drilling method used in the Barnett, with horizontal sections ranging from 1,500 to 4,500 feet. Devon Energy Corp. alone has drilled more than 1,450 horizontals in the Barnett.
Stratigraphic Placement
To confirm the stratigraphic placement of the horizontal case-study well, a correlation was conducted based on gamma, resistivity, and density data acquired from wireline logs run on a nearby offset vertical well, in addition to density and laterolog resistivity images obtained while drilling the horizontal well.
Figure 1 shows the correlation of the horizontal well. The top two tracks display the images acquired using logging-while-drilling tools, with the first track illustrating the density and the second track illustrating the laterolog resistivity. Because this is a horizontal well, the images convey the bottom of the well in the center of the image.
From the images acquired, the dip magnitude and direction can be inferred with the help of imaging software for wellbore placement (Figure 2). The third and fourth tracks from the top in Figure 1 represent the density and gamma data, respectively, in which the dashed lines correspond to the predicted data, and the solid lines illustrate the actual data.
Figure 1 illustrates that the predicted and actual data from the third and fourth tracks show good correlation. The pink line represented in the fifth track outlines the well trajectory inside the Lower Barnett Shale. The two tracks shown on the right display the gamma and density data obtained from the offset vertical well. The horizontal well was drilled above the Viola Limestone, which has been known to contain mobile water. The Viola Limestone is represented in light blue.
Petrophysical Data Evaluation
Because the case-study well lies outside the normal productive Barnett trend, full wireline and LWD quad-combo data were acquired. To better understand well performance, it was necessary to evaluate the petrophysical data from the vertical offset and horizontal wells. Figure 3 illustrates the evaluation of wireline data acquired from the vertical offset well.
FIGURE 3
Fluid Volume, Mineral Evaluation and
Rock Mechanical Properties of Offset Vertical Well
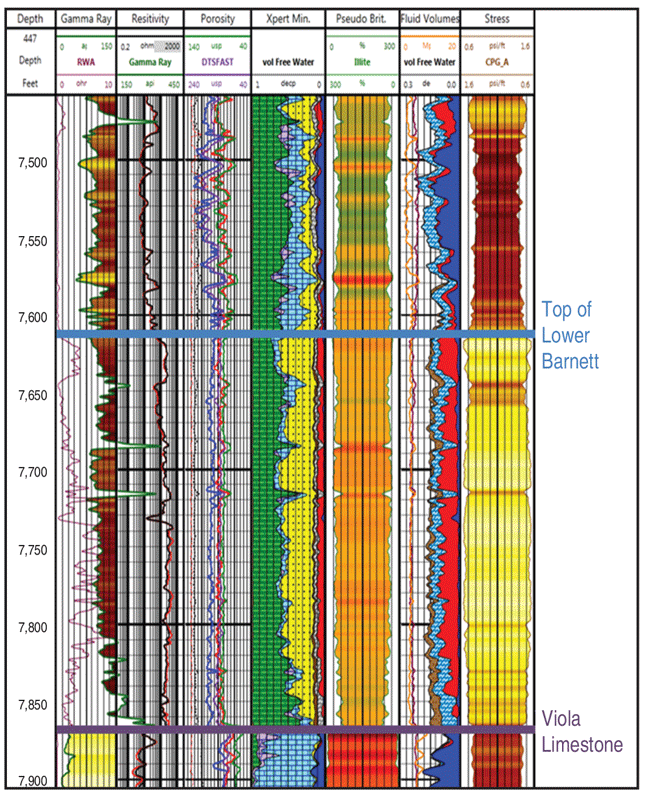
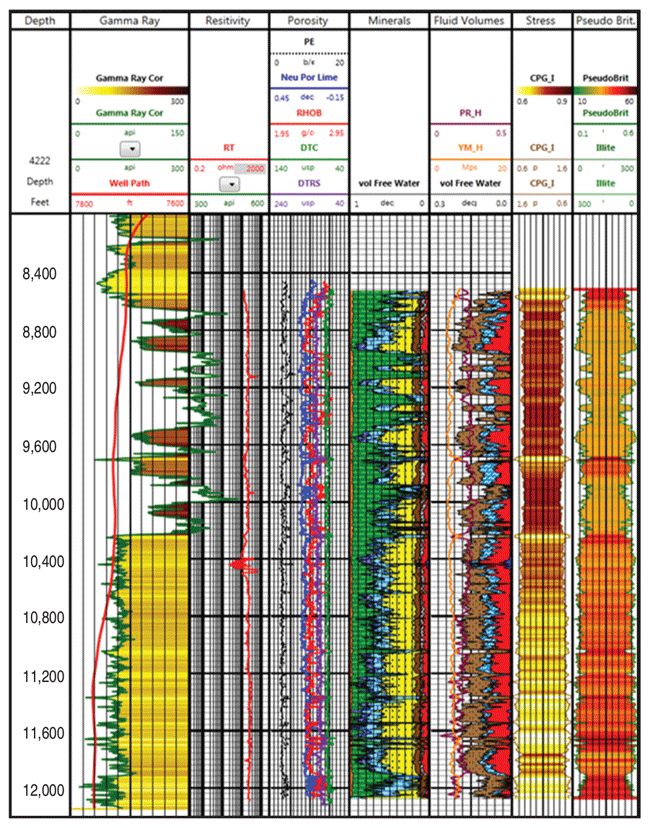
FIGURE 4
Fluid Volume, Mineral Evaluation and
Rock Mechanical Properties of Horizontal Well
Track 1 in Figure 3 is depth, track 2 represents the gamma and apparent water resistivity from the offset well, and track 3 illustrates resistivity. Track 4 details the density, neutron, and sonic data acquired using wireline tools. Track 5 shows the petrophysical evaluation of mineralogy and fluid volumes, and track 6 represents the brittleness calculated from Poisson’s ratio and Young’s modulus, taken from the sonic and density data. Track 7 also provides information on the fluid volumes taken from track 5, including Young’s modulus and Poisson’s ratio. Finally, the closure pressure gradient profile is represented in track 8.
Closure stress as well as kerogen, mineralogy, and porosity distributions were calibrated to the vertical pilot-hole logs and full core properties.
The horizontal well was drilled between 7,700 and 7,750 feet true vertical depth from the offset well. In that area and close by, a higher stress zone was observed at approximately 7,710 and 7,800 feet TVD. Models demonstrate that these two zones restrict the height of the fracture.
Hydraulic fracture simulator modeling performed at two depths indicated that the zones located at 7,710 and 7,800 feet TVD were fracture barriers. The results from the model indicated that the water-bearing Viola Limestone would never be fractured from the horizontal well.
After the petrophysical evaluation of the vertical offset well, the same evaluation was performed on the horizontal well with the acquired LWD data (Figure 4).
Track 1 in Figure 4 is depth, track 2 represents the gamma and well path, and track 3 shows the true resistivity. Track 4 outlines the density, neutron, and sonic data acquired with the LWD tools. Track 5 illustrates the petrophysical evaluation of the mineralogy and fluid volumes, while track 6 details the fluid volumes from track 5 and includes Young’s modulus and Poisson’s ratio. Track 7 shows the closure pressure gradient profile, and track 8 represents the brittleness calculated from Poisson’s ratio and Young’s modulus using the sonic and density data acquired by the LWD tools.
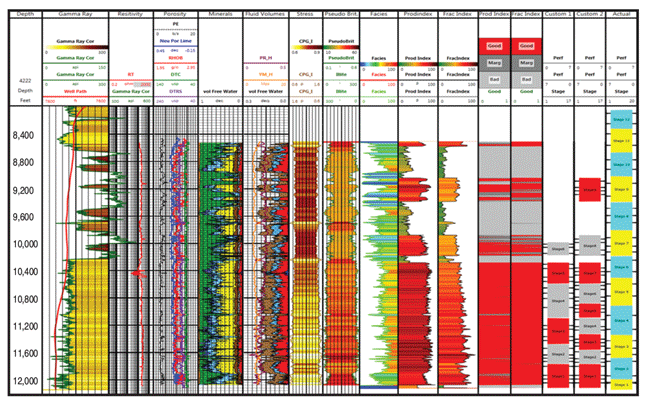
FIGURE 5
Engineering Stage and Cluster Design Application
The output data of the petrophysical evaluations from both the vertical and horizontal wells were used in a proprietary software package.
Stage And Cluster Design
The proprietary software tool used to select perforation clusters and fracture stage locations was applied to this horizontal well, and was designed to create a more consistent fracturing operation by eliminating fracturing of nonproductive rock, providing consistent breakdown and treating pressures, and preventing screen-out or “go-to-flush” early instances, thereby increasing production and reducing fracture-treating costs.
The facies illustrated in track 9 of Figure 5 are based on a ternary plot that displays the worst facies in the top corner, the best facies in the bottom left corner, and the secondary facies in the bottom right corner. Facies can be customized, depending on the unconventional resource; each corner can contain up to three minerals (e.g., total clay could be a combination of montmorillonite, illite, and kaolinite). The results of the facies ternary plot are rescaled automatically from 0 to 100 percent (track 9 in Figure 5).
Staging software calculates both a production and a fracture index, which are combined to optimize stage and cluster placement. The production index uses individually-weighted criteria such as facies quality, effective porosity, and brittleness to quantify the differences in reservoir character. Likewise, the fracture index uses weighted criteria such as the closure stress, natural fracture index, and cement bond index to highlight areas of differing mechanical properties or mechanical risk.
Additional variables may be used, including permeability, natural fracture density, or hazard curve, based on proximity to major fractures that potentially could communicate with the water-bearing Viola Limestone.
The software is used typically to supply two custom designs versus a geometric or client-supplied design. One of the two custom designs typically is optimized for the absolute best rock and least pressure differential between clusters (track 14 of Figure 5).
The second custom design goal is to achieve more stages in marginal rock that can tolerate a slightly higher stress differential between clusters (track 15). Track 16 of Figure 5 shows the actual design performed after the well was drilled. These three designs were compared and plotted to net stress and treating pressure differences between clusters in individual stages.
After the well was completed, a production water tracer and a flowing temperature log were used to interpret well flow versus the actual perforation cluster positions.
Image Analysis
Fractures were identified and quantified along the horizontal wellbore. An example from stage 10 of the borehole imaging software is illustrated in Figure 6.
FIGURE 6
Borehole Imaging Software Example Illustrating Fault
Strike and Dip Along Stage 10 in Second Track
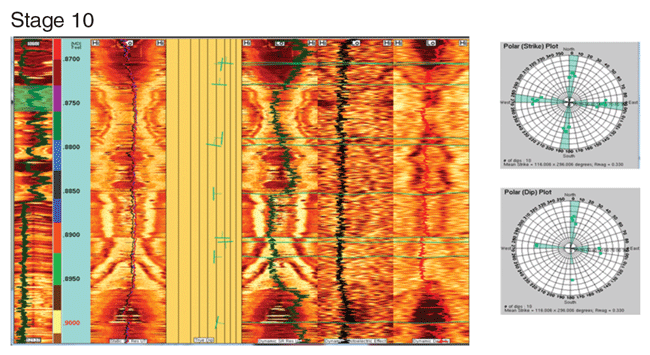
From stage 11 to 6, there was a good correlation between faults and fractures greater than 45 degrees in dip magnitude, compared with water tracer data. However, below stage 6, no relationship could be determined to explain the water production related to fractures. Although numerous fractures are observed on the image log, no single fracture or group of fractures below stage 6 could be singled out for contributing to water production.
The engineering staging software was written after the lateral well had been completed. Post-well analysis using this software would have eliminated the major stages contributing to water production. The LWD laterolog resistivity imaging tool was necessary to identify the natural fractures and faults along the horizontal wellbore.
Editor’s Note: This article was adapted from a paper prepared for the Society of Petrophysicists & Well Log Analysts’ 56th annual logging symposium, held July 18-22 in Long Beach, Ca. The authors thank Halliburton’s Jeremy Murillo and Jessica Mitchell, as well as TekSpert Consulting’s Kristie Landwair for their input and assistance.
JOHN SPAID has worked for Devon Energy for the past 12 years, and is coordinating the reservoir characterization for Devon’s integrated reservoir characterization projects. His previous work for Devon has been in the Eagle Ford Shale, Barnett Shale, Woodford Shale in western Oklahoma, and the Granite Wash in the Texas Panhandle and western Oklahoma. Previously, Spaid spent 18 years with Marathon Oil and five years with Petro-Hunt LLC. He earned a B.S. in geology from James Madison University and an M.S. in geology from Southern Methodist University.
JEFF DAHL is a senior completion engineering adviser for Devon Energy, and has more than 30 years of experience in engineering positions for large and small operators, research and development, global business development, and U.S. field engineering operations for a major service company. Areas of expertise include hydraulic fracturing, artificial lift, waterflooding, conformance control, and sand control. Dahl received a B.S. in civil engineering from the University of Illinois-Urbana/Champaign, and studied for an M.S. in petroleum engineering at the University of Oklahoma. He holds eight U.S. patents and three Canadian patents.
SUSANA GUTIERREZ CARRILERO serves as a senior LWD technical adviser for Halliburton Sperry Drilling in Denver. In her 10 years with Halliburton, she also has worked as an LWD engineer in West Africa and a geosteering specialist in the United States, Mexico and Europe. Prior to her time with Halliburton, Carrilero worked as an LWD engineer in Norway and West Africa for Schlumberger. She earned her master’s in civil engineering from Polytechnic University of Catalonia based in Barcelona, Spain.
ERIC SHEARER is technical sales manager of LWD and drilling systems in North America for Halliburton Sperry Drilling. In 18 years with the company, Shearer has worked as an LWD field engineer, office-based log analyst, LWD coordinator, and operations manager. He has worked on exploration and development wells in Alaska, the Gulf of Mexico, West Africa, the North Sea, and Continental Europe. Shearer completed a B.S. in geology from New Mexico Institute of Mining and Technology.
GLENN CARPENTER is a senior petrophysicist for Halliburton. After earning an M.S. in geology and experimental statistics from Louisiana State University in 1966, Carpenter worked for 11 years as a geologist for Union Oil Company of California, after which he ran his own consulting company, Atchafalaya Exploration, for 13 years. He has spent nearly 24 years working as a geologist.
DAN BULLER is a senior global adviser for unconventional optimization in Halliburton’s Formation and Reservoir Solutions Group. He has 33 years of industry experience in petrophysical interpretation of, and completion applications in, low-permeability clastics, shales and complex carbonates. Buller earned a B.S. in physics and math from Nebraska Wesleyan University, and an M.S. in physics from Kansas State University.
For other great articles about exploration, drilling, completions and production, subscribe to The American Oil & Gas Reporter and bookmark www.aogr.com.