


Breakthrough Technology Uses Pressure Monitoring To Diagnose Cluster Efficiency
By Kyle Haustveit, Wolfgang Deeg, Brendan Elliott and Jackson Haffener
OKLAHOMA CITY–Any number of factors can cause geologic and geomechanical characteristics to vary along the length of a lateral, including landing variations, structural changes, depletion impacts and intrawell stress shadowing. These variations have the potential to impact fluid distribution in multicluster hydraulic fracturing treatments, with direct consequences to the drainage pattern and, ultimately, field development economics. Given the lack of affordable, scalable diagnostic solutions to monitor cluster efficiency, most wells are completed using geometric cluster spacing and the same pump schedule even when laterals have known variations.
Engineers at Devon Energy Corp. have developed a breakthrough pressure monitoring technique that uses an offset “sealed” wellbore as a monitoring source to quantify cluster efficiencies in real time. To date, more than 3,000 stages have been monitored in every major U.S. basin using patent-pending sealed wellbore pressure monitoring (SWPM). It represents a new and low-cost, nonintrusive method of evaluating and quantifying fracture growth rates and fracture-driven interactions during stimulation using only a surface pressure gauge on the monitor well.
This simple technique provides insights into a range of characteristics. It can improve the understanding of hydraulic fractures by determining qualitative cluster efficiency/fluid distribution, fracture complexity, fracture counts in the far-field reservoir, and fracture heights and half-lengths. Importantly, SWPM provides rapid insights into the effects of completion-design changes such as using extreme limited-entry perforating. It also can be used to identify and mitigate depletion issues, calibrate stimulation models, and estimate closure times.
Closed System
The technology has been validated with low-frequency distributed acoustic sensing (DAS) strain monitoring, microseismic monitoring, video-based downhole perforation imaging, and production logging data in multiple plays and basins.
SWPM necessitates using a well that acts as a closed system. In other words, it cannot be connected by perforations to the formation being stimulated in the offset well. The casing must be sealed, but uncompleted or existing wells can be used for monitoring as long as the shallowest perforations are isolated from the targeted formation. For an existing producing well, a plug is set above the shallowest perforations to create a closed system from the top of the plug to the surface where pressure measurements are recorded.
The wellbore is filled with low-compressibility fluid (e.g., completion brine) to amplify the pressure response created during monitoring. Fractures intersecting the sealed wellbore cause local deformations, resulting in a small reduction in the fluid volume inside the casing which, in turn, generates a discernable and distinct pressure response. Multiple sealed wellbores can be used to monitor a single treatment well to allow for a more detailed understanding of fracture growth. The entire sealed wellbore acts equally for pressure monitoring and is not biased by large fluctuations in pressure magnitudes. Pressure magnitudes generated in a sealed wellbore range from less than 1 psi to more than 10 psi (but normally less than 100 psi).
The field execution of SWPM is simple and does not require any tools to enter the wellbore. A surface pressure gauge (or downhole gauge) provides the necessary data needed to evaluate fracture interactions with the monitor wellbore. There is no need to alter zipper operations as long as there are available sealed wellbores to use as monitor wells. SWPM’s main restriction to operations is the necessity to leave new wellbores sealed by not opening toe sleeves or shooting perforations for any stage until monitoring of offset treatment wells is completed.
FIGURE 1
DAS Cross-Well Strain, Treatment Data and SWPM Responses
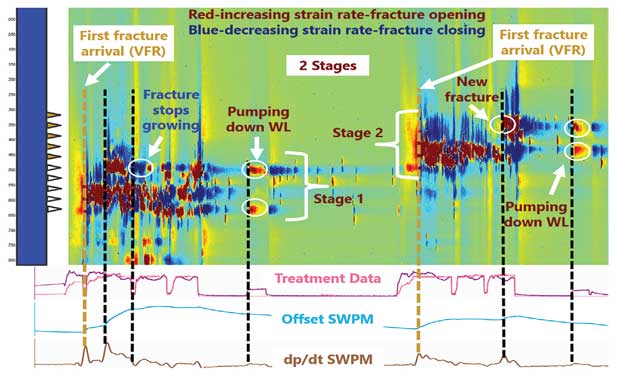
Figure 1 shows an example of two sequential stages of a fracturing treatment monitored with SWPM and DAS cross-well strain. The SWPM and cross-well strain data were recorded on the same monitor well. Each stage was completed using five perforation clusters, which are noted by the triangles on the left side of the figure (colored by stage). The y-axis on the strain rate plot is measured depth (increasing from top to bottom) of the fiber optic cable along the lateral of the offsetting monitor well. The treatment well and monitor well were separated by approximately 600 feet laterally and 100 feet vertically.
Time spans four hours and increases from left to right on the plot. The colors represent the condition of the fiber optic cable at various depths over a portion of the offset well’s completion. Green represents a neutral strain state, red is an increasing strain rate (or decrease in cable diameter, representing an area of tension), and blue is a decreasing strain rate (or increase in fiber optic cable diameter, representing an area of compression).
Treatment data from the treatment well and SWPM responses recorded in the monitor well are shown in the three tracks below the strain data. The top track includes treatment pressure and pump rate. The second track is the measured pressure (blue) from the sealed wellbore offsetting the treatment well. The third track is the sealed wellbore pressure derivative (brown) with respect to time.
VFR Measurement
The first stage is shown on the lower left of Figure 1. The first fracture arrival occurred early in the stage. It is identified on the strain-rate plot by a tensile region (red) located between two compressive regions (blue). At the same time the strain recorded a fracture intersection, the SWPM data shows a pressure inflection amplified on the derivative plot. The timing of the “volume to first response” (VFR) for each stage is noted by dashed gold lines for both stages. Simply stated, VFR is the volume of fluid pumped into the treatment well when the fracture intersection occurs at the monitor well. It is a qualitative measure of cluster efficiency, or fluid distribution uniformity within a stage.
As shown in Figure 1, as Stage 1 progressed, a second fracture intersected the monitor well at a shallower measured depth (heelward). The strain response shows a tensile region between two compressive regions and sealed wellbore pressure shows a second pressure inflection. Shortly after intersection occurred, the second fracture stopped growing, shown by the lack of tension at this depth and pressure decrease, amplified on the derivative plot. At the end of Stage 1, the strain plot shows three fractures in a compressive state, which is interpreted as three hydraulic apertures decreasing in width at the monitor well location. Sealed wellbore pressure began to decrease when the stage was completed and pumping ceased.
In multistage plug-and-perf horizontal completions, wireline is pumped down the lateral between each stage to set a plug to isolate the previous stages before shooting new perforations for the next stage. As wireline is pumped down, fluid re-enters the fracture created in the previous stage. When pumping wireline after Stage 1 at 15 bbl/minute, two areas of tension were evident (denoted in Figure 1). These are believed to be reactivations of the two most conductive fractures from the previous stage. SWPM also recorded a slight reduction in the pressure decline rate at the onset of wireline pump down, highlighting the sensitivity of the measurement. Stage 2, shown at the upper right of the figure, has many of these same signatures.
SWPM provides a powerful diagnostic to quickly determine VFR during offset well completion. A higher VFR suggests more uniform fluid distribution, which creates more similar fracture geometries and improves drainage efficiency within the stimulated rock volume. A lower VFR indicates poor fluid distribution within a stage, which can lead to dominant fractures with excessive geometries, increasing the potential risk of “short-circuiting” well spacing and excessive well communication. Several factors can affect VFR, including rock mechanical property heterogeneities, geologic structure, faults, natural fractures, unequal perforation diameters, an insufficient pressure drop across perforations, poor cement isolation and a faulty frac plug.
Meramec Case Study
Field applications of SWPM have demonstrated the technology’s effectiveness in quantifying in real time the cluster efficiencies of hydraulic fracturing treatments. In the Anadarko Basin’s STACK play, SWPM monitoring was used successfully to evaluate depletion impacts on fracture geometry and estimate fracture geometries and the presence of frac barriers in the Meramec formation. Meramec lithofacies include tight carbonates (silty peloidal skeletal packstone), sand-rich carbonates (calcite cemented silt-sandstones), siltstones, calcareous siltstone, argillaceous silt-sandstones, and clay-rich siltstones.
Meramec reservoir quality and rock mechanical properties are broadly controlled by the amount of early calcite cementation. The stress regime in the Meramec is strike-slip, where the overburden is the intermediate principal stress. Tensile natural fractures, observed from image logs, are associated with tight carbonates and sand-rich carbonate facies. However, image logs tend to underestimate fracture counts when compared with Meramec core.
The primary landing zone in the area of interest is the upper half of the Meramec, which has higher porosity, permeability and pore pressure. An area of pore pressure gradient transition occurs between the upper and lower Meramec, which are separated by a low porosity, high calcite interval that potentially can act as a frac barrier. It is critical to determine whether created hydraulic fractures can breach this barrier and contact both the upper and lower Meramec intervals from a single horizontal wellbore.
Microseismic and SWPM were collected on a 12-well development in the Meramec formation to improve the understanding of parent depletion and parent fractures on the stimulation of infill wells. Microseismic data was collected with a surface array and had an average perf-relocation error of seven, 15 and nine feet for the x, y, and z directions, respectively. An initial comparison of the microseismic and SWPM datasets is shown in Figures 2A and 2B.
FIGURE 2
Microseismic and SWPM for Stages
With and Without Pre-Existing Fractures
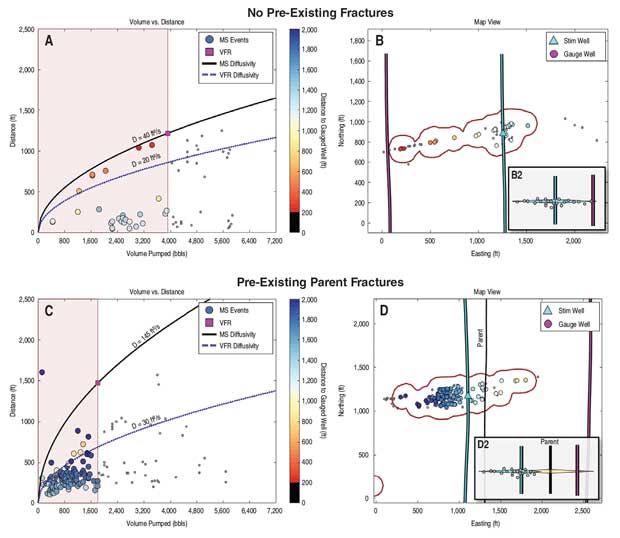
Figure 2A depicts the migration of seismic events away from a single stage’s wellbore relative to the volume pumped on the stage. The VFR from SWPM, depicted as a magenta square, indicates that ~4,000 barrels of fluid were pumped before the monitoring well saw a pressure response at ~1,250 feet away from the treatment well. In Figure 2B, the location of the hydraulic fracture at the time of the pressure response is delineated in map view by a red contour, showing the microseismic fracture tip within a few hundred feet of the SWPM well.
A contrasting example is shown in Figures 2C and 2D, where a different well in the unit was being completed next to a parent well. In this case, the microseismic cloud showed a similar fracture diffusivity, but no microseismic events reached the gauged monitoring wellbore. However, SWPM detected a pressure response, where the quick response required an order of magnitude higher fracture hydraulic diffusivity.
The real value in having both microseismic and SWPM datasets came from subsequent analyses. The SWPM and microseismic agree in the case with no pre-existing hydraulic fractures (Figures 2A and 2B). Both show fracture growth with similar fracture diffusivity. When pre-existing fractures were near a parent well (Figures 2C and 2D), microseismic showed a similar fracture diffusivity, but SWPM showed higher fracture diffusivity with a comparably rapid fracture growth rate over time. This rapid response is interpreted to be a cluster that was diverted, or short-circuited, into a parent fracture, while the remaining clusters in the stage grew new hydraulic fractures, as seen in the microseismic data.
We believe this short-circuiting is a major driver of completion inefficiencies, causing other clusters to have reduced pressure support since pressure is being diverted into the previously failed media of the parent fracture network.
Fracture Diffusivity
Fracture diffusivity in the 12 infill wells was broken into four categories. As seen in Figures 3A, 3B1 and 3B2, the first two categories are from an infill well next to a parent well that saw rapid pressure responses (average D = 154 square feet per second) and a well with no pre-existing fractures that saw slower pressure responses (average D = 43 feet2/s).
FIGURE 3
SWPM Fracture Diffusivities For Single Wells in Four Scenarios
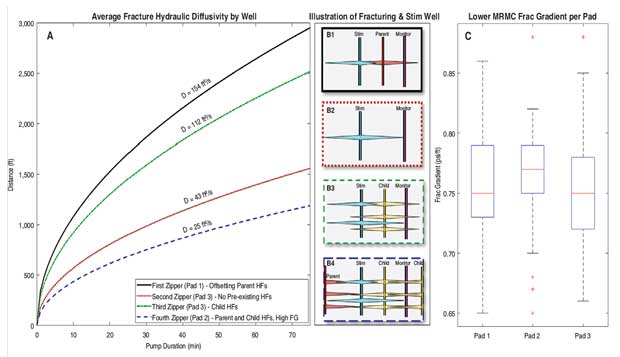
The next category is an infill well stimulated next to a recently completed infill well (Figure 3B3), where the average diffusivity was high at 112 feet2/s. It is unknown if the pressure response is from a cluster connected to a previously created fracture. The final category is a well in the final zipper, carried out on the middle pad of the unit, where pressure responses were the slowest in the unit. In these wells, average diffusivity was 25 feet2/s (Figure 3B4).
We have several theories for what the fracture diffusivity data says about fracture interaction, but it is important to clarify that these early hypotheses need additional testing. The fact that the microseismic often showed lower diffusivity that agreed with the diffusivity in the well being stimulated in unfractured rock leads us to believe lower diffusivities (less than 50 feet2/s) represent new hydraulic fracture generation instead of restimulations of previously created hydraulic fractures. For the infill well completed next to a recently completed well (Figure 3B3), the fact that diffusivity was high, leading to higher fracture propagation speeds, leads us to believe most of these responses were also short-circuits into adjacent infill hydraulic fractures.
The final wells in the unit, located on Pad 2, had the highest fracture gradients and were bounded by the other two pads (Figure 3C). These wells had the lowest diffusivities, where either the active clusters were not being diverted into previously created fractures, or those previously created fractures had high enough pressure to prevent a rapid pressure response. Regardless of the mechanism, the higher fracture gradient was likely responsible for the lower diffusivities and prevented the negative impact of a short-circuit cluster on completion efficiency.
Fracture Geometry
FIGURE 4A
Map View of VFRs for Two Wells Offsetting Parent Well Depletion
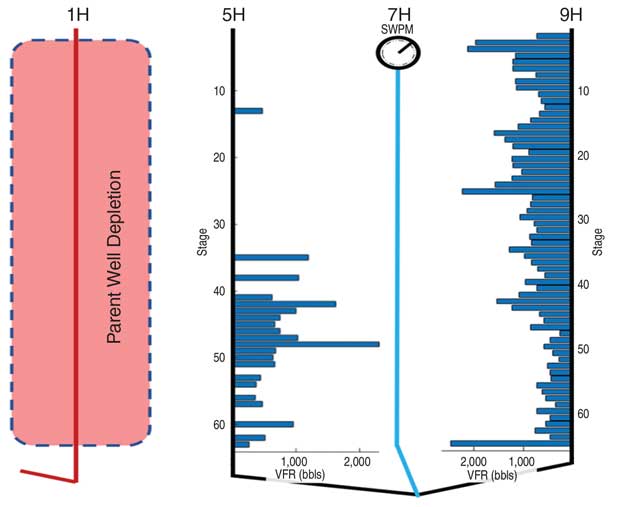
Another way of investigating a parent well’s impact using SWPM is measuring asymmetry of infill fracture geometry induced by primary well depletion. Figure 4A presents a map view of four horizontal wells. The 1H is a depleted primary well that had a cumulative production of ~500,000 barrels of oil prior to infilling with the 5H, 7H and 9H wells. No depletion mitigation technique was employed. The wells are spaced 600 feet laterally, and the toe sections of the wells are located at the top of the image with the heels at bottom. The 5H and 9H were completed in a zipper fashion, alternating between wells for each stage.
The bar chart on the 5H and 9H represents the VFRs measured using SWPM recorded in the 7H. Each bar represents the volume pumped into the treatment well when the 7H sealed wellbore recorded a pressure response. Longer bars equate with more fluid pumped into the treatment well before the response was recorded on the 7H. The key take-away from the image is the 5H failed to generate fractures that contacted the 7H for the first 60% of the lateral, while the 9H generated a response for every stage completed.
We believe the lack of pressure responses in the first portion of the 5H completion was attributable to asymmetric fracture growth into 1H depletion. This response has been observed extensively in the field to varying degrees, while the primary well indicated continued pressure build during offset stimulations. Until that region’s pressure (and resulting stress) are elevated enough, fractures will grow asymmetrically toward the depleted volume.
FIGURE 4B
Map View of VFRs for Well Offsetting
Primary Well with Depletion Mitigation
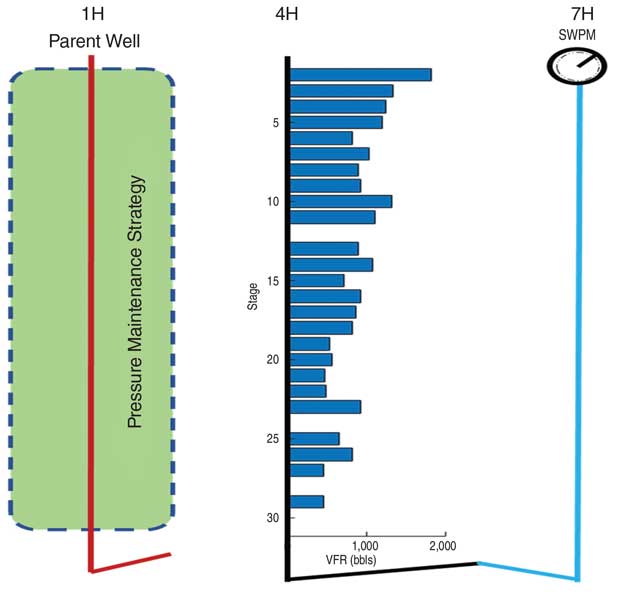
Figure 4B shows a map view of the 1H, 4H and 7H wells in an adjacent unit (the same unit in the microseismic example in Figure 2) to the wells in Figure 4A. The 1H is a depleted parent well that had cumulative production of ~180,000 bbl prior to infilling with the 4H and 7H. Depletion mitigation was employed in this unit; the primary well was recharged with water prior to the offset well completions to increase pressure in the depleted area and reduce the asymmetry of fractures generated from infill wells. It is believed that a major driver for infill well underperformance is the asymmetry of generated fractures and a reduction of fracture height in the first-order offset well.
This case study represents the Devon team’s attempt to alter subsurface pressure and stress to redirect first-order fracture geometry away from the depleted parent well volume. The wells are laterally spaced 600 feet apart. The 4H was monitored using the 7H sealed wellbore. The bar chart on the 4H represent VFRs measured using the SWPM data recorded in the 7H, with each bar representing the volume pumped into the treatment well when the 7H recorded a pressure response. Longer bars equate to more fluid pumped before the response was recorded on the 7H. The key take-away from Figure 4B is that every stage in the 4H generated a pressure response on the 7H, suggesting that the mitigation technique mitigated and redirected asymmetry related to depletion.
Integrating SWPM and microseismic monitoring provided a more complete picture of the impacts of depletion on infill fracture geometry in the STACK. Without SWPM, the conclusions from microseismic would have been incomplete and falsely indicate that hydraulic fractures did not extend into the area of recharged depletion, but instead extended asymmetrically away from the recharged depletion zone. SWPM clearly showed fractures extending into the recharged depletion region. Furthermore, the coupling of the techniques suggested different mechanisms when infilling next to a parent well, causing a rapid short-circuiting through the parent fracture, where a slower fracture propagation rate indicated new fracture creation.
Wolfcamp Case Study
FIGURE 5
Delaware Basin Wolfcamp Well Layout
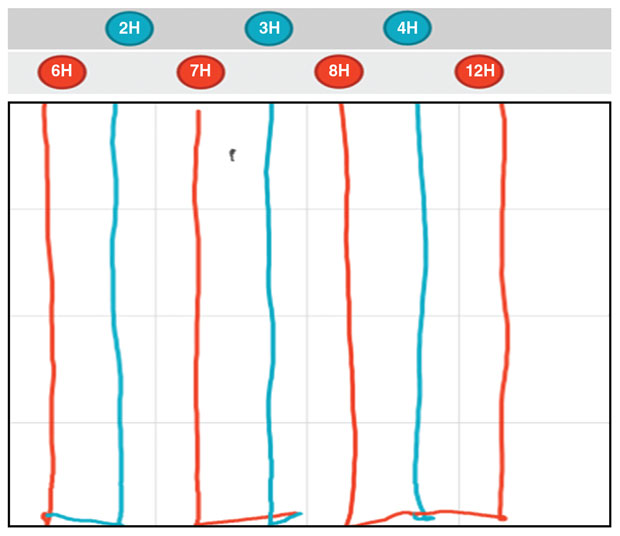
In the Delaware Basin’s Wolfcamp play, SWPM was used as part of a larger diagnostics package designed to help improve the understanding of stage and cluster designs in a staggered field development. SWPM was carried out in two phases. First, the 3H and 7H were monitored while the 12H, 4H and 8H were zipper fractured. Second, the 2H and 6H were monitored while the 3H and 7H were zipper fractured. Figure 5 shows well positioning in gun barrel and map views. Four stage/cluster designs were evaluated:
- Design A with low clusters and low perforation friction;
- Design B with low clusters and high perforation friction;
- Design C with high clusters and low perforation friction; and
- Design D with high clusters and high perforation friction.
High-clusters designs C and D had 1.9 times more clusters than low-clusters designs A and B. Likewise, stages B and D were designed with four times more perforation friction than stages A and C. Additional diagnostics were run on the 3H and 7H to evaluate these design parameters. To validate actual perforation friction, downhole cameras were used to image the 3H and 7H perforations. In addition, pre- and post-frac step-downs were performed on every stage of the 3H and 7H wells. To evaluate production performance, a fiber optic log was run in the 3H and 7H.
The combined dataset attempts to answer key questions, such as:
- Which design provides the highest normalized production (bbl/ft)?
- Which design gives the most equal treatment between clusters, and does that matter for production?
- Do the SWPM results correlate with the measured perforation erosion and production log data?
Because of operational constraints, SWPM data was only captured for designs A, B and D while completing the 3H and 7H. Comparing the A and B low-cluster designs, the higher perforation friction in Design B resulted in larger VFRs than Design A, signifying more even fluid distribution and more uniform fractures. Comparing the B and D high-perforation friction designs, Design B’s lower cluster count appeared to delay VFR, indicating more uniform fractures with fewer clusters per stage.
Stimulation Distribution
Further exploring the theory that higher perforation friction creates more equal stimulation distribution between clusters and higher VFRs, the downhole camera data compared measured perforation area with VFR. The distributions of stage perforation area (summation of the individual perforations within a stage) were colored and binned by design based on downhole camera measurements. The stage perforation area can be converted to an equivalent diameter, which then can be used to calculate perforation friction. Less perforation area should generate higher perforation friction when the same treating rate is achieved.
Plotting average perforation friction against average VFR suggests that higher perforation friction correlates to a more even distribution of stimulation fluid among clusters, as indicated by higher VFRs. As more fractures were generated near the stimulated wellbore, more fluid was required to generate a response in the far-field. Design B, with the highest perforation friction, had the highest VFR, suggesting more uniform fluid distribution. Design A, with the lowest perforation friction, had the lowest VFR, signifying less uniform fluid distribution.
Ultimately, the most important measure of how a design performs is production. Production measurements normalized by lateral length were obtained using a downhole fiber optic production log. Design B generated the highest normalized production rates and had the smallest production variance. Design A had the lowest perforation friction, the lowest average VFR, and the largest variance. Design D generated the lowest average production. Looking at average normalized production per lateral foot versus average VFR shows that the production data agrees qualitatively with VFR, identifying the correct order of performance (higher VFRs yielding higher production rates).
Multiple applications in multiple basins and formations have validated SWPM’s ability to quickly and economically evaluate and quantify fracture growth rates and fracture-driven interactions during well stimulations using only a surface pressure gauge on a sealed monitor well. The technology can be applied to optimize completion designs from stage to stage and it has the potential to allow operators to “right-size” stages in real time. It can reduce the risk of overcapitalizing a stimulation, ultimately leading to more economic development.
Editor’s Note: The preceding article was adapted from SPE 199731 (“Monitoring the Pulse of a Well through Sealed Wellbore Pressure Monitoring: a Breakthrough Diagnostic with a Multibasin Case Study”), a technical paper prepared for presentation at the 2020 Society of Petroleum Engineers Hydraulic Fracturing Technology Conference & Exhibition, held Feb. 4-6 in The Woodlands, Tx.
For more detailed information on SWPM technology and additional case study results in Anadarko and Delaware Basin applications, download the full-length paper at www.onepetro.org.
The authors acknowledge Devon Energy colleagues Chris Ketter, Josh O’Brien, Mouin Almasoodi, Sheldon Moos, Trevor Klaassen, Kyle Dahlgren, Trevor Ingle, Jon Roberts, Eric Gerding, Jarret Borell, and Sundeep Sharma, all of whom contributed to the development of SWPM technology and its initial field applications.
KYLE HAUSTVEIT is a completion engineer at Devon Energy Corp. Haustveit joined Devon as a production engineer in 2013. He holds a B.S. in petroleum engineering from Montana Tech of the University of Montana, and an EMBA in energy from the University of Oklahoma.
WOLFGANG DEEG is a completion engineer formerly at Devon Energy Corp. He holds a B.S. in mechanical engineering from the University of Connecticut, an M.S. in materials science from California Institute of Technology and a Ph.D. from Stanford University.
BRENDAN ELLIOTT is a senior staff completion engineer at Devon Energy Corp. He joined Devon in 2012 after completing a B.S. in petroleum engineering from Texas A&M. Elliott is a Ph.D. candidate in petroleum engineering at the University of Texas at Austin.
JACKSON HAFFENER is a geophysicist at Devon Energy, where his work includes geophysical characterization of the STACK play in the Anadarko Basin. Haffener holds a B.S. and an M.S. in geophysics and seismology from the University of Oklahoma.
For other great articles about exploration, drilling, completions and production, subscribe to The American Oil & Gas Reporter and bookmark www.aogr.com.