


‘Extreme’ Perforating Strategy Key To Liberty Resources’ Bakken Completion Design
By Paul M. Weddle, Larry Griffin and C. Mark Pearson
DENVER–Liberty Resources continues to evolve its advanced completion design for Bakken/Three Forks horizontal wells, including applying high-density perforating (HDP) and extreme limited-entry (XLE) perforating techniques.
HDP is a plug-and-perf approach consisting of cementing the liner in place, perforating 15 clusters per stage using two shots per foot and 0-180 degree phasing with even-hole charges, and then pumping high-rate slickwater treatments at a design rate of 80-90 barrels a minute. The newest enhancement to the advanced completion design, XLE perforating, creates perforation friction in excess of 2,000 psi.
Since the beginning of 2015, Liberty has used the HDP strategy to reduce its standard stage count from 50 to 27 for a 9,500-foot Bakken/Three Forks lateral while achieving higher per-well production rates than offset completions. When it comes to value creation, the cost per barrel of oil produced is a critical metric to assess development opportunities, and achieving the same or increased oil production volumes with less capital has led to significant gains in capital efficiency.
The goal of XLE is to consistently and confidently achieve diversion to a high number of clusters per stage, ultimately increasing capital efficiency by right-sizing each well’s cluster and stage count. Stage counts are fundamentally linked to the number of active clusters in each stage. By driving significantly more active clusters per stage, XLE perforating can reduce stage counts without sacrificing performance.
Post-frac fiber optic diagnostics and radioactive proppant tracer data show that, on average, 11-13 clusters per stage can be stimulated in zones of dissimilar rock and 13-15 clusters per stage in intervals of similar rock when pumping slickwater at 80-90 barrels a minute. Achieving a high number of active fracture initiation points in each stage is improving production performance in Bakken and Three Forks wells.
XLE Design Considerations
The XLE technique creates very high perforation friction, but to advance the goal of evenly diverting stimulation fluid to all fracture initiation points, perforation friction must be designed to mitigate perforation/cluster-level pressure variations in fracture-entry pressure (the pressure from just outside the perforations to the fracture tip, including near-wellbore tortuosity, net pressure, stress shadowing, and fracture extension or net pressure changes).
To achieve this, the magnitude of the various sources of variability should be quantified and addressed in the HDP/XLE completion and perforating design. In addition, the design must account for the dynamic fracturing process, where most of the fracture-entry pressure parameters, as well as perforation dimensions, change as a stimulation treatment progresses.
The primary sources of variability to be considered in designing for XLE are:
- Minimum horizontal stress variability along the lateral (90 percent of a Bakken lateral is within a 750-psi range);
- Near-wellbore friction variations from stage to stage and perforation to perforation (step-down tests demonstrate a P50 of 625 psi for starting near-wellbore friction);
- Stress shadowing between active clusters (the magnitude of stress shadowing depends on formation properties, completion design parameters and cluster spacing, but is assumed to be approximately 200 psi for design purposes);
- Fracture extension pressure variability based on changes to net pressure (the initial and final instantaneous shut-in pressures are similar for the wells studied, with minimal net pressure variability);
- Variability in perforation friction initial condition (this may limit the ability to achieve the designed pump rate given perforation diameters at every possible orientation and the number of open perforations versus the number shot); and
- Perforation friction changes during treatment (the rounding and erosion of perforations, and the possible loss of clusters caused by proppant settling in the liner, can cause a ±500-psi change in perforation friction while treating a frac stage).
A minimum 2,000 psi perforation friction is targeted at the beginning of a Bakken well XLE design, with the expectation that as perforations round and erode, perforation friction will remain above 1,500 psi at the end of pumping to account for all possible fracture-entry pressure variations. It should be noted that 1,500 psi accounts for worst-case variations and combinations of the identified parameters, especially minimum horizontal stress, since a given stage usually has less variability than what is encountered along the entire lateral. Pipe friction also is considered in XLE designs where smaller perforations are shot for the heel half of a long lateral to maximize perforation friction as wellbore conditions allow.
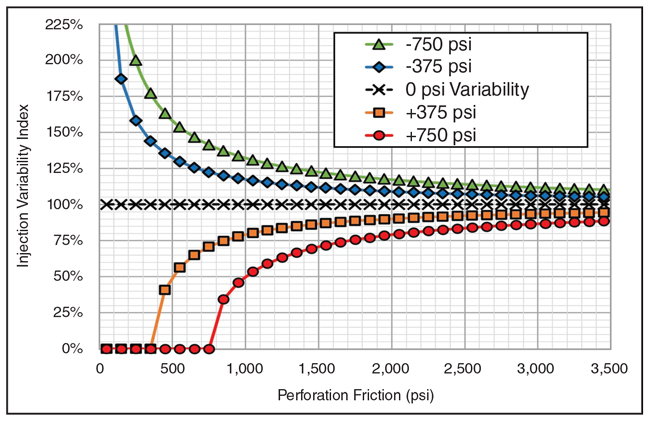
Injection Variability Index
Figure 1 shows the injection variability index, or the ratio of the base line injection rate with zero fracture pressure variability between clusters to the injection rate associated with changes in perforation friction at other intrastage frac initiation points. A variation in fracture-entry pressure is communicated directly as an equal pressure change across the perforations, since the pressure is constant inside the wellbore across all clusters within a stage. The injection rate either will increase or decrease at each cluster proportionally related to perforation friction. This figure demonstrates the benefit of applying an XLE perforating strategy, with perforations of varying fracture-entry pressures converging toward fluid distribution parity by increasing perforation friction.
FIGURE 1
Injection Variability Index
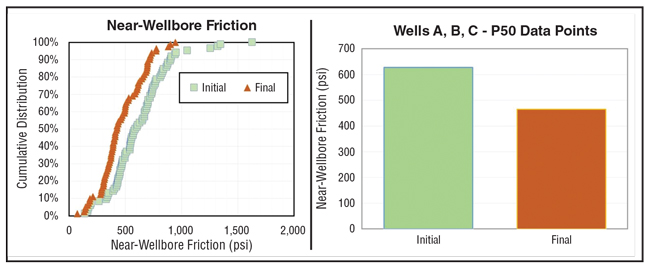
Lateral drilling data were acquired to determine the minimum horizontal stress variability along the lateral, and three Middle Bakken wells were selected to have full sets of pre- and post-proppant step-down tests (SDTs) to quantify near-wellbore friction, number of open perforations and perforation friction. Figure 2 shows initial and final near-wellbore friction from the SDTs for all applicable stages in case study wells A, B and C. Data are shown as a cumulative distribution function and the P50 values for the initial and final SDTs are shown in the figure’s bar chart at right.
FIGURE 2
Initial and Final Near-Wellbore Friction from SDTs
(All Applicable Well A, B and C Stages)
Increasing perforating friction mitigates the effects of stress shadowing on intrastage frac geometries in designs with multiple clusters per stage. Moreover, variability in fracture extension pressures as individual fractures grow and net pressure builds does not appear to be a significant consideration for the Bakken formation. The difference in initial and final instantaneous shut-in pressures for Wells A, B and C was near zero. Only four of 84 stages analyzed exceeded a 300-psi net pressure gain and only three of the 84 stages had a net pressure loss greater than 200 psi.
A key source of variability in the perforating friction equation is perforation diameter. Standard conventional perforating charges introduce a significant source of perforation diameter variability in horizontal applications because perforating guns are on the bottom of the wellbore and asymmetrically offset with the casing. This causes conventional charges to create significantly larger holes on the low side of the pipe versus its high side, resulting in considerable perforating friction variations. It is critical in XLE applications to use even-hole charges engineered to provide consistent entry holes at any orientation to reliably achieve the targeted pump rate.
The SDT values for initial and final perforating friction for all stages in wells A, B and C indicate the completion designs only rounded the perforations and did not cause significant enlargement. There were very few stages in which substantial perforation diameter enlargement occurred and caused a change between initial and final perforating friction.
Recent trials indicate that orienting 0-180 degree phasing perforations up and down in the wellbore with a weight bar may benefit the HDP/XLE completion design. This is consistent with the idea of even-hole perforating charges in that it should make the pressure response more consistent for a given completion and perforating design by eliminating another possible source of variability that is caused by the hoop stresses and near-wellbore tortuosity that is associated with the various phasing that can occur without orientation.
Using the number of perforations open from the pre-proppant SDT and the proppant volume placed, Well A averaged approximately 9,800 pounds per perforation, Well B averaged 9,200 pounds/perf, and Well C averaged 14,900 pounds/perf. The lack of significant diameter erosion is not totally unexpected, given the use of P-110 grade casing, a lower average slurry proppant concentration in the slickwater fluid system, and the volume of proppant per perforation in the HDP/XLE completion design used on the three wells.
Downhole Diagnostics
Radioactive (RA) tracer data were used for downhole diagnostics of perforation cluster efficiency (PCE) in early 2016 in initial XLE field trials on Well X. XLE was used in four stages to create perforation friction values ranging from 2,000 to more than 4,000 psi. The four stages with XLE showed much higher initial PCE than non-XLE stages (1,000 psi of perforation friction) in the same wellbore. This was a significant finding that indicated early and continuous PCE throughout a stage without solid particulate diverters, even though using solid particulate diverters did increase the final PCE of the non-XLE stages significantly by the end of the traced stages. Most importantly, Well X’s production demonstrated significant uplift compared with offsets.
RA tracer data also were used for downhole diagnostics in the case study wells. Using RA log data, PCE for all stages traced in Well A averaged 77 percent (cluster counts per stage were varied in multiple traced stages, so not all stages had 15 clusters). This was the first full wellbore designed with XLE perforating for every stage, and the 80 bbl/minute pump rate could not be achieved on most stages until the perforation scheme was altered to include a few incremental clusters per stage. This seemed to lower PCE, especially when compared with Well B, because of proppant transport issues in the liner that caused clusters to be lost because of proppant settling.
Figure 3A shows the RA tracer log for Stage 3 in Well B. PCE was calculated at 87 percent, or 13 of 15 clusters shot. Figure 3B shows the treating plot for this stage, which may indicate a leaking plug with the tops of a few clusters from the prior stage showing significant RA tracer counts. All stages were designed to use XLE. PCE for all stages traced in Well B averaged 89 percent (again, not all stages had 15 clusters).
FIGURE 3A
RA Tracer Log (Stage 3 In Well B)
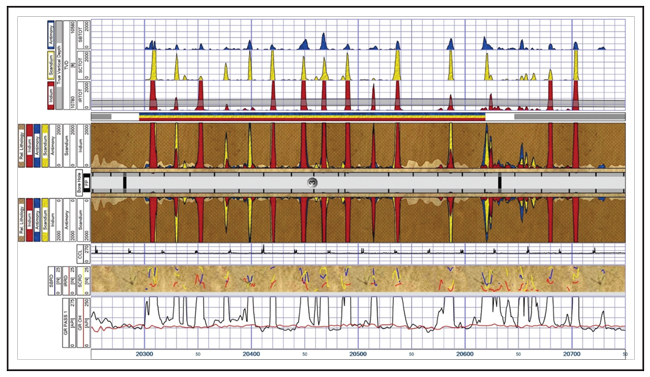
FIGURE 3B
Treating Plot (Stage 3 In Well B)
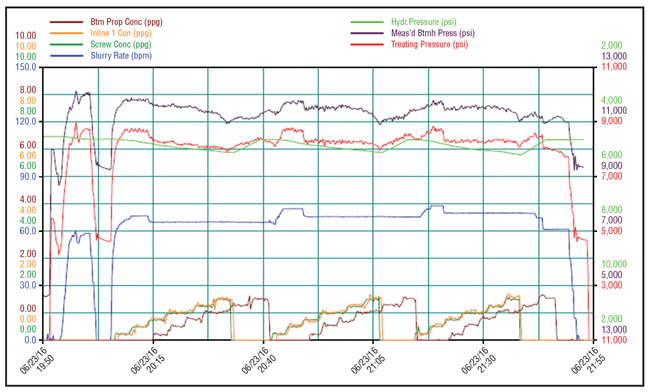
The initial perforation friction for Stage 3 was 2,200 psi, and the final perforating friction was 1,400 psi. The 800-psi drop in perforating friction may be attributable to eroding perforation diameters, but is more likely from the leaking plug exposing clusters from the stage below.
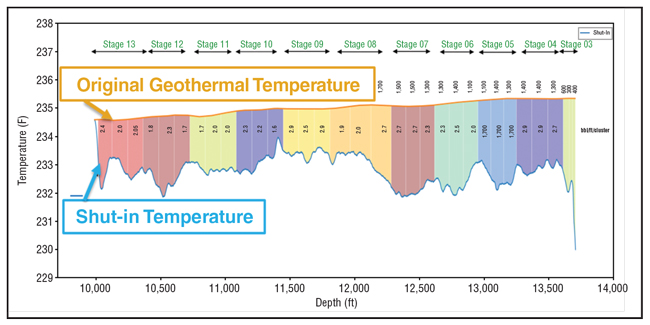
Post-frac fiber optic diagnostics were performed in mid-2017 in two wells, one in the Middle Bakken and the other in the Three Forks (not the A, B or C wells). A composite carbon rod with fiber optic strands was deployed to log both distributed temperature sensing (DTS) and distributed acoustic sensing (DAS) data during producing and shut-in conditions. A warm-back analysis was performed using DTS data to analyze frac fluid distribution within each stage, and the analysis demonstrated consistent fluid distribution as binned by thirds within each stage.
Figure 4 shows the results from the Middle Bakken well. It had either 12 or 15 clusters per stage, with each intrastage bin containing four or five clusters. The same proppant volume was pumped in each stage, so the stages with 12 clusters had 25 percent more proppant per cluster.
FIGURE 4
Frac Fluid Allocation Based on Post-Frac DTS
Warm-Back Analysis (Middle Bakken Well)
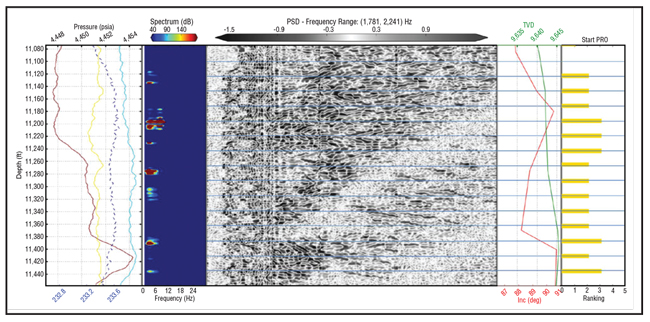
Production log analysis was performed after the shut-in period required for the warm-back, and a DAS ranking system was implemented as a constraint into the temperature model to converge on a more probable solution, mitigating uncertainty in interpreting DTS results in a horizontal wellbore. Higher-frequency noise was aggregated over time, creating a qualitative production allocation for each cluster. DAS obtained with DTS provides a unique description of the wellbore flow profile.
The production log analysis in Figure 5 is for Stage 10 in the same Middle Bakken well shown in Figure 4. The two-well average for producing cluster efficiency was 80 percent for the 20 stages logged and analyzed. The data indicate that 14 of 15 clusters were producing in this stage for a single stage producing PCE of 93 percent.
FIGURE 5
Post-Frac Production Log Evaluation using
DAS/DTS Data (Middle Bakken Well)
Production Results
To date, production results for Wells A, B and C have exceeded pre-drill expectations. Well A is exceeding expectations by 9 percent and outperforming the next-best offset well in similar geologic properties and structure by a 1.7 multiple based on 180-day cumulative oil production per foot of lateral. Well B is exceeding expectations by 13 percent and outproducing the next-highest performing offset by a 2.5 multiple. Likewise, Well C is exceeding expectations by 14 percent and outproducing the next-highest performing offset by a 1.7 multiple.
These positive results are proof of a dramatic increase in the number of effective clusters by successfully applying an HDP strategy with XLE. The case study data demonstrate that XLE diversion consistently can increase the PCE of an HDP completion design by maximizing perforating friction.
Wells A, B and C show a consistent increase in productivity, reserves and capital efficiency. Moreover, finding and development costs can be lowered through the combination of reduced completion costs and increased well productivity. The three case study wells have achieved a 15 percent average reduction in per barrel F&D costs while producing 170-250 percent more than their best offsets during the same number of producing days.
Editor’s Note: The authors acknowledge Liberty Oilfield Services, PerfX Wireline, GEODynamics, Ziebel and ProTechnics for their roles in the ongoing field trials of the HDP/XLE completion design, as well as the early pioneering work in limited-entry perforating documented in SPE 184828 “Mining the Bakken: Driving Cluster Efficiency Higher using Particulate Diverters” and SPE 189880 “Mining the Bakken II: Pushing the Envelope with Extreme Limited Entry Perforating.” The papers were presented, respectively, at the 2017 and 2018 Society of Petroleum Engineers Hydraulic Fracturing Technology Conference.

PAUL M. WEDDLE is well completions manager for Liberty Resources II LLC, a Denver-based independent with operations in the Bakken Shale and Powder River Basin. He graduated in 2005 from the University of Texas at Austin with a B.S. in petroleum engineering, and began his career working for Shell as a completion engineer fracturing tight gas formations in Wyoming. Since then, Weddle has completed vertical and horizontal wells in unconventional oil and gas reservoirs in Utah, North Dakota, Texas and Oklahoma.

LARRY GRIFFIN is vice president of completion and production operations at Liberty Resources II LLC. With more than 35 years of experience, he began his career with ARCO in West Texas and Alaska. He joined Pinnacle Technologies in 1998 and was instrumental in developing and commercializing fracture and reservoir diagnostics technologies such as tiltmeter, fiber optics and microseismic. Griffin served as Newfield Exploration Co.’s completions manager for the Arkoma and Anadarko basins before joining Liberty Resources in 2011. He holds a B.S. in petroleum engineering from Texas Tech University.

C. MARK PEARSON is chief executive officer and president of Liberty Resources II LLC. He is a Society of Petroleum Engineers’ distinguished member with expertise in well completion and stimulation. Pearson is one of the pioneers of multistage hydraulic fracturing of horizontal wells, with more than 30 years of horizontal experience in West Texas, Alaska, the North Sea, the Mid-Continent, North Dakota and Wyoming. A former professor of petroleum engineering at the Colorado School of Mines, Pearson holds a B.S. and a Ph.D. from the Camborne School of Mines, and is a graduate of the Harvard Business School Advanced Management Program.
For other great articles about exploration, drilling, completions and production, subscribe to The American Oil & Gas Reporter and bookmark www.aogr.com.