


Study Integrates Flow Simulation, 4-D
By Ayyoub E. Heris, Aaron V. Wandler, Hossein Kazemi and Thomas L. Davis
GOLDEN, CO.–Four-D seismic imaging plays a very important role in managing mature oil fields for enhanced oil recovery. As part of the ongoing work under an independently sponsored research consortium seeking to develop and apply 4-D multicomponent seismic and associated technologies to effectively model complex reservoirs, the Colorado School of Mines’ Reservoir Characterization Project (RCP) has generated qualitative results of integrating flow simulation with time-lapse multicomponent seismic data for a carbon dioxide enhanced oil recovery project in the thin valley-fill Morrow formation at the Postle oil field.
Located in Texas County in the panhandle of Oklahoma, Postle Field is operated by Whiting Petroleum Corporation. A quantitative workflow approach was developed to integrate flow simulation with time-lapse data from three seismic surveys acquired in the field to monitor the ongoing CO2 flood. The research results demonstrate that for a credible dynamic reservoir characterization, integrating flow simulation and 4-D seismic is required, which in turn, can guide field operations. However, this process is challenging in thin reservoirs undergoing CO2 water-alternating-gas (WAG) injection.
In recent years, the link between reservoir engineering and geophysics disciplines has advanced significantly. Time-lapse seismic applications in reservoir management range from qualitative evaluation to constructing integrated dynamic reservoir models. Traditionally, reservoir models are validated by history-matching production and pressure data before they can be used to predict reservoir performance. However, history matching is not a unique process, and using time-lapse seismic as an additional constraint can improve the validity of reservoir models and reduce the uncertainty associated with the simulation results.
The goal of the research work sponsored by the RCP is to investigate applying dynamic reservoir characterization during an EOR CO2 WAG process. Primary production from the reservoir in the Hovey Morrow Unit study area in the Postle Field started in 1961, followed by water injection in 1974. The reservoir was revitalized by commencing a CO2 injection program in late 2007 in the Pennsylvanian Upper Morrow A sandstone, with an average gross thickness of 45 feet and a drilling depth of 6,100 feet in the study area.
Because of the complex associations of pressure and saturation change influence associated with the WAG flood at the Postle Field, RCP recognized early the importance of monitoring the flood with multicomponent seismic technology. The 3-D data acquired at Postle were nine-component surveys to record both compressional (p) and shear (s) waves, and to separate pressure from fluid saturation changes, which are inherently “mixed” in a P-wave survey alone.
The first 3-D, 9-C seismic survey (base line) was recorded just after the start of the EOR program in March 2008. The second and third multicomponent surveys (first and second monitor surveys) were conducted in December 2008 and February 2010, respectively. The surveys cover an area of 6.25 square miles.
In a time-lapse study, it is important to construct a detailed reservoir model that integrates seismic, petrophysics, geology and engineering. This model can be used to improve the understanding of the reservoir from an engineering perspective, monitor CO2 movement, forecast reservoir performance, take proactive measures in the WAG management, and determine optimal times for follow-up monitoring of seismic surveys.
An integrated reservoir model was constructed for the Morrow A sandstone and was used to qualitatively and quantitatively integrate flow simulation with 4-D seismic interpretation. The objective then turned to achieving the quantitative integration of flow simulation and 4-D seismic using a workflow to link the flow simulation model and seismic with a rock physics model. To better understand the effects of different reservoir dynamic parameters such as pressure and CO2 mole fraction on seismic response, a sensitivity analysis was performed using a conceptual model.
Reservoir Modeling
A fine scale geocellular reservoir model was developed for the Morrow A sandstone, based on geostatistically distributing the petrophysically derived reservoir properties (porosity, permeability and irreducible water saturation), and history matching production/injection and pressure data. The petrophysical properties of the reservoir were distributed using sequential Gaussian simulation guided with anisotropic variograms from well log data. The fine-grid reservoir model was then upscaled for the simulation model to simulate reservoir fluid flow from 1961 to 2010 and history match observed production/injection and pressure data.
The reservoir model also included a log facies model, which was the result of performing principal component and cluster analysis to group similar log response from the gamma ray, neutron porosity, bulk density and photoelectric effect logs. The log facies model was integrated with core data to observe a relationship between core-measured permeability/porosity and well log response. The log facies were then qualitatively interpreted as:
- High-porosity and high-permeability zones that signify areas of high-quality reservoir sand;
- Intermediate porosity/permeability zones that indicate areas of intermediate-quality reservoir;
- Low-porosity/permeability zones that indicate areas of lower reservoir quality sandstone; and
- A zone indicating an interbedded shale.
FIGURE 1
Map View of Layer in Geocellular Model (Facies Model and Channel Distribution)
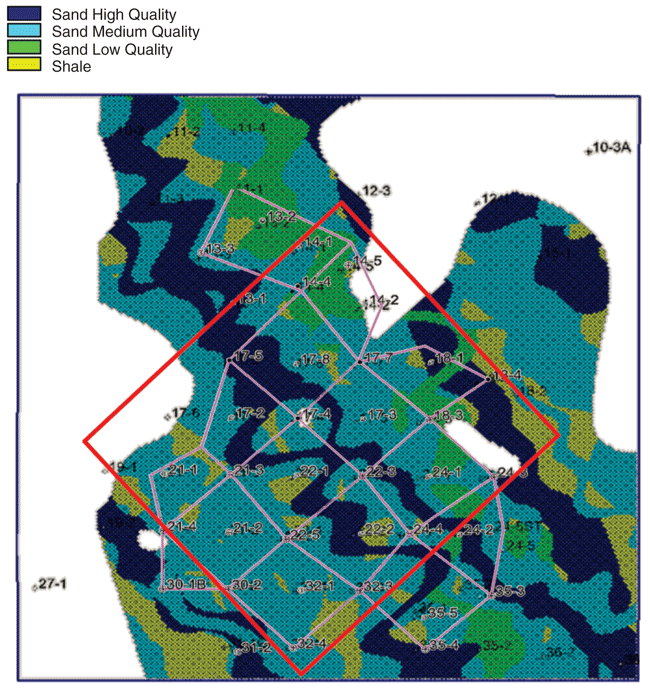
TABLE 1
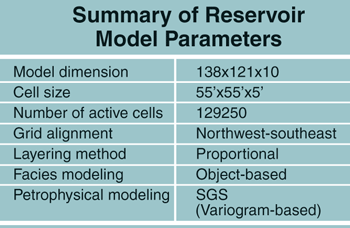
An object-based model was used to spatially distribute the four log facies in the reservoir model. Table 1 is a summary of static reservoir model parameters, while Figure 1 displays a map view of the reservoir model showing the log facies distribution, the survey area (blue box) and simulation study area (red box). Whiting’s CO2 flood patterns are overlaid on the map. A section of the RCP survey area was selected for the simulation study because of the computational limitations and long simulation run time of a full-field model.
The simulation results indicate that vertical heterogeneity plays an important role in fluid movement within the Morrow A and significantly affects simulation results. A heterogeneity characterization technique was employed to investigate vertical permeability variations and sensitivity to flow simulation, while a black oil pressure-volume-temperature (PVT) model simulated the flow from the start of production to the start of the CO2 flood. After achieving a reasonable history match of the production/injection and pressure data, a compositional model was constructed to simulate CO2 injection. The validity of the reservoir model was improved through the compositional simulation history matching process.
Experimental PVT data were used to describe the phase behavior of the multicomponent fluid mixture in response to changes in reservoir pressure. Both black oil and compositional PVT models were constructed for the simulation study. The observed PVT data used for fluid characterization were differential liberation, constant composition extraction, swelling and slim tube test. For the PVT modeling, the number of composition and PVT property components of Postle oil production were reduced and combined into four pseudo components.
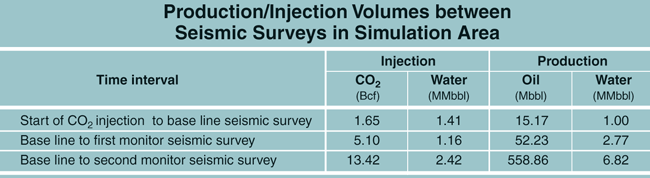
The three seismic surveys were used to evaluate changes in the reservoir as a result of fluid injection and replacement. The base line survey was acquired shortly after the start of CO2 injection in the southern section of the RCP area. The total cumulative amount of CO2 and water injection in the simulation area prior to acquiring the base line survey was 1.65 million cubic feet and 1.41 million barrels of water.
A substantial amount of CO2 and water were injected into the reservoir during the nine months between the base line and the first monitor survey. The second monitor survey was acquired 14 months after the first monitor survey while the reservoir was undergoing production and injection. The injection and production of CO2, water and oil cause saturation and pressure changes, which in turn, affect the acoustic properties of the reservoir. Table 2 shows the amount of production and injection of the different fluids between seismic surveys.
TABLE 2
Flow Simulation, Rock Physics
To quantitatively relate the flow simulation results to changes in seismic properties, the simulation model was coupled with a rock physics model. The objective was to estimate acoustic impedance (AI) and shear impedance (SI) from the coupled simulation/rock physics model and compare the predicted AI/SI changes with the observed impedance obtained from seismic inversion. The changes in saturation, pressure, density and compressibility were taken from the flow and compositional simulation model after history matching and then used in the rock physics model. AI and SI were estimated to account for the reservoir changes taking place between the base line and monitor surveys.
Saturation and pressure changes in the reservoir affect both the compressional and shear wave velocities. Fluids have a greater influence on the p-wave velocity of the rock/fluid system by influencing both the density and bulk moduli. Contrary to p-wave velocity, fluid saturation has a nearly negligible influence on s-wave propagation, assuming the shear modulus does not change with saturation.
Based on the concept of elasticity of porous media, Gassmann’s equation can be used to estimate the saturated bulk modulus, which is related to rock frame bulk modulus, fluid modulus, mineral modulus and porosity. The effect of replacing pore fluids can be obtained through this “fluid substitution” methodology, which provides a successful technique to determine the effects of production-induced fluid changes. It should be mentioned that the Gassmann theory is based on the isostress conditions for an isotropic, homogenous and monominerallic rock at the low frequency limit.
Seismic velocities are affected by fluid saturation in multiple ways. An increase in fluid bulk modulus increases the bulk modulus of the rock/fluid system, resulting in an increase in p-wave velocity. For example, during waterflooding of an oil reservoir, p-wave velocity tends to increase because the bulk modulus of the water is usually higher than that of oil.
Moreover, pressure changes affect the seismic velocities by influencing both fluid bulk modulus and density. An increase in pressure will cause fluid bulk modulus and density to increase. When increasing reservoir pore pressure, both p- and s-wave velocities tend to decrease as a result of pore pressure lowering the dry rock modulus. This means that an increase in pore pressure decreases the differential pressure on the rock frame.
Most of the necessary information for fluid replacement using Gassmann’s equation can be derived from geophysical logs. However, additional information is needed to properly estimate the effects of pressure changes on the dry rock bulk modulus. Therefore, it is important to develop a porosity- and pressure-dependent model for elastic moduli to realistically perform fluid substitution.
The results of previous RCP laboratory work using Postle Field cores and petrophysical data to determine rock properties (including dry rock and shear modulus, and their variations with pressure, fluid saturations and porosity) were used in the fluid substitution process to adjust the calculated dry rock and shear modulus values for porosity and pressure. After determining the relationships between dry rock bulk modulus versus porosity and shear modulus versus porosity, dry rock and shear moduli were calculated using a porosity scaling factor to adjust the calculated values of moduli when porosity is different from the average value.
The relationships between the dry rock and shear moduli at varying differential pressures (i.e., effective stress) for a high-quality rock (high-porosity/permeability) were obtained from the laboratory measurement of ultrasonic core velocities. The same types of relationships were derived for the low- and medium-quality rock for the fluid substitution process. Low-, medium- and high-quality rocks correspond to the three facies in the reservoir model.
FIGURE 2
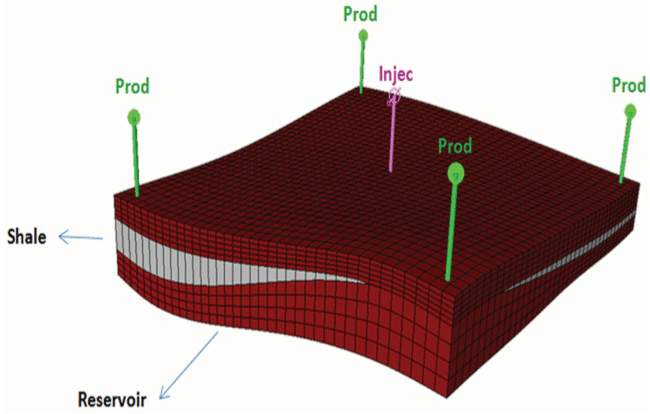
Injection/Production Pattern from Postle Reservoir Model used in
Conceptual Modeling and Sensitivity Analysis
Simulation Scenarios
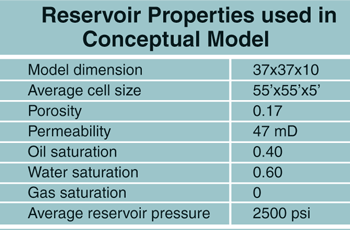
To develop an understanding of the effect of various reservoir dynamic parameters on seismic response, a conceptual model study was performed and several simulation scenarios were tested. The model was built with an injection/production pattern (Figure 2) from the Postle reservoir model using the rock physics model. Table 3 shows the average Postle reservoir properties used in the model. The average injection rates, production rates and operational constraints also were honored.
TABLE 3
Different scenarios were simulated and analyzed to study the effect of CO2 mole fraction, water saturation and pressure on acoustic and shear impedance. These scenarios represented the nine months of injection/production corresponding to the time interval between the base line and first monitor surveys.
The first case simulated the effect of alternating CO2 and water injection on seismic attributes. This is the most realistic case with CO2 WAG injection in the Postle Field. Realistic production/injection rates and operational constraints were used, and the average reservoir pressure was kept constant at ±2,500 psi to map the time-lapse difference for pressure, CO2 mole fraction, water saturation, gas saturation, and the calculated AI and SI percentage changes.
The maximum change in AI is about -3 percent, which is mainly caused by the increase in CO2 mole fraction. The increase in water saturation related to water injection and also a small decrease in pressure around the injector counteract the effect of CO2. An increase in water saturation and a decrease in pressure increase AI. SI is mainly affected by pressure change, with a maximum +1 percent change related to the decrease in pressure around the injector.
The second case simulated continuous CO2 injection on seismic attributes, but with no water saturation effect. Average reservoir pressure was again kept constant at ±2,500 psi. The time-lapse difference maps show similar results to the first case. However, the gas saturation and CO2 mole fraction anomalies around the injector are stronger, reducing AI more than in the first case. It can be concluded that the effect of the CO2 concentration is stronger than the effect of water saturation in a CO2 WAG process.
Another case simulated increasing water saturation on seismic attributes. The time-lapse difference maps show that increased water saturation increases AI. The change in AI is negative (-1 percent) in the entire model, which is caused by a slight increase in pore pressure. However, the decrease in AI is less around the injector where water saturation has increased, reducing the effect of increasing pressure. The small change in the SI corresponds to a small change in the local pore pressure.
A final case simulated increased pore pressure on seismic attributes. The average reservoir pressure was increased by 2,500 psi by water injection. The time-lapse results show that an increase in pressure affects both AI and SI (AI is reduced 3.5 percent and SI is reduced 6.0 percent).
Seismic Attribute Sensitivity
It is difficult to quantify the effect of each dynamic reservoir parameter (i.e., pressure and water saturation) independently on seismic response. Nonetheless, using a conceptual model and the coupled flow simulation and rock physics model, detailed analysis was performed to investigate how seismic-related parameters vary with respect to CO2 mole fraction in oil composition, pressure and water saturation. In all of these simulated experiments, the calculated AI is a percentage change relative to the average AI in the Postle reservoir model prior to CO2 injection.
Achieving a proper understanding of CO2 phase behavior, CO2 saturation and CO2 composition in the oil is crucial in a time-lapse seismic study of a CO2 WAG project. Because of the complex compositional PVT effects of CO2 in oil, an accurate compositional PVT model is required to determine how fluid densities are affected by CO2 mole fraction in an oil composition (which influences AI by altering the densities and velocities of the pore fluids).
FIGURE 3
Fluid Densities versus CO2 Mole Fraction at Different Pressure Ranges
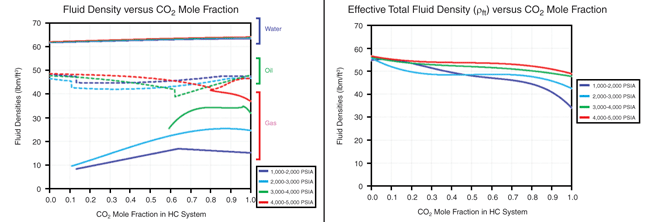
The plot on the left side of Figure 3 displays variations in water, oil and gas densities with respect to CO2 mole fraction in overall oil composition (ZCO2) for different pressure ranges. The right side plot shows the effective total fluid density weighted by saturation, for different pressure ranges.
Considering that CO2 dissolves in water, water density increases uniformly with an increase in ZCO2 for all pressure ranges. Oil density behavior with respect to ZCO2 is different for each pressure range, initially tending to decrease with an increase in ZCO2 for each pressure range.
At a specific CO2 concentration (depending on pressure), there is an abrupt shift in density and then an increasing trend as ZCO2 increases. The CO2 concentration at which oil density starts to increase corresponds to the start of the evolution of a secondary liquid phase in the system. This secondary liquid phase is a result of compositional phase behavior and can occur when the system reaches the critical conditions based on CO2 concentration and pressure.
Gas density also changes with respect to ZCO2 for different pressure ranges. The gas can be considered a secondary liquid phase in the system and behaves like pure CO2. At higher pressures, the density of the gas phase reaches close to the density of oil, which is in agreement with the density profile of pure CO2. The decreasing/increasing oil density can be explained by the swelling and miscibility mechanism of CO2 in the oil.
Initially, CO2 causes the oil to swell, making it less viscous and less dense. After the system reaches the critical condition where a secondary liquid phase is created, oil density increases. Typically, in a miscibility process of CO2 and oil, CO2 interacts and then strips the light and intermediate components. After this process, the remaining liquid oil will be left with heavier, higher-density components.
FIGURE 4
AI and SI Changes versus CO2 Mole Fraction at Different Pressure Ranges
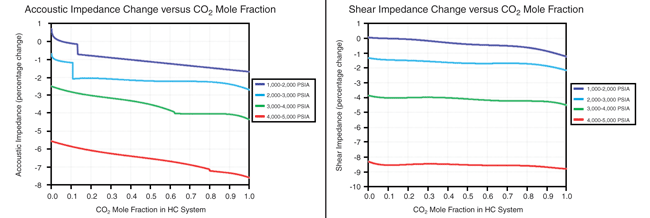
Both AI and SI are affected by effective total fluid density. Figure 4 shows variations of these seismic attributes with respect to changes in ZCO2 at different pressure ranges. CO2 concentration has more effect on AI than SI, although the rate of change in both is similar for all pressure ranges. The maximum AI percentage decrease is about 2 percent for all pressure ranges, while the maximum percentage decrease for SI is about 1 percent. These changes are very small and may be difficult to detect seismically. The shift in AI observed for all pressure ranges is caused by the evolution of the secondary liquid phase, which impacts both the density and compressibility of the fluid system.
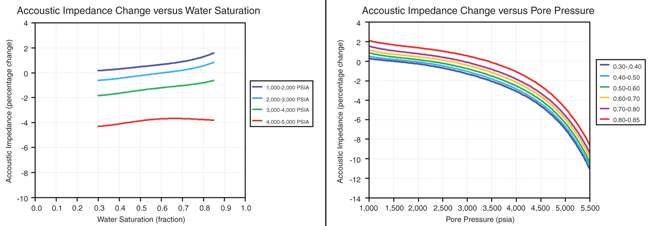
The results show that AI is not significantly affected by water saturation changes for a 1,000-5,000 psi pressure range. The maximum change in AI was around 2 percent for all pressure ranges except 4,000-5,000 psi, where the change was almost negligible as a result of decreased water compressibility at higher pressures.
The magnitude of the change relative to pressure is much larger than the change associated with water saturation. To determine the sensitivity of AI to pressure, excluding the effect of ZCO2, a conceptual model was used to simulate a water injection scenario over a pressure range of 1,000 to 5,500 psi with water saturation ranging from 0.30 to 0.85. AI is considerably affected by pressure, decreasing approximately 11 percent over a 4,500-psi change for all water saturation ranges. Depending on water saturation, the magnitude of the change in AI varies, but the trend is similar with respect to pressure, with an increase in water saturation tending to increase AI.
Results And Conclusions
To directly compare the seismic inversion results with the flow simulation output using the same procedure as in the coupled flow simulation and rock physics modeling, AI was calculated for the base line and first monitor surveys. Figure 5 shows the differences between surveys for CO2 mole fraction, pressure, water saturation, gas saturation, calculated AI and observed AI. The simulation shows pressure increasing between the two surveys, with a maximum change of 800 psi. The change in CO2 concentration occurs around the injector wells. The secondary liquid phase is observed as gas saturation in the reservoir around the injector wells, corresponding to the lighter fluid composition components.
CO2 injection decreases water saturation around most of the injectors by replacing water. An increase in water saturation observed around some injector wells in the southern area is a result of the WAG process. The maximum change in calculated AI is -3 percent, which is mainly caused by an increase in CO2 concentration as miscible fluid replaces water. Calculated AI values are affected mostly by the change in CO2 concentration. However, there is an effect of pressure and water saturation as well. An increase in pore pressure reduces AI, but an increase in water saturation increases AI.
FIGURE 5
Simulation Results with P-Wave Time-Lapse Seismic Inversion (First Monitor and Base Surveys)
The magnitude of the observed changes in AI from seismic inversion is comparable to the calculated AI from simulation. Although the location of the anomalies between the flow simulation and seismic are not in good agreement, the change in AI from the seismic data are in better agreement with the simulated pressure changes. Particularly, the anomaly seen as a north-to-south trend in observed AI in Figure 5 may indicate a sand channel. The direction of this channel feature is consistent with the geological model.
Several conclusions can be drawn from this study. First, the results indicate that for a credible dynamic reservoir characterization, an integration of flow simulation and 4-D seismic is required, which in turn, can be a viable method to guide field operations. However, this process is challenging in thin reservoirs undergoing CO2 WAG injection.
Conceptual modeling also showed that acoustic impedance is affected by changes in CO2 concentration, water saturation, and pressure. Increasing CO2 mole fraction and pressure reduced AI, while increasing water saturation and decreasing pressure increased AI. In CO2 WAG injection, variations in CO2 concentration are the main parameter that changes AI. An increase in CO2 mole fraction resulted in about a 3 percent decrease in AI, which was counteracted by increasing water saturation. Also, a pressure change of +2,500 psi resulted in a -3.5 percent change in AI. These changes are relatively small and may be difficult to detect with seismic.
The study also demonstrates that SI is impacted mainly by pressure changes, with a +2,500 psi change resulting in a -6 percent change in SI. The fluid saturation effect is very small in SI. Sensitivity analysis also indicates that CO2 compositional effects on oil are very complex and depend on CO2 concentration and pressure. The evolution of the secondary liquid phase in the reservoir significantly affects the density and compressibility of the fluid system, and is noted by an abrupt shift in AI.
In addition, the results show that the changes in AI and SI with respect to CO2 may be difficult to detect seismically (the maximum percentage decreases are only about 2 percent in AI for all pressure ranges and 1 percent for SI). While AI is not significantly affected by changes in water saturation, it is considerably affected by pressure changes, decreasing about 11 percent over a 4,500 psi change for all water saturation ranges.
Finally, although it is normally expected that the P-wave anomalies reflect mainly changes in fluid saturation, the interpretation of this production/injection performance and simulation study reveals that pressure changes also affect P-wave anomalies.
AYYOUB E. HERIS is a reservoir engineer at BHP Billiton. He graduated from the Colorado School of Mines in December 2011 after completing a Ph.D. under the supervision of professors Hossein Kazemi and Thomas L. Davis. He was part of the Reservoir Characterization Project and the Marathon Center of Excellence for Reservoir Studies at the Colorado School of Mines. His Ph.D. research focused on integrating flow simulation and multicomponent time-lapse seismic data. Heris holds a B.S. in mining engineering from Sahand University of Technology in Iran and an M.S. in reservoir engineering from the Institut Français du Pétrole in France.
AARON V. WANDLER is a graduate student at the Colorado School of Mines and is part of the Reservoir Characterization Project. His research focuses on estimating the influence of in situ and bore hole stresses on shear-wave velocity using bore hole sonic data. Wandler holds a B.S. in mathematics from Montana State University-Billings and an M.S. in geophysical engineering from Montana Tech.
HOSSEIN KAZEMI is the Chesebro’ Distinguished Professor of Petroleum Engineering at Colorado School of Mines and co-director of the Marathon Center of Excellence for Reservoir Studies. Kazemi is a member of the National Academy of Engineering, and a distinguished and honorary member of the Society of Petroleum Engineers. He has served as a distinguished author and speaker for SPE, and was the director of production research, manager of reservoir technology, and an executive technical fellow at the Marathon Petroleum Technology Center in Littleton, Co., before retiring in 2001. Kazemi holds a B.S. and a Ph.D. in petroleum engineering from the University of Texas at Austin.
THOMAS L. DAVIS is a professor of geophysics at the Colorado School of Mines and director of the Reservoir Characterization Project. He is an organizer for the Society of Exploration Geophysicists’ technical conferences, workshops and continuing education programs, and has served as SEG’s second vice president, technical program chairman, and distinguished lecturer. Davis is a recipient of the C.J. Mackenzie Award from the Engineering College of the University of Saskatchewan, the Milton B. Dobrin Award from the University of Houston, and the Dean’s Excellence and Melvin F. Coolbaugh Memorial awards from the Colorado School of Mines. He holds a B.S. in engineering from the University of Saskatchewan, an M.S. in physics from the University of Calgary, and a Ph.D. in geophysical engineering from Colorado School of Mines.
For other great articles about exploration, drilling, completions and production, subscribe to The American Oil & Gas Reporter and bookmark www.aogr.com.