


Approach Predicts Troublesome Frac Stages
By Eric Romberg, Aaron Fisher, Chris Niedz, Brian Wehner, Joel Mazza and Alex Zhou
DENVER–Tracker Resource Development III holds a block of 26,000 contiguous acres in the southeastern Midland Basin, where it is deploying a 3-D reservoir model to develop the Wolfcamp formation using laterals often exceeding 10,000 feet in length. From an early field planning stage, Tracker has attempted to identify and reduce risks to field development economics, including a large variance in production results, unproductive sections of carbonate within the target zone, and casing failures and completion problems related to high treating pressures.
To mitigate completion risks, Tracker is applying machine learning methods using geomechanical collected at or near the drill bit, wellbore trajectory and stage-level completion data to develop models capable of predicting which stages are at risk of completion difficulties. Tracker collected drill bit geomechanical data on 26 laterals, several of which had experienced various problems during completion. Based on data from these wells, engineers developed two objective proxies for trouble stages: a high fracture gradient and low sand placement.
To predict end-of-treatment fracture gradients and sand-to-water ratios of each stage, the data first was subdivided by target horizon to ensure the model results were not skewed toward a specific horizon and the models then were cross-validated, hyperparameter-tuned, and tested against a subset of the data that had been withheld from the training algorithm.
Multiple metrics were applied to measure the effectiveness of the models. For the fracture gradient regression, a model that minimized the root mean squared error (RMSE) was chosen. This model was compared with a prediction that each stage would have a fracture gradient equal to the average fracture gradient. The correlation between predicted and measured frac gradients also was calculated. These metrics were analyzed for both the entire dataset and the test data subset. By all these measures, the model performed significantly better than the control prediction.
For the sand-to-water ratio metric, the model that maximized the receiver operating characteristic area under the curve (ROC-AUC or AUC) score was chosen. The model’s success was measured by the precision of its predicted outlier (trouble) stages on the test data subset. The model performed with a precision of at least 73%. Both models identified stages where casing failures had occurred.
By predicting the probability of a trouble stage, mitigation plans can be implemented pre-emptively to reduce completion costs. By further analyzing the models, engineers can identify the major drivers for the trouble stages and work to reduce them as early as the well planning stage.
Horizontal Well Planning
Tracker Resource’s acreage block is situated along the Reagan and Irion county line near Barnhart, Tx. In this area, the Wolfcamp B and C intervals often contain significant amounts of slope sediments and carbonate debris flows that can cause drilling and completion issues. The company uses a depth-converted 3-D reservoir model (consisting of seismic data, cores, log suites from pilot wells, and log and well data from offset horizontal and vertical producers) to map a sequence of stacked landing targets and plan horizontal wellbores.
Wells are planned in 3-D depth using a combination of multiple stochastic inversions and neural network-derived geologic models. Acoustic impedance also is very helpful in identifying carbonate debris flows (high impedance) as well as intervals with high porosity and total organic carbon. Wellbores are planned to avoid geohazards (i.e., interpreted faults, prominent lineaments and dissolution collapse features), optimize exposure to the high-porosity, high-TOC intervals, avoid carbonate debris flows and drill with minimal to no dip changes.
Co-blending seismic features of similarity and curvature has yielded a new tool for identifying faults and fractures not easily seen in seismic cross-sections. Tracker evaluates the pre-completion well bores for any lineaments or trends seen in the 3-D volume. Completion engineers are given the depth intervals where any disturbance was identified and relay that information to field engineers during completion. If these identified stages are problematic during treatment, decisions easily can be made to change the completion design or simply move on to the next stage.
Geomechanical data collected while drilling further reduces risks during plug-and-perf completions. Treatments are planned to reduce variations in minimum horizontal stress (Shmin) within each stage. The geomechanical data also identifies carbonate debris flows within the well path, allowing completion engineers to bypass rock considered unproductive.
Even with robust 3-D modeling and well planning, however, Tracker’s wells have encountered difficult stages with high breakdown pressures, high pumping pressures and the inability to place proppant. On a few occasions, drilling out all plugs was not possible because of casing obstructions, possibly related to fault activation during stimulation. The operator began analyzing curvature and similarity volumes for potential fault/fracture identification near the difficult completion stages and compromised casing intervals.
Completion Challenges
Tracker drilled and completed 28 Wolfcamp horizontal wells in Irion County between February 2017 and November 2019. The development proceeded in three phases with eight wells in phases one and two, and 12 wells in phase three. While drilling out composite frac plugs, casing obstruction was encountered on six of the 28 wells (two wells in each of the three phases). These obstructions limited the working internal diameter of the production casing and either prevented or inhibited access beyond the obstruction.
On two of the wells in phase one, conventional drill-out assemblies were not able to pass the obstructions. Several unsuccessful attempts were made to dress off the obstructions, but multiple frac plugs had to be left in wellbores. These wells underperformed expectations by 15%-60%.
After these issues were observed on the early wells, several mitigation strategies were implemented for phase two and three wells, including:
- No stage would be re-perforated. On early wells, stages routinely had been re-perforated if high initial treating pressures were encountered (stages with critical failures had been re-perforated two to three times).
- After identifying a correlation between an exceedingly high post-frac gradient and high overall stage fluid treatment volume, stages were limited to ~55% over the design.
- The 5½-inch, 17-pound/foot HCP-110 casing was changed to heavier-wall, 20-pound/foot HCP-110 to increase internal yield and collapse by 18% and 21%, respectively. Heavier-wall casing was installed on wells 16-28.
- After conducting field trials of several dissolvable plugs, a preferred design was implemented on the last 25% of the final six laterals.
A combination of mitigation strategies and operational awareness resulted in more preferable outcomes in phases two and three, as shown in Table 1. Obstructions were passed and the laterals were drilled out to an economically acceptable depth on three of the four wells with casing obstructions (the fourth well is still under evaluation).
TABLE 1
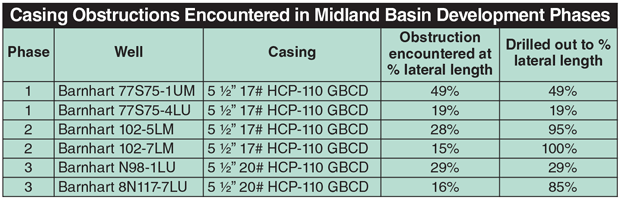
However, despite operating within a standard safety factor of the casing’s expected failure conditions and implementing mitigation techniques, casing obstructions still were encountered that required incremental cost to remediate. In reviewing the data from the six failures, three trends were apparent on casing failure stages:
- High pre- and post-stage fracture gradients;
- Treating difficulty, requiring gel and cross-linked gel to initiate or propagate a hydraulic fracture, and a large volume of treatment fluid to put away the designed proppant volume; and
- With the exception of one well, all the critical failure stages had occurred at 15%-29% of the lateral length on the heel side.
From these observations, it was concluded that critical failures were resulting from a condition that was not easily observable; a condition composed of several parameters likely related to wellbore construction, formation geomechanics, and stimulation treatment design. With this expensive, complex and multivariate problem negatively impacting project economics, the operator sought to develop a systemic approach to reduce risks associated with casing deformation. Because interpreted seismic features had intermittent correlation to completion difficulties, the team chose a geo-informed, data-centered modeling approach incorporating machine learning to delineate possible causes and solutions.
Machine Learning Approach
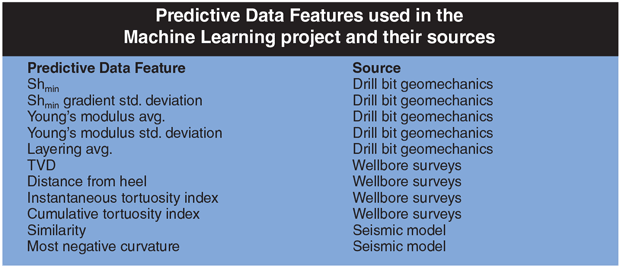
Machine learning requires two categories of features: predictive data features and supervising data features. The predictive data features for the models used in this study came from wellbore surveys, drill bit geomechanics and seismic data (Table 2). The geomechanical data was acquired by a sensor containing an accelerometer and gyro to capture data in three directions (lateral, axial and tangential) at high frequencies. Once a well was drilled, the acceleration data was processed for both isotropic and anisotropic rock properties. Because these measurements were collected at very high resolution, both the average value of the measurement and the standard deviation of the measurement along a stage were included in the models.
TABLE 2
It initially appeared that the most direct machine learning approach for predicting stages at risk of casing deformation was to mark each stage as “casing deformation” or “normal” and set this binary column as the supervising data feature. However, there were only six recorded instances of casing deformation, and restricting the dataset to stages with all the data features of interest left only four recorded casing deformation instances. Trying to directly model this would have led to statistically insignificant results.
Instead, two completion parameters consistent across all the casing deformation stages were used as proxies: a final fracture gradient in excess of 1.0 psi/foot, and a sand concentration lower than 0.89 ppg. With these two proxies identified and enough data points available to give statistically valid results, the machine learning workflow was separated into two phases: predictive modeling and probabilistic results. For the fracture gradient model, the goal was to predict a stage’s final fracture gradient (using RMSE) and the probability that it would be above 1.0 psi/foot (using AUC). Similarly, the goal with the second proxy was to predict a low average sand concentration and the probability that it might occur in a given stage (using AUC for both).
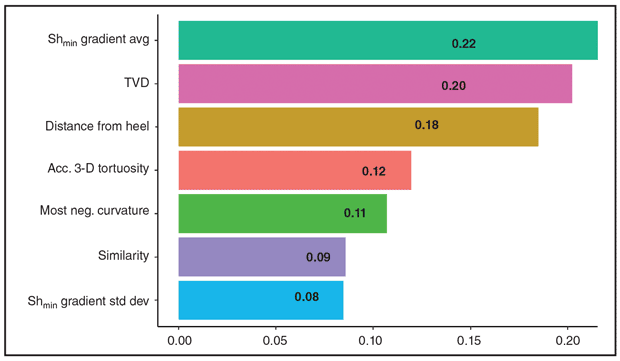
The end-of-stage fracture gradient regression model delivered acceptable predictions when compared with actual results. The RMSE of the model was 0.064 psi/foot (mean RMSE of 0.074 psi/foot). The model ranked the importance of the data features from most to least important as average Shmin gradient, TVD, distance from the heel, cumulative 3-D tortuosity, most negative curvature, similarity, and the standard deviation of Shmin gradient over the stage length (Figure 1).
FIGURE 1
Feature Importance for Fracture Gradient Regression Model
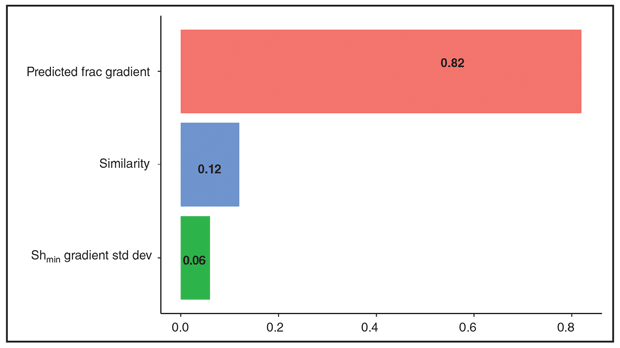
The high fracture gradient classification model received an AUC score of 0.91 and made very few false positive predictions. Because the model was right in predicting high fracture gradient stages, but did not predict all instances of high fracture gradient stages, it had high precision but low recall. The low recall was deemed acceptable since it was believed that some features that caused high fracture gradients (cement quality, plug performance, etc.) were not captured in the predictive data. The model ranked features in descending order of importance as predicted frac gradient from deterministic model, similarity, and Shmin gradient (Figure 2).
FIGURE 2
Feature Importance for High Fracture Gradient Classification Model
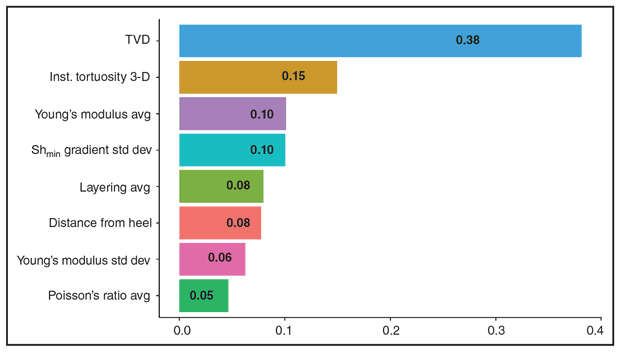
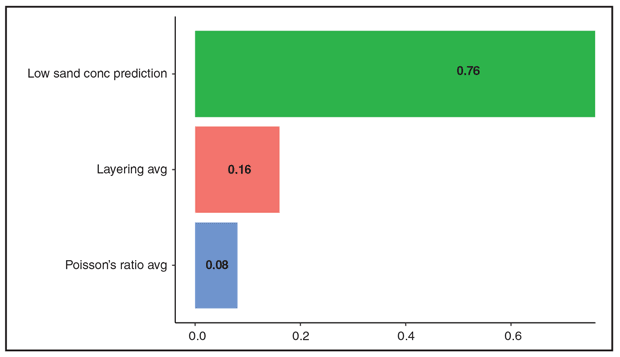
The initial classification model for low sand concentration had an AUC score of 0.84. It ranked the features from most to least important as TVD, instantaneous 3-D tortuosity, average Young’s modulus, standard deviation of Shmin gradient, average layering, distance from the heel, standard deviation of Young’s modulus, and average Shmin gradient (Figure 3). The model for delivering a probabilistic result for low sand concentration had a slightly lower AUC score of 0.75 and a lower false positive rate. It ranked the features in descending order as initial model prediction, average layering and average Shmin gradient (Figure 4).
FIGURE 3
Feature Importance for Low Sand Concentration Classification Model
Predictive Performance
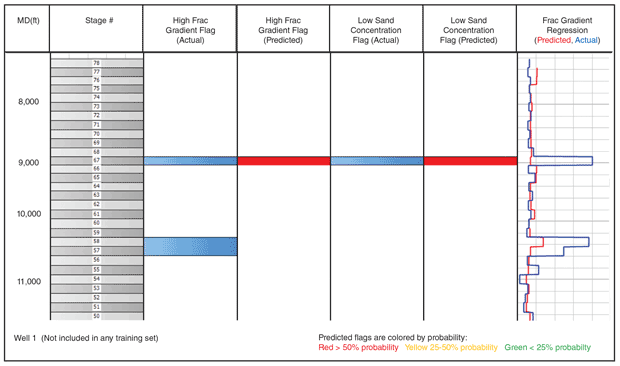
All four models successfully predicted their proxies for casing deformation stages, but could they predict casing deformation? One of the four stages with both casing deformation and a full set of data was not included in the training dataset (stage 67 in Figure 5). The probabilistic fracture gradient model and both low sand concentration models predicted proxies at that stage. While this sample size was too small to give statistically significant results, it was encouraging that the proxies predicted the one instance of casing collapse not in the training set. The final models also correctly predicted both high fracture gradients and low sand concentrations for the casing deformation stages included in the data.
Where the probability models predict that a stage will fall into a proxy category, it should be considered higher risk. Where the combined models predict proxy categories, that stage should be considered highest risk. Further work could combine the different modeled results to quantify the risk of each stage. With risk quantified, the operator would be able to determine the risk level at which further pre-stimulation diagnostics would be needed.
FIGURE 4
Feature Importance for Low Sand Concentration Classification Model
Tracker Resources has conducted pre-stimulation step-down tests on a number of stages, including on two of the six stages with casing deformation issues. The step-down tests show higher instantaneous shut-in pressures and less water hammer effect (pressure oscillations) than step-down tests on other stages in the same wells. This observation implies that a diagnostic step-down test should help identify which high-risk stages pose a true risk of casing deformation. With this information in hand, the operator can take mitigation steps ranging from reducing stimulation volumes to skipping stages.
FIGURE 5
Stage Plot Showing Predicted and Actual Results for Well (Casing Deformation in Stage 67)
Because machine learning does not start with domain knowledge, it can help discover new correlations and root causes in the data it examines. In this study, data was constrained to a relatively small geographic area and a single operator, thus the correlations might be local to the geology, specific to the operator’s processes, or driven by features not captured in the data. However, the models did discover meaningful connections between the data features and the casing deformation proxies that are the subject of further evaluation.
Further Improvements
While none of the models perfectly captured the casing deformation stages, they all did a remarkable job of correctly predicting outlier stages. The nature of these problems and the low frequency with which they occur make them challenging to predict. While the models had low false positive rates, they also had significant false negative rates. In other words, when the models predicted a trouble stage, that stage was most likely to be a trouble stage, but not all trouble stages were identified.
The models primarily used near-wellbore geomechanical data to explain trouble stages, but stage placement in the lateral and wellbore tortuosity affected both proxies. Far-field geologic features impacted the final fracture gradient, but did not change treating pressures enough to affect average sand concentration.
Additional data could further improve the models developed in the Midland Basin study, such as ultrasonic or distributed acoustic/temperature sensing data to provide insights related to stage and perforation cluster isolation. Other potentially useful data features include process zone stress and near-wellbore tortuosity. Stage resolution values for these features could be captured with step-down tests combined with fall-off periods long enough to estimate closure pressures. The variability of process zone stress and near-wellbore tortuosity within a stage might contribute to the unpredicted trouble stages. Studies that include single-cluster completion stages along with other data could enable the development of useful proxies for variability in these data features.
Although the occurrence of casing deformation events along laterals may seem random, the models’ ability to successfully predict their occurrence indicates that these events have physical causes. The multivariate nature of the models points to a complex combination of causal factors. The authors believe the models can be improved by including additional causal variables not available in this dataset. The findings of this study will be used when planning future operations with the intent of mitigating casing deformation.
With proper application of the right subsurface data, operators should be able to implement similar machine learning workflows to predict trouble stages and mitigate casing deformation events.

Eric Romberg serves as completion manager for Fracture ID and as principal engineer for Keban Engineering. As a petroleum engineer and data scientist, his career over the past 15 years has spanned well operations, diagnostic test design, and analysis for a variety of small- to mid-sized independent producers and technologically focused service companies.

Aaron Fisher is the staff geoscientist at Tracker Resource Development III and oversees the daily geological operations of the company’s Permian Basin asset in Irion County. With 15 years of experience, Fisher has worked, planned and drilled more than 350 deviated and horizontal wells in a number of U.S. basins. He holds has a B.S. in geology from the University of Nebraska-Lincoln and an M.S. in geology from Texas A&M University.

Chris Niedz is the drilling and completions manager for Tracker Resource Development III, where he supervised the drilling and completion of the 28 Wolfcamp wells referenced in the Midland Basin study. Niedz has more than two decades of industry experience, and previously served in supervisory and engineering drilling, completion and workover roles at Whiting Petroleum, Continental Resources and Halliburton.

Brian Wehner is the engineering manager at Tracker Resource Development III. With 15 years of industry experience, he has worked in project and operations engineering management for both large public and small private operators in a variety of basins. Wehner holds an M.B.A. and M.S. in finance from the Kelley School of Business at Indiana University and an M.S. and B.S. in mechanical engineering from Iowa State University.

Joel Mazza is the engineering manager at Fracture ID. Over the past 14 years, he has worked in various technical engineering and management roles in the industry, starting his career at Halliburton as a production enhancement engineer and going on to consult both in the field and in-house for operators. At Fracture ID, Mazza leads a diverse engineering group that provides guided solutions to operators seeking to exploit geomechanical properties for optimization of their completion programs.

Alex Zhou serves as the lead data scientist at Fracture ID, where he spearheaded the effort of the analytics solution for drilling optimization and downhole dysfunctions. He previously served in engineering analytics, drilling optimization and energy trading roles at Pioneer Natural Resources, QRI and DC Energy. Zhou holds a B.S. in physics and a Ph.D. in petroleum engineering from the University of Texas at Austin.
For other great articles about exploration, drilling, completions and production, subscribe to The American Oil & Gas Reporter and bookmark www.aogr.com.