


Approach Reveals Insights Into Well Communication, Pressure Interference Issues
By Arman Khodabakhshnejad
HOUSTON–To optimize the economics of unconventional reservoir development, operators must maximize production by drilling horizontal “child” wells on reduced spacing to efficiently drain hydrocarbons from low-permeability reservoirs. However, tighter well spacing can lead to well communication challenges, pressure interference and drainage overlap issues that diminish development economics.
Communication between wells during hydraulic fracturing operations can negatively impact treatment performance by diverting energy (i.e., fluid and proppant) to previously stimulated stages or zones. By generating real-time 3-D characterizations of microseismic events to evaluate the created fracture network, continuous surface and downhole microseismic monitoring provides a unique opportunity to evaluate communication and pressure interference among wells in close proximity.
To this end, a physics-based reservoir model has been developed that integrates microseismic monitoring data with reservoir property measurements to analyze the effectiveness of completion designs and frac treatments, and reveal new insights into communication and pressure interference during stimulation.
Moreover, the model translates the effects of frac hits on short- and long-term production forecasts to enable operators to evaluate the success of treatment designs, improve the production performance of stimulated wells and optimize field development strategies. The workflow is capable of modeling complicated well and completion design scenarios, and easily can be applied to various field development plans to evaluate economics and improve the production optimization decision making process.
The permeability of the reservoir model is derived from microseismic events and recorded rock breakages, accurately describing the location of hydraulic fractures and permeable zones, and indicating potential communicating regions. Once the model is prepared and calibrated using collected field data, it can be used to forecast the production of every well on a pad. In addition to reservoir simulation and production forecasting, decline curve analysis (DCA) is performed to assess the behavior of individual wells under current production conditions.
The technology was applied to a pad in the Appalachian Basin where three dry gas wells were drilled and completed: one in the Geneseo, and the other two in the underlying Marcellus Shale. Microseismic data collected while fracturing the three wells was analyzed, and the event locations, magnitudes and fracture plane characteristics were used to construct a discrete fracture network (DFN). The permeability of a numerical reservoir model was calculated from the generated DFN, and the model was further integrated with available reservoir data.
History matching was then carried out using three years of production data to calibrate the reservoir model, which also was used to predict water and gas production for 30 years. Finally, DCA examined reservoir production behavior.
The microseismic data showed the presence of communication between the pad wells, with frac hits established as more events were recorded in the offset wells, indicating the extent of hydraulic fractures. In addition, the pressure perturbation in offset wells confirmed the presence of a pathway connecting the wells during stimulation. Furthermore, the reservoir model built in the numerical reservoir simulator showed an overlap of drainage volumes. In the reservoir model, the depleted region expands across multilayer formations both laterally and vertically. An analysis of the production behavior of the wells using DCA suggests an almost logarithmic trend, which is expected for these types of reservoirs.
Surprisingly, a detailed analysis of the results reveals no significant deviation in overall well performance associated with interference, especially in the early years of production. At greater than 10 years of production, the expansion of the depleted zone and heightened role of matrix diffusion accelerate the effects of well interference, leading to lower pad performance in the long term. This demonstrates that the enhanced permeability zones created by frac hits have a time-dependent impact on production performance. The study also showed that a well’s location on the pad plays a major role in the magnitude of communication with other pad wells.
Appalachian Project
FIGURE 1A
Eleven-Arm Microseismic Monitoring Array (Three-Well Pad)
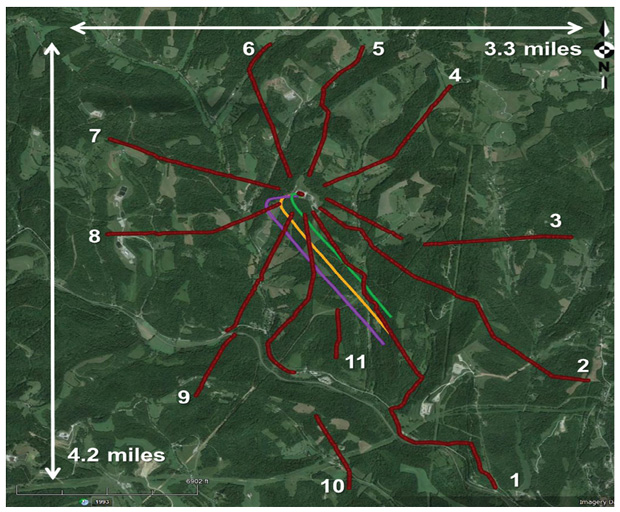
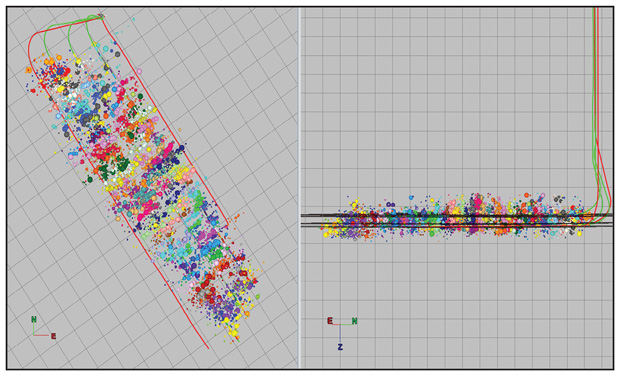
FIGURE 1B
Microseismic Event Distribution Recorded During Stimulation
The goal of the three-well Appalachian Basin project was to evaluate the productivity of the target formation, communication between wells, and the completion strategy for future field development in the area. The Geneseo horizontal–the shallowest of the three wells–was completed first, followed by the two deeper Marcellus Shale horizontals.
Microseismic monitoring was selected to determine the spatial extent of the created fractures and interactions between propagating fractures. As shown in Figure 1A, an 11-arm array covering a 13.5 square-mile area was used to fully capture microseismicity during well treatment. More than 7,000 geophones were deployed to record every event with a moment of magnitude of -3 or higher that occurred during hydraulic fracturing and between stage treatments.
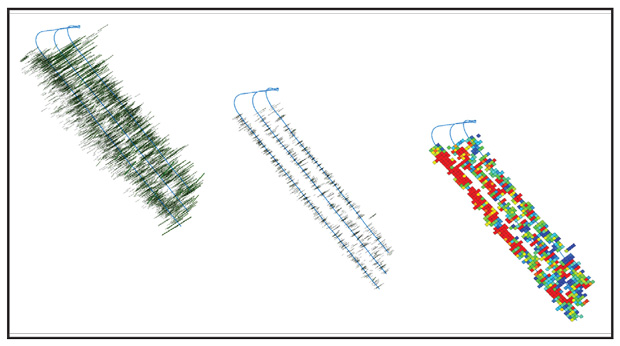
FIGURE 2A
SRV Permeability Distribution from Initial Events
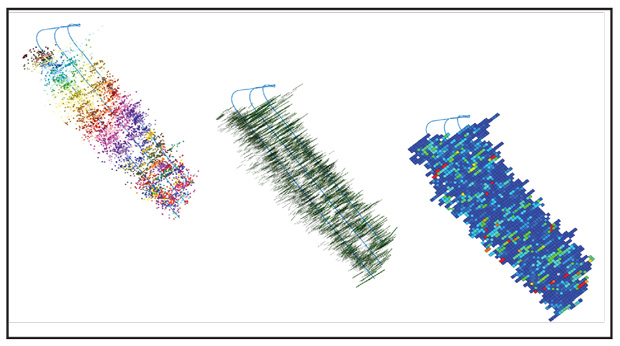
FIGURE 2B
Propped SRV Derived from Calibrated DFN Model
Given the low reservoir permeability and subsequent low leak-off rates, a low-viscous slickwater was used to stimulate the three wells. The treatment volume varied, with wells 2 (Marcellus) and 3 (Marcellus) receiving more fracturing fluid than Well 1 (Geneseo), and the most proppant volume injected in Well 3. Figure 1B shows the events recorded while stimulating more than 140 stages on the pad. The events are color-coded and sized based on the stage and magnitude.
The recorded events were used to generate the DFN, representing the entire fracture network and enhanced permeability area. In the next step, the DFN was filled by proppant from the center stage outward until the total proppant volume was injected to the reservoir. The DFN then was converted to a permeability-enhanced region and adapted for reservoir simulation by placing 100 x 100-foot cells over the entire volume. The proppant-filled cells were subsequently used to calibrate the reservoir model and adjust permeability. Figure 2A shows the SRV permeability distribution from initial events, while Figure 2B shows the propped-SRV derived from the calibrated DFN model
It is important to note that there are two previously treated wells in the area that may have added fractures and enhanced permeabilities at certain locations. However, because microseismic monitoring was carried out only for the three middle wells, the DFN model includes only the events that were recorded during the treatment of the three pad wells.
The highest proppant concentration was observed around Well 1, but the extension of propped volume to the shallower unproductive formation suggests low proppant placement efficiency on this well. Proppant distribution for wells 2 and 3 was contained in the productive zone, which leads to the higher stimulation performance.
Reservoir Simulation
The reservoir simulation model was developed from the normalized permeability to evaluate the productivity of the wells and the success of the well treatment operations. A commercial black-oil reservoir simulator was used to capture potential multiphase fluid flow in the reservoir. The presence of extensive production data, as well as petrophysical and log measurements, allowed the model to be calibrated accurately to reduce uncertainty associated with data scarcity. Using the calibrated reservoir model, each well’s completion was then evaluated along with interwell communication on the pad during production.
The reservoir model was developed based on the “layer cake” geologic model assumption in which each formation consists of multiple layers with uniform reservoir properties throughout the layer. A petrophysical log from a nearby well was used to calculate the properties of each layer, and to initialize the porosity, water and gas saturation, and matrix permeability in the reservoir model.
Fracture permeability is reduced as a result of a drop in pressure and increase in effective closure stress. Laboratory experiments confirmed the stress-dependent permeability decline even in the propped portion of fractures. The unpropped stimulated reservoir volume showed higher sensitivity to elevated closure stress since it was not filled with a rigid material with low compliance to the stress change. The different behavior of stimulated zones was accounted for by generating compaction curves.
FIGURE 3A
Pressure Depletion Map (One Year of Production)
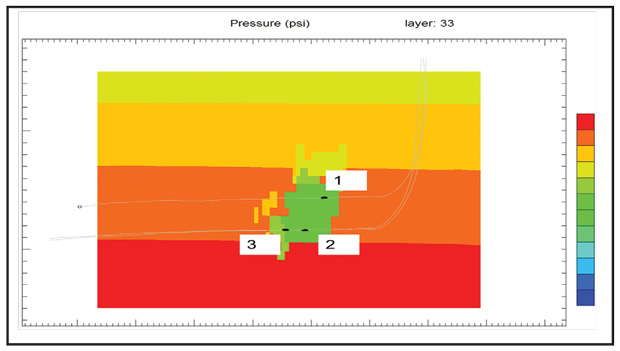
FIGURE 3B
Pressure Depletion Map (Three Years of Production)
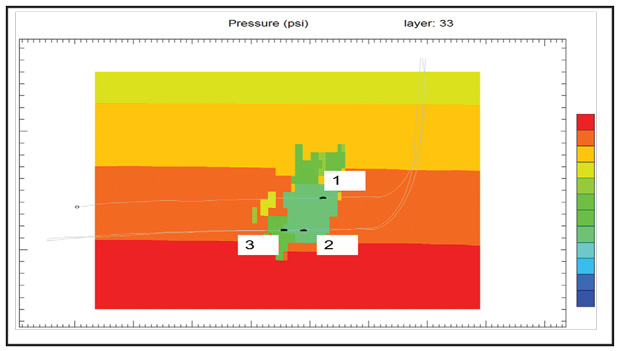
Because the initial reservoir permeability enhancement–derived from microseismic attributes–controls the production capacity of the cells, the model accounts for the high- or low-permeability zones resulting from the stimulation treatment. In contrast to bi-wing symmetrical models, this approach provides a realistic pressure distribution around the wells. The depleted zone calculated from the pressure map reveals the efficiency of each stage’s treatment and allows the completion efficiency for each well and pad to be evaluated.
The treatment efficiency of each stage directly affects the productivity of each cell. Greater pressure drops suggest the presence of productive zones with high treatment efficiency. In contrast, regions with lower pressure decline indicate the presence of low-permeability zones with limited capacity to contribute to production. The model shows an extended depleted zone beyond the SRV of Well 1 in the Geneseo, which results from the upward propagation of fractures from wells 2 and 3 completed in the underlying Marcellus.
However, higher depletion does not necessarily translate into better production, which is the case for Well 1. Although the stimulation of the wells elevates the fracture permeability of the formation sandwiched between the Geneseo and Marcellus, a lack of matrix support reduces the stimulation effectiveness in the formation.
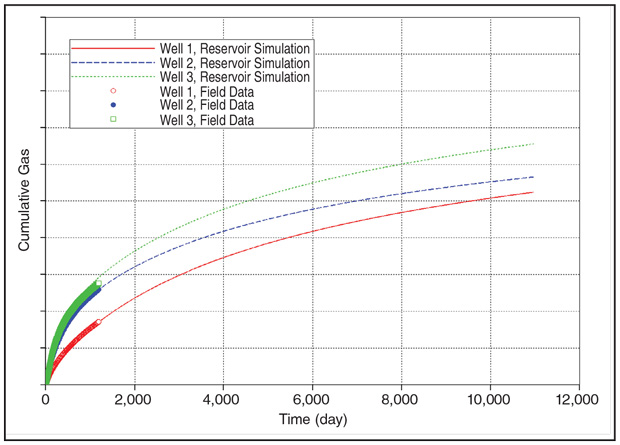
FIGURE 4
Cumulative 30-Year Gas Production Forecast
Figures 3A and 3B show the cross-section view of the reservoir. The overlap of the drainage zones indicates the well communication and production performance reduction. Minor changes in the pressure distribution after one year and three years of production indicate uniform production from the entire stimulated zone starting from early times.
The calibrated reservoir model then was used to forecast gas production for 30 years, as well as pressure distribution in the reservoir. Figure 4 shows the cumulative gas production forecast for all three wells. Well 3 is the best producing well, followed by Well 2. The greater overall productivity of wells 2 and 3 is attributed to the higher Marcellus matrix permeability and flow support compared with the Geneseo.
FIGURE 5A
Reservoir Cross-Section View of Forecast Pressure Depletion (Five Years of Production)

FIGURE 5B
Reservoir Cross-Section View of Forecast Pressure Depletion (30 Years of Production)
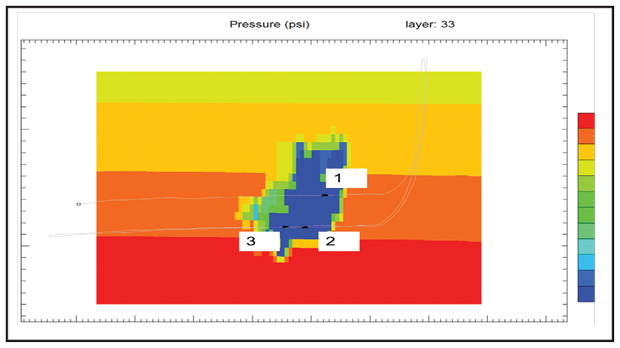
Figures 5A and 5B show the pressure distribution after five and 30 years of production, respectively. The lower pressure in the toe-ward section of the wells indicates the high-efficiency treatment of the wells, which is a result of the presence of the natural fracture system in place. Figure 5B shows the extension of the depleted zone to the entire stimulated volume. It indicates that the increase in well spacing reduces well communication and potentially improves production performance.
Decline Curve Analysis
DCA was performed for each well to evaluate the impact of well communication on production. Three phases of production can be observed in the DCA results: early, transient and late. Early production extends from two weeks for Well 1 to almost three months for Well 3. The reservoir underperforms at early times, which could be attributed to initial fluid flowback. After the start of the transient phase, the production decline rate follows a linear trend in the log-log plot for all wells, as predicted by DCA. A higher production decline rate is observed after several years of production. Although all wells exhibit lower production performance in late time, the extent of the production drop varies between wells.
Comparing reservoir simulation and DCA results sheds light on the underlying mechanisms that occur during production. The analysis starts with the reservoir simulation, which quantifies the production capabilities of the well, interwell communication and pressure interference with nearby wells. The short- and long-term effects of well interactions are captured using the reservoir simulation. On the other hand, decline curve analysis is established based on the wells’ production histories, with a deficiency to account for well interactions.
Compared with the DCA model, reservoir simulation shows that wells 1, 2 and 3 have 18, 20 and 9 percent lower late-time cumulative gas production, respectively. Wells 1 and 2 exhibit a higher drop in EUR, which indicates stronger well communication. The deviation of reservoir simulation results indicates the presence of communication between wells, lowering the pad’s overall production performance.
Frac hits during stimulation treatments not only impact the short- and mid-term production, but the established fracture connections between wells also results in a long-term reduction of production and higher decline rates with lower well EURs. This highlights the importance of constructing a realistic reservoir model with accurate permeability distribution so that well interaction is captured to avoid under- or overestimating production.
This case study applied an advanced workflow to quantify the short- and long-term interaction between wells on the overall production of the pad, leveraging the presence of the vast reservoir and production data. An integrated microseismic to reservoir simulation approach was used to unravel underlying mechanisms, normally overlooked if only a single data source is utilized. The workflow could be employed readily in future field development plans for unconventional oil and gas reservoirs.
The advanced workflow quantified how both short- and long-term interactions between wells impacts pad production. The microseismic-derived permeability model, calibrated with reservoir data, successfully modeled the production behavior of the three wells, and a comparison of DCA and reservoir simulation results revealed no significant deviation in overall well performance associated with interference during the early years of production.
Frac hits and interwell communication generally have been considered damaging to well performance. However, by leveraging the advanced workflow to quantify how interactions between wells impact production, modeling on the three-well pad shows that communication during fracturing may not significantly impact short-term production, although the expansion of the depleted zone over time accelerates well interference. This ultimately leads to lower long-term pad performance.
The results of the study suggest that increasing well spacing could improve the stimulation performance of the reservoir while retaining the production efficiency of the pad. In addition, the study highlights the importance of a thorough examination of the fracture network along with the reservoir properties to evaluate the potential impact of frac hits on reservoir production.
ARMAN KHODABAKHSHNEJAD is a reservoir engineer at MicroSeismic Inc. in Houston. He joined the company in 2018 after working as a geomechanics specialist for more than two years. Khodabakhshnejad is an integral part of MicroSeismic’s completion evaluation team, which offers advanced modeling, interpretation and insights on well performance and provides recommendations for optimizing treatment plans. Khodabakhshnejad holds a master's in reservoir engineering from Sharif University of Technology and a Ph.D. in petroleum engineering from the University of Southern California.
For other great articles about exploration, drilling, completions and production, subscribe to The American Oil & Gas Reporter and bookmark www.aogr.com.