


Ceramic Microproppant Yields Production Uplifts, Flattened Decline Curves
By Carl T. Montgomery, Michael B. Smith, and William E. “Bill” Strobel
TULSA–The difference between the hydraulic fracture area, or the portion of rock stimulated by fluid injection, and the propped fracture area, or the portion that accepts proppant, can be significant in low-permeability unconventional reservoirs. The unpropped area has natural flow capacity that diminishes as the reservoir is produced, causing steep decline rates that typically average 60%-70% during a shale well’s first year of production.
The ability to place proppant in primary and secondary natural and induced hydraulic fractures, and to keep them propped open during production, is critical to sustaining long-term productivity and reducing the high decline rates. A fracture’s natural flow capacity is diminished over time by increasing effective stress on the rock matrix as a well is produced and reservoir pressure declines, and by the phenomenon of rock “creep” when a low-permeability unconventional formation is subjected to stress loads.
Introducing a very small-sized proppant into the narrow stimulated fracture system enhances the stimulated fracture network’s natural flow capacity and conductivity.
Proppant Perspectives
The general rule of thumb is that the fracture width must be three times the mean particle size of the proppant trying to enter into it. For example, the fracture aperture needs to be wider than 0.5 millimeters (0.02 inches) to accept 100-mesh proppant. While 100-mesh proppant is approximately 300 microns wide, microproppant is only 70 microns wide. The settling velocity of microproppant is much slower than 100-mesh sand, which allows it to be placed in very narrow fractures and transported much deeper into a fracture to dramatically increase long-term conductivity.
FIGURE 1
Effects of Microproppant on Post-Frac Production (Left) And Reservoir Drainage (Right)
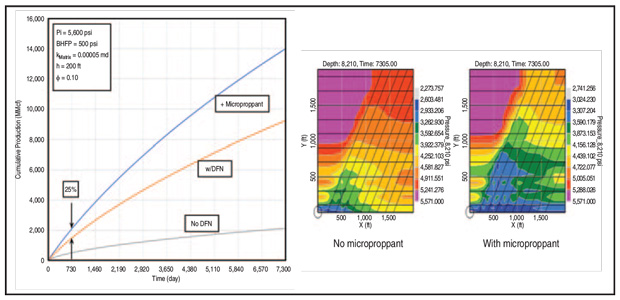
To assess the production benefits associated with microproppants, a new discrete fracture network model was developed that includes dynamic proppant transport analysis to identify the results of using microproppant in shale reservoirs (Figure 1). The study has documented significant production uplifts and flattened decline curves in the Barnett, Woodford SCOOP, Utica, and Wolfcamp A and B benches using a very strong, perfectly spherical man-made ceramic microproppant with a very high crush resistance of 60,000 psi.
In addition to improving the effective propped area, several additional benefits have been observed, including “scouring” of the near-wellbore area to lower treatment pumping pressures, far-field diversion to prevent parent/child well fracture hits and reduced convergent flow effects.
FIGURE 2
Delaware Basin Treating Plot Showing Diversion and Formation Abrasion
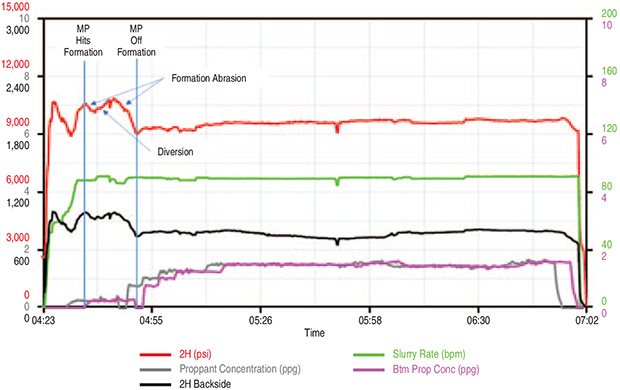
The scouring and far-field diversion effects are supported by field data. Figure 2 shows a treating plot from one stage in a 44-stage, six-cluster fracture performed in the Delaware Basin. The red line is the surface treating pressure, while the green line is the pump rate. Because the treating string is loaded with the same proppant concentration and the pump rate is almost constant, it is believed that the surface treating pressure is a fair representation of downhole pressure behavior. The point that the microproppant arrives at the perforations and the point at which it is fully displaced are noted on the plot.
When the microproppant hits the formation, there is a drop in treating pressure, followed by an increase, and then another sharp drop. It is believed that the initial pressure drop is related to near-wellbore rock abrasion. The following pressure increase is attributed to bridging and diversion into one or several of the clusters or secondary fractures. Finally, the sharp drop is the result of additional rock abrasion in the new clusters or fractures that were opened by the increased pressure. Note that the pressure drop spike in the middle of the micropropped stage appears to be a change in pump rate rather than a reservoir response. While Figure 2 shows only one stage, most of the 44 stages in this well exhibited the same behavior.
Pressure Behavior
Figure 3 is a treating plot from a micropropped well in the SCOOP play in Oklahoma. The treating pressure drop between flags 1 and 2 was caused by hydrochloric acid reacting with near-wellbore rock during prefracturing perforation cleanup operations. The treating pressure drop between flags 2 and 3 denotes when the microproppant was being pumped across the formation. As seen in the wells treated in the Delaware Basin, there also appeared to be some cluster or fracture diversion, as evidenced by the pressure spikes and break backs. Again, this behavior was observed consistently on the stages pumping microproppant.
FIGURE 3
Woodford SCOOP Treating Plot Showing Formation Abrasion
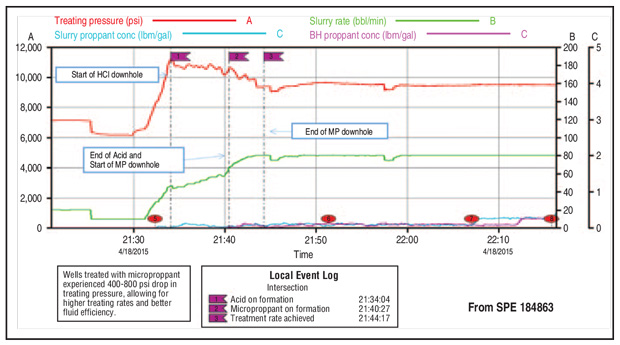
Discussions with the operator indicated that the main reason the microproppant was used was to reduce pressure screen-outs and allow increased pump rates to improve fluid efficiency, and therefore, expose more rock area. Only after the wells had produced for about six months did a production improvement become apparent.
This treating pressure behavior appears to be formation-specific. Wells treated with microproppant in the Marcellus also exhibited this behavior, but treatments in the Utica did not. This may be explained by differences in the horizontal stresses where the Marcellus and Utica exhibit less near-wellbore tortuosity.
The third proposed mechanism for improving production with microproppant is to reduce the near-wellbore pressure drop related to convergent flow. Microproppant erodes the rock near the wellbore, which can provide channels of improved conductivity around the borehole, theoretically reducing the near-wellbore “choke” caused by the fracture adjusting to far-field stresses as it moves away from the hoop stresses.
Manufactured as a dry solid, microproppant has been pumped in slurry form in slickwater frac treatments in hundreds of U.S. wells. Microproppant does not contain silica, so there is no silicosis dust hazard. The slurry composition varies, but is generally an aqueous solution of a viscosifying agent and microproppant. The microproppant concentration target is 65% by weight of solution. This translates into roughly 8.2 pounds of microproppant per gallon of slurry.
A microproppant slurry is viscous and develops a static gel strength. The density of the slurry is 13.5-13.6 pounds per gallon. Totes or ISO tanks are used to transport the slurry to a well location. In the field, the microproppant slurry flows easily out of ISO tanks through a 3.0-inch valve and hose attached to a centrifugal pump to provide boost pressure. The slurry is pumped into a missile manifold, where it is proportioned in the frac fluid by varying the microproppant concentration added by slurry to the total fluid rate. Initially, the material was added into the pad at a concentration of 0.1 pound/gallon, but to minimize water usage, concentrations as high as 0.7 pound/gallon are being used now.
In addition to pumping the microproppant slurry from an ISO tank or tote container with a centrifugal pump, microproppant can be introduced into a well by pulling the slurry from the tank/container with the blender’s suction pump and adding the microproppant at design concentration on the fly with the rest of the incoming water from the frac tanks. The slurry can be pumped by all pumps or a bank of pumps designated for pumping proppant during any given stage or frac. Another alternative that may reduce transportation and product cost is to add microproppant as a dry material to the sand hopper through a silo or box system.
Field Applications
Field applications in multiple shale basins demonstrate the potential to improve productivity by pumping microproppants as part of the well completion design. One of the earliest applications was an 11-well trial in the Barnett Shale in Wise County, Tx. Four of the wells were micropropped. They had lateral lengths between 3,792 and 5,252 feet. The remaining seven offset wells were used as control. They had lateral lengths between 3,952 and 6,124 feet.
In these treatments, 4,200 pounds of microproppant were mixed in a liquid slurry and added to the pad at a concentration of 0.1 pound/gallon. Comparing the average cumulative production in barrels of oil equivalent normalized to a per-lateral foot basis, all 11 wells started at about the same point, but the four wells with microproppant soon began to separate themselves from the seven offsets and the production uplift continued to improve with time. These results are consistent with the concept of microproppants creating a larger, conductively propped fracture area.
In one application in the Woodford SCOOP play, the operator micropropped seven horizontal wells that were offset by 12 wells that did not use microproppants. In each of the seven wells, 4,200 pounds of microproppant were added as a liquid slurry into the pad at a concentration equivalent to 0.1 pound/gallon. The production data was normalized again to boe per 1,000 feet of lateral.
Unlike the Barnett wells, it took several months before the SCOOP wells treated with microproppant began to outperform the offsets, but after 12 months, the results became remarkable. After 24 months, the seven micropropped wells had a 72% production uplift compared with the 12 offsets. That increased to 81% after 36 months.
Reducing treating pressure was the main reason the operator elected to use microproppants. The pressure limit on the wellbores was 11,500 psi, but the microproppant eliminated 800-1,100 psi of treating pressure, allowing treatments to be placed at higher pump rates to improve fluid efficiency and expose more rock.
FIGURE 4
Cumulative Production per 1,000 feet of Lateral (Woodford SCOOP Nine-Well Test)
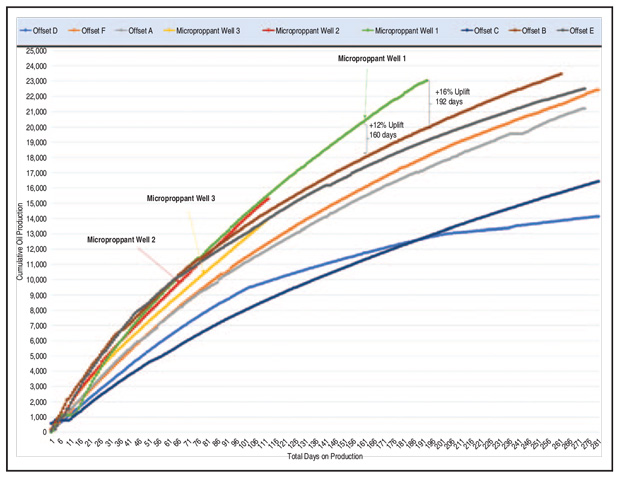
In another Woodford SCOOP application, a group of nine wells was selected carefully to keep the geology and well geometries and orientations as consistent as possible. Three micropropped wells and six offsets were completed in the oil leg of the Woodford. All wells were completed with 20 stages pumped at a rate of 80 bbl/minute. Each stage used 120,000 pounds of 100-mesh sand followed by 371,000 pounds of 40/70-mesh sand with a mixture of guar and friction reducer as the carrying fluid. On the three wells receiving microproppant, 8,200 pounds were pumped in the pad of each stage at an average concentration of 0.45 pounds/gallon.
The normalized cumulative oil production for all wells is shown in Figure 4. Again, the microproppant wells initially behaved like the offset wells, but then began to separate as the lower decline rates and higher production became evident.
Utica And Marcellus Wells
In Eastern Ohio, where the Utica Shale is located at a true vertical depth of ±7,500 feet, an operator micropropped two wells and used a third well as an offset. The offset had a 7,845-foot lateral and was fractured with 45 stages spaced 180 feet apart. Each stage had five clusters spaced 36 feet apart. The first micropropped well had a 5,742-foot lateral and was planned to be completed with 44 stages spaced 150 feet apart (five clusters per stage spaced 30 feet apart). However, several pressure issues were encountered while completing this well, resulting in fracturing only 39 of the 44 planned stages. The second micropropped well had a 7,341-foot lateral and 48 planned stages spaced 150 feet apart (five clusters per stage spaced 30 feet apart). However, one stage near the heel of the well had to be skipped, leaving 47 fractured stages.
Looking at cumulative production, the 39- and 47-stage micropropped wells had respective oil production uplifts of 5% and 16% after 200 days compared with the offset well. After 374 days, the two micropropped wells produced 8% and 22% more oil, respectively, and 11% and 27% more gas than the offset.
In the Marcellus, microproppant was tested in 16 wells on two pads in Pennsylvania (six micropropped wells and 10 offsets) and 14 wells on four pads in West Virginia (seven micropropped and seven offsets). All micropropped wells were treated with 7,500 pounds of microproppant per stage, with 50-60 stages completed in each well.
Cumulative initial production data through the first 14 months for the Pennsylvania wells and the first eight months for the West Virginia wells show that the micropropped wells performed basically on par with the offset wells without microproppant. These results suggest that the productivity benefits of pumping microproppant may be less pronounced in the Marcellus, where the microfracture structure is very limited and it is difficult to create fracturing complexity.
FIGURE 5
Cumulative Production per 1,000 feet of Lateral (Delaware Basin Wolfcamp Three-Well Test)
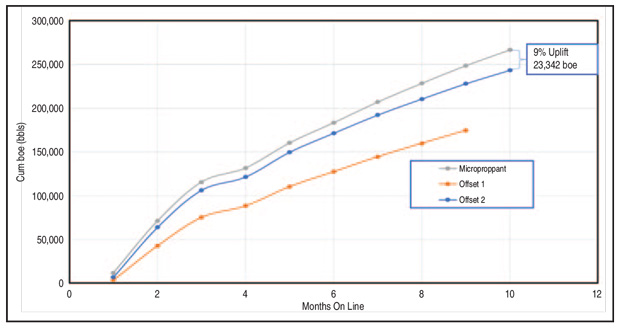
Five microproppant field tests are under way in the Permian Wolfcamp play. While the wells in four of these tests have not been on production long enough to provide definitive data, the preliminary results are encouraging. The fifth field test is a three-well project in the Delaware Basin. Figure 5 displays the normalized production data through the first 10 months for one micropropped well and two offsets.
The documented results of horizontal well applications in multiple shale basins underscore the advantages of pumping microproppants as part of a completion design strategy. Initial production declines in the first year of a well’s life are caused by the depletion of the natural fracture network and the loss of the stimulated fracture network’s flow capacity. Placing microproppant deeper into the formation and into narrow fractures to keep them propped open over time as wells produce enhances long-term conductivity to optimize productivity, increase reserves recovery and flatten decline curves.
Editor’s Note: The preceding article is based on SPE 199741, “Utilizing Discrete Fracture Modeling and Microproppant to Predict and Sustain Production Improvements in Nano Darcy Rock,” a technical paper originally prepared for presentation at the Society of Petroleum Engineers’ Hydraulic Fracturing Technical Conference & Exhibition, held Feb. 4-6 in the Woodlands, Tx.

CARL T. MONTGOMERY is a stimulation technical expert at Tulsa-based NSI Technologies LLC, which provided the StimPlan™ software used for discrete fracture network modeling and analysis of the microproppant field tests. Montgomery specializes in all areas of stimulation, cementing, sand management, conformance control, perforating and formation damage. A former Society of Professional Engineers’ distinguished lecturer, he served at ConocoPhillips, Arco and Dowell Schlumberger before joining NSI. Montgomery holds a B.S. in biochemistry from Colorado State University and an M.S. in biochemistry from Ball State University.

After graduating with a Ph.D. in mechanical engineering (rock mechanics) from Rice University in 1974, MICHAEL B. SMITH joined Amoco Production Research. At Amoco, he worked for Bob Fast, one of the pioneers in hydraulic fracturing. He later co-founded NSI technologies. During his career, Smith has conducted fracture treatments in more than 30 countries, and has authored almost 100 technical papers and one textbook (Hydraulic Fracturing). Among his industry awards, Smith was named a Society of Petroleum Engineers Legend of Hydraulic Fracturing.

WILLIAM E. STROBEL is president of Zeeosphere Ceramics LLC in Lockport, La., which manufactures the Deeprop® 1000 microproppant used in the field test wells. He has served as chief executive officer or president of several venture-backed technology and public companies, including a Fortune 500 company. During his career, Strobel has identified, negotiated and integrated six acquisitions. He has substantial global experience in finance, manufacturing, sales, marketing, product development, and business planning in operational roles. Strobel holds a B.B.A. from the University of Texas at Austin and an M.B.A.
For other great articles about exploration, drilling, completions and production, subscribe to The American Oil & Gas Reporter and bookmark www.aogr.com.