


Ceramic Microproppants Demonstrate Major Benefits In Permian Basin Applications
By Carl Montgomery, Eduard Siebrits, and Bill Strobel
LOCKPORT, LA.—Ideally, every part of a hydraulic fracture in a shale formation should receive proppant. In reality, however, data indicates that typically only about one-third of the fracture area created during hydraulic fracturing is supported by proppant.
This goes a long way toward generally explaining why production from horizontal wells in unconventional plays declines 60-70% in the first year. The unpropped fractures initially have some hydraulic conductivity but it quickly diminishes as the closure stress causes the rock to “creep,” resulting in lost effective fracture conductivity and the characteristic “hockey stick” production decline pattern commonly observed in shale wells.
To get as close as possible to achieving the goal of propping the entire fracture system, the industry is pumping larger proppant and fluid volumes per foot of lateral, shortening stage lengths, and tightening cluster spacing. In addition, more and more completion engineers are also augmenting traditional proppant sizes with ceramic microproppants small enough (500 mesh) to access sections of a propagating hydraulic fracture that traditional 40/70 and 100-mesh proppants cannot while retaining sufficient conductivity on closure.
The proppant settling rate is proportional to the square of the diameter. This means, for example, that engineered microproppants (as small as 25 microns) settle up to two orders of magnitude slower than 40/70-mesh proppants (±350 microns). This allows microproppants to travel much farther in the flow stream and have a more uniformly propped area over the fracture height than conventional proppants.
There also appears to be benefits in completion efficiency. When a microproppant first hits the formation, treating pressure may change. This may be due to near-wellbore rock abrasion (decreased pressure) or temporary bridging and diversion into one or several of the clusters (temporarily increased pressure). The latter has been demonstrated by acoustic imaging in a field test, which revealed a substantial improvement in fluid placement efficiency attributed to the microproppants preventing noticeable flow dominance in perforations.
Field experience demonstrates that adding microproppant to the pump schedule can increase well production by more than 10% while flattening the decline rate. In the Permian Basin, production uplifts of up to 15% have been measured in micropropped wells compared to offsets with conventional proppant sizes. These results can translate into millions of dollars in extra revenue over the full production lifecycle, a boost that can significantly reduce a well’s breakeven costs.
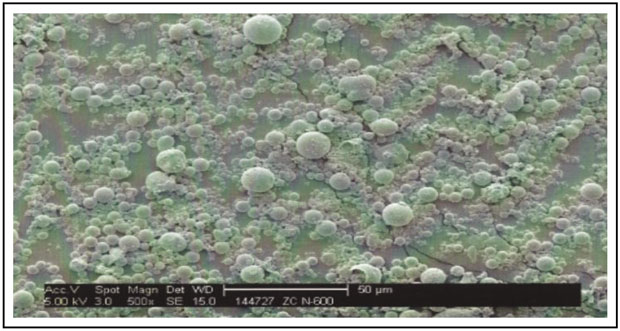
Ceramic microproppants give operators a proven solution for consistently improved proppant transport within the created fracture by significantly reducing the diameter of the injected proppant particle without sacrificing material strength. The engineered microproppant is small, extremely strong (crush resistance of 60,000 psi), and perfectly spherical. A scanning electron microscopic image of the particles is shown in Figure 1.
FIGURE 1
SEM of Microproppant Particles
Industry Trends
Average lateral lengths continue to increase in shale plays to expose more rock for stimulation, but that does not help improve the effective propped fracture area. Regardless of lateral length, the industry recognizes the need to generate as many conductive fractures as possible, leading to pumping more proppant and fluid per lateral foot, increasing stage counts, and ramping injection rates to move proppant deeper into the created fracture.
It is also interesting to note that a substantial part of the frac spend on a typical Permian horizontal well completion is for proppant, water, and chemicals, yet most of the industry’s effort is focused on improving treatment logistics. The key performance indicators tend to focus on getting more stages pumped quicker and moving to the next location. This ignores the reason a treatment is being conducted in the first place: improve the productivity of the treatment. The focus should be on the ultimate goal of making the ratio of effective fracture area over the created fracture area (E/C ratio) as close to unity as possible.
Microproppant Application
A major oil and gas company completed a test to determine if ceramic microproppant would improve the completion efficiency of its frac treatments. The study consisted of a four-well study in which 18 of a total of 87 stages in two wells were treated with microproppant. One of the micropropped wells used a 10-cluster/stage perforation design where each cluster received had a total of 30 perforations and was treated with 420,000 pounds of 100-mesh sand. In addition to the 100-mesh sand, nine of the stages included 10,604 pounds of microproppant pumped at a concentration of 0.25 and 0.5 lb/gal in the pad.
The second micropropped well used a 14-cluster/stage perforation design with the same perforation design and was treated with 588,000 pounds of 100-mesh sand. The stages that included the microproppant were treated with 14,750 pounds of microproppant pumped at a concentration of 0.25 and 0.5 lb/gal.
FIGURE 2
Stages 12 and 13 of 10-Cluster Design
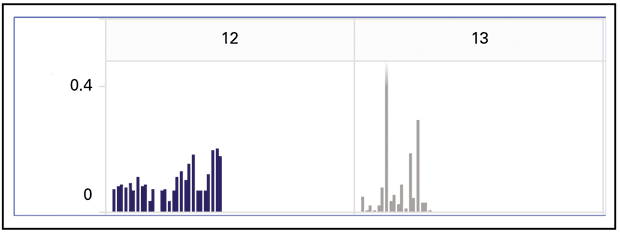
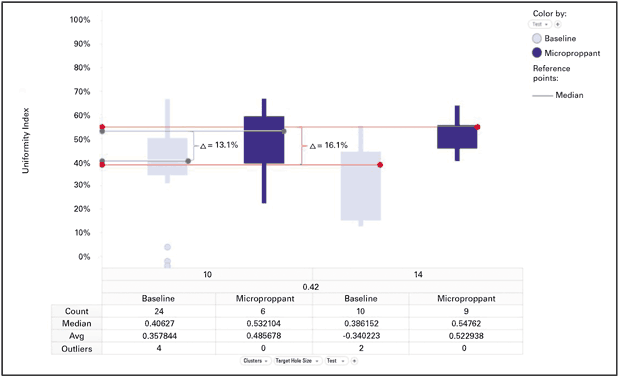
FIGURE 3
Proppant Placement Effectiveness (Micropropped versus Non-Micropropped Stages)
After cleanup, an ultrasonic imaging tool was run to evaluate which stages had more consistent perforation uniformity. Figure 2 shows the results for two adjacent stages: 12 and 13. The vertical axis represents the eroded area of the perforation. The initial perforation size was 0.42-inch, which is the zero point on the vertical axis. The value of 0.4 on the vertical axis represents an eroded area of 0.4 square inches above the base line of 0.42 inch.
Stage 12 is a microproppant stage and each vertical blue line represents a perforation. This stage was a 10-cluster design with three perforations for each cluster. As the blue lines indicate, 28 of the 30 perforations (98%) received proppant. On stage 13, which also was perforated with 30 perforations, 17 of the 30 perforations (57%) received proppant. Stage 13 also shows that perforation 7 was a runaway that took a substantial portion of the treatment.
Figure 3 shows a composite of all the stages. The light blue boxes represent the non-micropropped baseline stages while the dark blue boxes represent the micropropped stages. The white line running through the boxes is the median value for all the tests. The results indicate that in the 10-cluster well, the median value for the number of perforations that received proppant increased by 13.1%, while in the 14-cluster well it increased by 16.1%. In general, the completion efficiency of the stages treated with the ceramic microproppant was increased by 15% to an overall competition effectiveness of 54%.
Improved Distribution
The expected impingement velocity of proppant entering the fracture is in the range of 50 to 90 mph. Using the 10-cluster case and the pump rate shown in Figure 4 (10 clusters with three perforations/cluster), the particle velocity as it exits the perforation is about 80 mph. The ability of proppant to increase perforation hole size by eroding steel is well known. In the case of microproppant, it is believed that the microproppant likely does not impact perforation geometry, but does abrade the near-wellbore rock to effectively improve the distribution of the following frac treatment. The 100-mesh sand in the following stages also abrades the perforation.
The mass of microproppant and sand is similar (2.5 g/cm3 vs. 2.65 g/cm3), but the microproppant is so small (0.032 mm) compared to even 100 mesh sand (0.149 mm) that the momentum of the microproppant particle as it turns the corner through the perforation is not sufficient to impact the edge of the perforation. The difference in momentum between the microproppant particle and 100 mesh at 80 mph is a factor of nearly 100. The inertial forces placed on the microproppant as it turns the corner are focused against the cement and rock in the first few feet of near-wellbore area before the velocity of the fluid stream drops to the much lower velocity the fluid stream experiences in the fracture. The distance or geometry of this eroded channel is not known, but it is likely to be on the order of a few feet with infinite conductivity because it is an open channel.
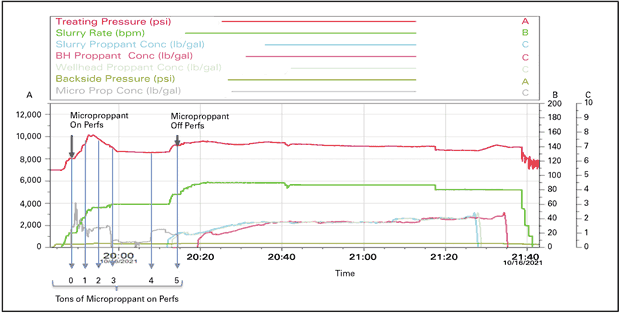
Figure 4 is a treatment plot from Stage 12 of the 10-cluster design in which 10,604 pounds of microproppant was pumped. The bottom-hole concentration of microproppant is shown on the gray line, the surface treating pressure is shown on the red line, and the pump rate is the green line. If the pump rate is held constant, a treating pressure decrease is an indication that any near-wellbore restriction is being removed. It appears that most of the pressure reduction caused by the microproppant occurred very quickly. Because the pump rate was being increased initially, it is difficult to determine the response. But after about eight minutes, the rate was held constant and the effect of the microproppant can be clearly seen. After 6,000 pounds of microproppant, no additional pressure improvement was evident.
FIGURE 4
Stage 12 Treating Plot (Microproppant-Induced Pressure Reduction)
There are several benefits from this reduction in treatment pressure. In addition to opening more perforations and eroding or abrading out any near-wellbore rock, the reduction in pressure allows the pump rate to be increased, which equates to less time for fluid to leak off. This means the treatment will contact more rock with the same amount of fluid to improve treatment effectiveness. If the pump rate is not increased, the lower treating pressure will result in a lower horsepower requirement, a treatment cost savings.
In addition to a dramatic improvement in production, enhancing completion effectiveness represents an increase in capital efficiency. For example, the average capital expense for a 40-stage hydraulic fractured horizontal well is $6 million-$8 million dollars. A completion efficiency of 40% represents a $900,000-$3.2 million cost in over capitalization. In addition to improving the effectiveness of the treatment, the 15% improvement in completion efficiency provided by using microproppant represents a $900,000-$1.2 million improvement in capital efficiency.
Production Results
To quantify the production benefit of microproppant in Permian Basin wells, an unbiased approach was employed to select suitable control wells of the same vintage as each micropropped well in relative proximity and completed in the same formation with the same proppant intensity and same initial operator. Production data is normalized per lateral foot for equitable evaluation.
In two-thirds of the cases, the results show a positive production uplift for the micropropped wells versus the control wells. A skeptic might argue that a positive uplift should be seen in all cases. In reality, however, there are never perfectly matched control wells available, especially given limited completion data and reservoir heterogeneity, so statistical scatter is expected.
FIGURE 5
Mean Production Uplift for Micropropped versus Control Wells in Midland (Left) and Delaware (Right) Sub-Basins
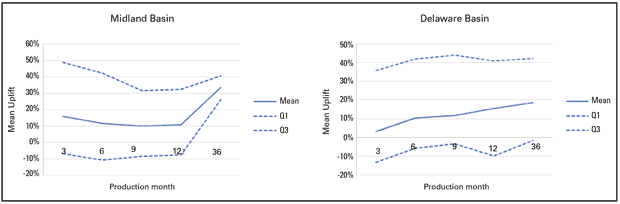
In the micropropped Permian wells, the mean data for a set of 42 analyses shows approximately 15% positive production uplift versus the control wells averaged over three to 36 months (Figure 5). The calculated mean net present value is $1.1 million per micropropped 10,000-foot well at 12 months (mostly 2023-2024 vintage wells), assuming $50/barrel oil and $1.50/Mcf gas prices and a 10% discount rate. The P20 and P80 NPV mean values are (-)$1.3 million and +$4.2 million, respectively.
Our conclusion is that the uplift results are statistically relevant, and attractive to operators, with payback on the completion cost within six to 12 months.
In addition to improved productivity, decline curve analyses of 30 pads in the Midland Basin and 12 pads in the Delaware Basin show that micropropped wells generated a 10% flatter decline in the first 12 months of production in the Midland and a 17% flatter mean decline curve over the first 36 months of production in the Delaware.
While not a large data set, the observed trends in both sub-basins do seem to indicate a flatter decline on micropropped wells than the control wells. A probable reason for this is that the microproppant can boost the effective fracture surface area due to its very small 500-mesh diameter.

CARL MONTGOMERY is an engineer with NSI Technologies LLC in Tulsa. He began his career as a field engineer with Dowell in 1973. With over 50 years of experience, his resume includes a technical directorship with the Society of Petroleum Engineers, and senior technical fellow at ARCO and then ConocoPhillips. He joined NSI in 2009. Montgomery holds a B.S. in petroleum engineering from Colorado School of Mines and an M.S. in biochemistry from Ball State University.

EDUARD SIEBRITS is owner of Geo Frac Analytics LLC and consults with Zeeospheres Ceramics LLC and other clients. With nearly 40 years of industry experience, Siebrits has served in a variety of scientific roles, including as a research scientist at Flotek Industries and rock domain champion, operations manager, and geomechanics division director at SLB. He holds an M.S. in civil engineering from the University of Cape Town and a Ph.D. in geoengineering from the University of Minnesota.

BILL STROBEL is president of Zeeosphere Ceramics LLC in Lockport, La., which manufactures microproppant. He has served as chief executive officer or president of several technology and public companies, including a Fortune 500 company. During his career, Strobel has identified, negotiated and integrated six acquisitions. He has substantial experience in finance, manufacturing, sales, marketing, product development and business planning. Strobel holds a B.B.A. from the University of Texas at Austin, an MBA from California State University at Fullerton and is a graduate of the Executive Development Program at Wharton School of Business.
For other great articles about exploration, drilling, completions and production, subscribe to The American Oil & Gas Reporter and bookmark www.aogr.com.