


DAS/DTS Put New Light On Stimulations
By Vikram Jayaram, Robert Hull, Jed Wagner and Shuang Zhang
IRVING, TX.–Integrating fiber optics-based distributed acoustic sensing (DAS) and distributed temperature sensing (DTS) with microseismic and downhole pressure data provides critical insights into the physical processes taking place in the near- and far-field wellbore environment during hydraulic fracturing. Visualizing these integrated data both three dimensionally and temporally leads to an improved understanding of how the reservoir responds to stimulation, highlights processes relevant to optimizing completion designs, and enables better interpretation of each type of data.
In Midland County, Pioneer Natural Resources Company installed a fiber optic cable in a 10,000-foot horizontal Wolfcamp Shale well permanently to acquire DAS and DTS in conjunction with microseismic measurements. The objectives were to better understand the development of physical changes to the formation as wells were completed and to record far-field interactions between the fiber optics-equipped horizontal monitor well and offsetting horizontal wells during stimulation.
The fiber optic cable was cemented in place on the outside of the monitor well’s casing. The well also was equipped with downhole pressure gauges and conventional downhole microseismic geophone arrays. The monitor well and adjacent horizontal wells then were stimulated in a zipper frac sequence while recording data in the monitor well to observe both near-field and far-field effects of hydraulic fracturing.
Because it is coupled to the rock by cement, the fiber optic cable translates stress changes of the rock as strain changes within the line. The temporal strain changes on the DAS can be recorded and displayed over multiple frequencies. As the hydraulic fracture tip propagates, it introduces deformation and slippage along the fracture face and introduces pressure and strain increases to the surrounding rock. The deformation process may result in mechanical slippage over a broad range of frequencies, which are recorded as stress drops. Microseismic recording of these stress drops tracks the development of the stress envelope through time.
The DAS/DTS data was processed in-house and integrated with microseismic and downhole pressure data collected during stimulation in an effort to enhance Pioneer’s understanding of the physical mechanics at play and delineate the pressure, temperature and strain changes related to hydraulic fracturing.
Continuous Measurements
Fiber optic DTS technology enables continuous and highly sensitive measurements of both temporal and spatial temperatures, making it possible to record an entire well’s response to flow. Downhole temperatures can be recorded during fracturing, well shut-in, and flowback/production to provide continuous and integrated information on fracture/flow distribution to help operators understand what occurred during a fracture treatment. DTS also identifies variations in treatment design and execution and makes it potentially possible to improve the efficiency of multistage treatments.
While acoustic phenomena are very complex, DAS data can be used to visualize important downhole parameters such as active perforations and flow rate. Installing the fiber permanently potentially allows the entire length of the wellbore to be monitored over its lifecycle.
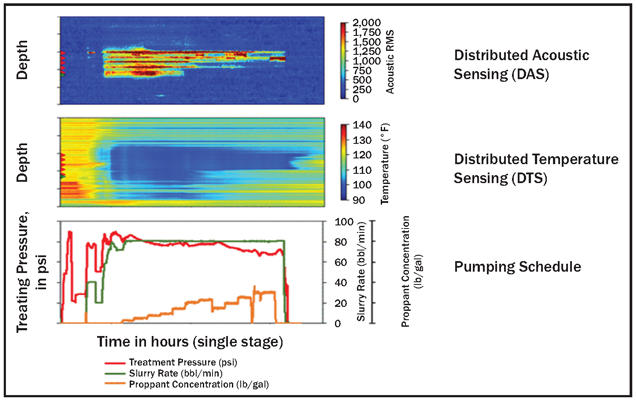
During hydraulic stimulation, fluid distribution was interpreted for each cluster using DAS/DTS. The real-time DAS/DTS data recorded during and after stimulation provided a window into understanding treatment effects. Figure 1 shows DAS/DTS responses correlated with the pump schedule during a single stage. The red triangles on the left edge of the DAS/DTS plot represent the location of perf clusters and the green triangle block indicates the location of the plug for this stage.
FIGURE 1
DAS/DTS Responses Correlated with Pump Schedule for Single Stage
In addition, cross-well interaction during the offset well treatment also was observed from DAS/DTS.
Interpretation Workflow
As part of this project, Pioneer developed a workflow to improve DAS/DTS data processing and interpretation.
For DTS, the workflow begins by converting the fiber optics-measured temperature collected during stimulation into a temperature difference by subtracting it from the prefrac formation temperature. Then, a thermal model is built for the well and surrounding rock matrix. From this model, a simulated temperature can be created for DTS during and after pressure pumping. Pioneer observed changes in the DTS signal to detect fluid entering the formation across clusters, and what may be the effective transmission of the completion through time.
Figure 2 shows the actual-versus-modeled thermal changes in the wellbore when warm-back began (warm-back time was adjusted to zero once a cluster shut down). From the different slopes in the warm-back signatures, it is possible to estimate the contribution of fluid across individual clusters. A high degree of correlation is evident between warm-back time and difference in temperature when comparing simulated versus measured temperatures in each of the clusters utilizing the thermal modeling approach.
FIGURE 2
Actual versus Modeled Thermal Changes when Warm-Back Begins
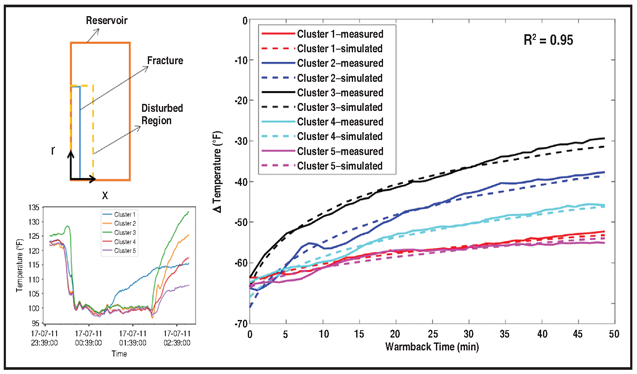
With the calibration of thermal properties, the simulated temperature matched the measured temperature very well. Slurry/proppant distribution then was generated from this information. In addition, fluid interactions with previous stages were detected automatically based on the rate of temperature change.
Meanwhile, DAS also is interpreted to determine fluid flow through the perforations and into the reservoir. The DAS signal was studied in the frequency domain to identify and remove background noise and retain the dominant acoustic frequency bands related to fluid flow/slurry distribution. Various metrics were computed, including acoustic energy and sound pressure levels. Then the acoustic energy was interpreted into slurry distribution of each stage. Fluid distribution results were provided during stimulation from DAS, and data recorded from one stage was processed to allow for observations to be made prior to pumping the next stage.
The data processing framework involved a cloud-based solution capable of storing terabytes of DAS data on a cloud-based compute ecosystem for processing and computation using high-performance Linux virtual machines.
As noted, a statistical metric for uniformity was defined as an indicator of how evenly slurry/proppant was distributed into each cluster to better quantify the performance of each stage. Analytics were compiled to compare stage-to-stage performance.
DAS is a good indicator during hydraulic stimulation where DTS and temperature transients/stabilization responses are better indicators of fluid allocation post-stimulation. By having both calculations, we can interpret some of the physical processes taking place at the perforations, recognize and understand variations between datasets, and provide insight into the stimulation that may otherwise be missed.
Near- And Far-Field Changes
Microseismic data acquired using both the fiber optic cable and geophone array was integrated with DAS/DTS, and the fluid distribution data from DAS/DTS was compared with the microseismic and near-field strain to better understand completion processes. The dynamics of strain and microseismic signature were analyzed as fluid moved from an offset well undergoing stimulation into the previously completed monitor well to better understand reservoir and far-field completion effects. This combination of datasets further defined key relationships between fluid, pressure and acoustic activity within a stimulation stage and identified stimulation effects through time in the far-field area away from the hydraulically fractured well.
By integrating microseismic with near-field DAS/DTS, changes can be observed in both the near and far fields within the rock during stimulation. Figure 3 displays some of the key aspects of the microseismic event timing, including where events occurred in the near field along the wellbore. Events are colored and sized for magnitude. The horizontal blue lines highlight the treatment interval while the vertical lines mark key points in the stage. The actual microseismic positional data along the wellbore is not shown, but the microseismic cloud developed from the perforations and extended into the distance in the direction of maximum horizontal stress (SHmax) throughout the stimulation.
FIGURE 3
Temporal Relationships of DAS, DTS, Microseismic and Treatment Data
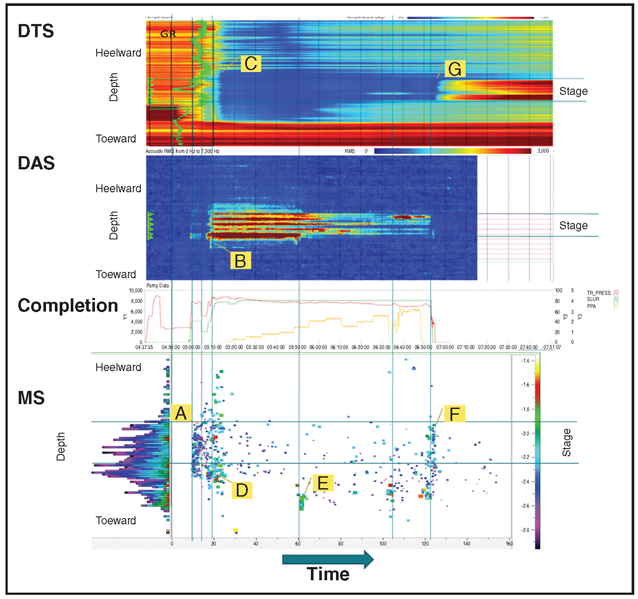
For this stage, DAS indicated good transmission of energy (point A) across the perforation starts at point B as the stage came up to rate, with the cooling of the fiber shortly afterward (point C). One key aspect is that the microseismic occurred early across most of the perforated interval and developed outward in a slightly toe-ward direction through time (D). Minor variations in surface pressure, DAS and microseismic are noted at point E. At the end of the stage during shutdown, pressure was abruptly lowered and an increase in microseismic events along the main perforation interval was observed (F). Thermal warming began shortly thereafter (G). The noted increase in microseismic activity as the pumps shut down suggested that we may have been imaging the closing down of fracture aperture.
In regard to understanding far-field deformational changes in the reservoir, the study’s goal was to record the low-frequency strain and thermal variations on the fiber for stimulations at various well spacings, and then correlate that information to the progression of the zipper frac through time and space. The method involved both leading and lagging the offset completion with the fiber well in the zipper frac sequence to better understand the relationship between the stimulation of the virgin rock and that of prior stimulated zones.
The complexity of the hydraulic stimulation and well-to-well interaction can be better described and understood using microseismic, strain and thermal data. Establishing strain and thermal relationships through the virgin reservoir can highlight the degree of natural fractures, which potentially contribute to stimulation complexity. For example, does the hydraulic stimulation show up on the offset well along SHmax at one or two localized points, or is it more diffuse along the lateral position of the fiber well beyond what would be considered the stimulation deformation width? This information can be utilized to help answer such questions while also revealing the existence of natural fractures that may provide communication pathways.
Conventional and fiber optics-based microseismic data can track the evolution of stimulation energy from offset wells, tying together the DAS strain and DTS in the instrumented well. Figure 4 shows microseismic events from one frac stage in an offset well developing onto the previously stimulated monitor well, establishing a direct correlation of a stimulation progressing through time from the well undergoing treatment to the monitor well. The microseismic events are colored in time and sized by magnitude. The red arrows denote the injection depths of the offset well.
FIGURE 4
Progression of Microseismic Events from Offset Well to Monitor Well
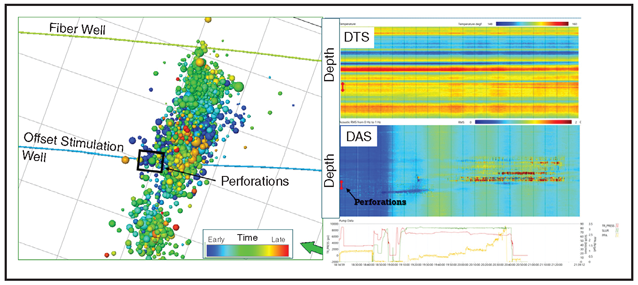
The DAS interactions occurred over 400 feet of interval over mid- to low frequencies and started after about half of the stage had been pumped and continued after the pumps were stopped. Far-field observed strain hits and thermal interactions with the fiber from the offset well were tied to the microseismic stimulation development. By integrating these data, we developed a more complete understanding of the physical processes occurring within these stimulations and their interactions with the reservoir.
Key Observations
Pioneer has made a number of key observations utilizing the various datasets related to the far field. From microseismic data, stimulation extents generally correlated to the strain deformation envelopes noted on fiber. Fiber-based microseismic gave a qualitative estimate of the stimulation building outward from the offset well toward the fiber-equipped well.
There appeared to be more complex strain hits on the fiber when stimulating the offset well through previously stimulated rock. Overall, strain effects were broad and occurred earlier in time than the thermal warming related to the pressure front. Cooling was observed on only some stages. There was more thermal pressure-related warming heel-ward than toe-ward from the offset stimulation. This may have been related to a stress shadow of the current offset stage.
Other observations from the strain and thermal interactions, included:
- Strain and microseismic data indicated that fluid moving within the hydraulic fracture continued through time even after pumping had stopped on the offset well.
- Strain through the virgin rock often focused over short intervals on the fiber, and at times broadened out to a length exceeding two stages while pumping the offset stimulation.
- Broad strain signatures exceeding two-three stage lengths were observed in the monitor well while stimulating the adjacent offset well, highlighting the perforation clusters of the monitor well as pressure and likely fluid communication were established.
- A low-frequency strain signature was observed more than two stages beyond the current stage.
- Extension of the stimulation over 750 feet typically took more than 30 minutes to travel through the monitor well’s completed stimulation.
- For the most part, extension followed the SHmax direction out of the perforations in the offset well, with limited interpreted natural fracture interaction carrying fluid substantially heel-ward beyond the offset deformation zone.
- Thermal variations were noted on the offset fiber for some stages that correlated in depth to the change in strain on the fiber.
Fiber-Based Microseismic
Microseismic events were recorded by both the fiber optic cable and the conventional geophone array to compare the results and calibrate the geophone-based microseismic data with the fiber optics-based data. These datasets allowed us to establish a temporal understanding of hydraulic fracture geometry and conductivity in three dimensions. The fiber optics-based microseismic complemented our understanding of the progression of the stimulation adjacent to the offsetting fiber well.
While there are numerous advantages associated with using fiber optics to record microseismic data, there also are some disadvantages. Most notably, a fiber optic line acts as a single-component geophone. It is not omnidirectional and is more sensitive to energy propagating along its length than across its width. In this project, fiber optics-based microseismic was typically recorded only from the horizontal part of the instrumented well, resulting in some limitations in defining the exact placement of microseismic events for most of the well.
Fortunately, additional depth work was possible in heel stages where both vertical and horizontal fiber could record large events. This allowed us to establish depth control for the fiber-based microseismic events that compared well with the depths recorded by the geophone-based data. Correlating both microseismic datasets gave Pioneer confidence in the fiber-based microseismic depiction of cloud extents for a given frac stage.
The frequency of the energy occurring along the fiber during completion was analyzed. Low-frequency strain buildup on the fiber was observed and correlated with the current and prior stage (stress shadowing). For some parts of the analysis, stress shadow effects were removed to better normalize variability at the cluster level. Localized changes occurring at the cluster level at higher frequencies within the stage also were noted.
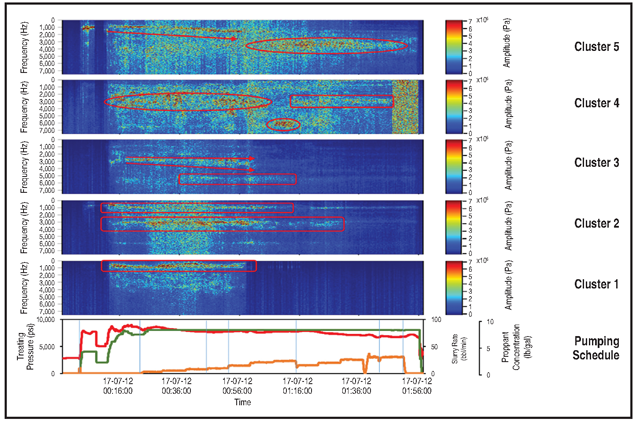
Figure 5 shows the frequency analysis across five clusters and their temporal changes in energy through time that could be related to changes in fluid. Once DTS and DAS fluid allocations at the cluster level were obtained, the two techniques were compared and related to downhole dynamics to better understand stage-to-stage uniformity. Some of the noted variations are highlighted in the red boxes (in this example, the DAS data terminated early, as shown for Cluster 4).
FIGURE 5
Energy Frequencies and Temporal Changes
Through Time Across Five Clusters
The acquired datasets support the basic concept that stress increases as pressure increases in hydraulic fractures and the surrounding rock adjacent to those fractures. Despite some uncertainty in the locations of microseismic events, the microseismic dataset demonstrated clear associations with the strain and thermal effects noted on the fiber-based data. In other words, we see a direct correlation of the fiber-recorded strain changes with the presence of microseismic near or adjacent to the fiber. It is important to note the microseismic does not typically track individual fractures in tight reservoir rock stimulations, but the broader strain-induced deformational zone and the mechanical processes occurring within the zones.
Two key observations can be made from the fiber-based data. First, fast warm-back was experienced on the thermal data. This suggests that the stimulation fluid was moving away from the well and down the fracture after the completion had stopped pumping. If the fluid was to remain around the perforations and fiber, the rock should have retained the cooler fluid temperature with a generally observed slow warm-back occurring over days. Instead, the near-field data showed some clusters warmed to reservoir temperature within minutes. This phenomenon was interpreted to be in situ fluid in the stimulated rock next to the fracture quickly replacing the cold frac fluid after the pumps shut down. Evidence of aperture closing was observed.
A second observation was that the recorded deformation continued for a substantial amount of time, often tens of minutes, after pumping had stopped on the adjacent well. The data suggests that the fluid was moving, introducing stress and strain changes in and around the fractured reservoir for an hour or more after pumping has ceased.
Integrating DAS/DTS with microseismic and downhole pressure data resulted in a better understanding of the physical processes taking place in both the near- and far-field wellbore environments during the stimulation of horizontal Wolfcamp wells. Developing multidisciplinary teams that can integrate these substantial datasets and reduce the information into transferable lessons is key to a successful outcome. Based on this work, we can further develop our hydraulic stimulation models to optimize completions, increase recovery factors, and reduce communication with offset wells.
Editor’s Note: For more information on the DAS/DTS workflows developed for the Midland County Wolfcamp project, see “Hydraulic Fracturing Stimulation Monitoring with Distributed Fiber Optic Sensing and Microseismic in the Permian Wolfcamp Shale Play" (URTeC 291), a technical paper that the co-authors presented at the 2019 Unconventional Resources Technology Conference, held July 22-24 in Denver.
VIKRAM JAYARAM is the head of the data science and advanced analytics group at Pioneer Natural Resources. He has more than two decades of experience in advancing the field of artificial intelligence and advanced signal processing both in academia and industry. His interests are in developing AI-powered production systems for advanced analytics. Jayaram holds an M.S. and a Ph.D. in electrical engineering from the University of Texas at El Paso, and a post-doctoral fellowship from M.D. Anderson Cancer Center.
ROBERT HULL is a geoscience and innovations adviser for Geophysical Imaging, which provides consulting services on reservoir and completion interactions observed though various technologies to better optimize and develop unconventional resources. He previously served for 19 years in Pioneer Natural Resources’ geophysical technology group, where he worked with 3-D seismic, microseismic, geomechanics and fiber optics. Hull holds a B.S. in geology from the University of Rochester and an M.S. in geosciences from the University of Texas in Dallas.
JED WAGNER is an engineer in the emerging technologies department at Pioneer Natural Resources, with responsibilities in completion, reservoir and drilling project management. He has spent 12 years at Pioneer, working as operations excellence coordinator, production engineering manager for the Permian asset, and serving in several production and completions engineering assignments. Wagner holds a B.S. in petroleum engineering from the Colorado School of Mines.
SHUANG ZHANG is a data scientist in the data science and advanced analytics group at Pioneer Natural Resources. Her responsibilities include developing advanced technology solutions for distributed fiber optics sensing, data processing and interpretation. Zhang’s interests are in distributed fiber optics sensing, advanced analytics, and horizontal well downhole monitoring. She holds a Ph.D. in petroleum engineering from Texas A&M University.
For other great articles about exploration, drilling, completions and production, subscribe to The American Oil & Gas Reporter and bookmark www.aogr.com.