


Development Concept Optimizes Production, Recovery
By Jill Thompson, Nick Franciose, Marc Schutt, Kate Hartig and Jon McKenna
DENVER–The billion-dollar question in unconventional play development is how to space horizontal wells to optimize reservoir development. The goal is to develop the optimal number of wells that will yield the highest rate of net present value. Drilling too few wells initially strands reserves, reduces NPV and creates poor pressure conditions, all of which increase costs and reduce estimated ultimate recovery for infill wells. Drilling too many wells results in overcapitalization, with incremental wells reducing the NPV of a drilling spacing unit (DSU).
In the Midland Basin, where there are more than 2,000 net feet of high-quality reservoirs, each with several target benches, the 3-D optimization of inter- and intra-stratigraphic well densities is paramount and a steep challenge with enormous economic impact.
To optimize Midland Basin surface and subsurface operations, as well as reservoir performance in tightly-spaced and stacked stratigraphic horizons, QEP Resources Inc. has developed a novel multidisciplinary methodology it calls “tank development.” The principle element of tank development is exploiting a volume of rock at one time in order to maximize reservoir potential and value. This is accomplished through detailed well placement planning and by integrating drilling, completion drill-out, and production startup operations. By carefully sequencing hydraulic fracturing and bringing multiple wells on line simultaneously, this approach pressurizes (“supercharges”) the reservoir to create more fracture network complexity, which increases EUR and value.
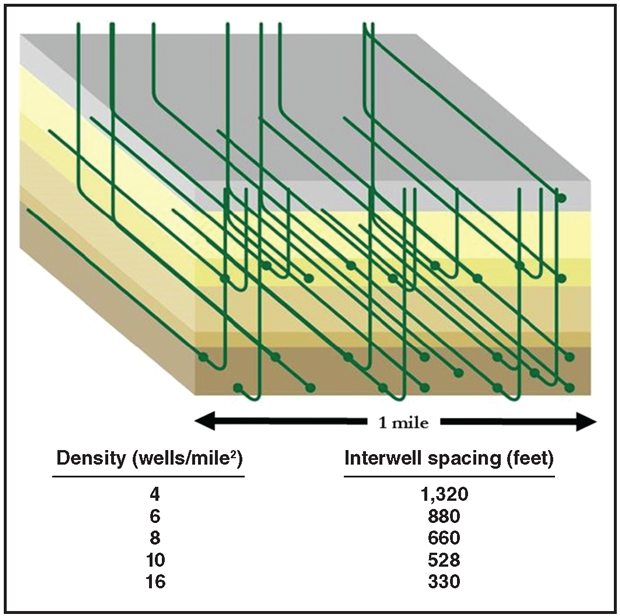
The image in Figure 1 illustrates the challenge of 3-D horizontal development in multiple stacked pay horizons in a one square-mile DSU. Green lines are wellbores drilled from the north and south in multiple formations. The table below the figure shows the relationship between well density (number of wells) and interwell spacing (feet between wells) within a DSU.
FIGURE 1
3-D Horizontal Development in Multiple Stacked
Pay Horizons (One Square Mile DSU)
QEP Resources conducted a field test in which wells were drilled, completed and brought on production using both tank and nontank (standard industry practice) reservoir development approaches. The test area is located along the border of Texas’ Andrews and Martin counties in the Midland Basin, and is focused on multiple stratigraphic zones and benches within the Spraberry formation. In this area, the oil-rich Spraberry Shale is at least 350 feet thick and consists of mixed silicate and calcareous mudstones, siltstones and fine sandstones deposited as turbidites in deepwater submarine fans with associated channels.
Microseismic analysis and pressure data, as well as actual production results from the field test wells, support the conclusion that the tank development approach leads to greater near-wellbore hydraulic fracture complexity and improved well productivities.
Frac Hits
Frac hits are a common occurrence in unconventional horizontal development, and can be described as fluid and/or pressure invasion into a parent well from the hydraulic stimulation of a child offset well. Parent wells may begin producing days, months or even years prior to child well development. Because of the fluid withdrawal, production from the parent well creates a pressure sink, or a zone of lower pore pressures. Depending on rock properties, complexity of stimulated hydraulic fractures and production time, a pressure sink can extend into the hydraulic fractures, natural fractures or rock matrix.
The hydraulic fracture energy of the child well stimulation will grow preferentially toward lower-pressure zones. This preferential growth toward a pressure sink not only can compromise the child well’s stimulated rock volume, but also diminish the parent well’s production.
Two types of frac hits have been experienced within the study area: communication and interference. Communication frac hits occur when pressure and/or fluid increase on the parent well and may be a singular event. A communication frac decreases oil production on the parent well, but the well will return to prehit trends. Interference frac hits result in a decrease in oil production and long-term negative effects on producing parent wells. A compromised stimulated rock volume (SRV) of the child well may occur in both communication and interference frac hits.
QEP Resources has observed communication frac hits at great vertical and lateral distances, but these distances probably do not represent optimal well densities or indicate a high degree of connectivity between parent and child wells. Rather, we suggest that the complex interplay of stacked pay, natural fractures, deformation zones, interlaminate bedding planes and reservoir pore pressure differences control the severity of communication and interference frac hits.
While companies with leasehold obligations will continue drilling parent wells for the foreseeable future, economic realities compel companies with held acreage to quickly understand and execute higher-density development plans over multiple stratigraphic horizons. Four years ago, QEP Resources’ Midland Basin program began transitioning from parent well development to conventional sequential well development with increased densities.
Although this transition is a natural progression, we recognized that sequential development often can result in production losses related to frac hits, potential long-term impacts on parent well production and less effective child well SRVs. During sequential development, individual wells typically are brought on line immediately after completion to maximize corporate value using internal well metrics, while continuous drilling and completion operations occur only a short distance away. The key to maximizing corporate value through this progression to simultaneous development is managing densities and production optimization.
Sequential Development
An example of this situation is DSU-A, which consists of an average well density test of 10 wells/mile in the Spraberry, with two parent wells in the Middle Spraberry and Spraberry formations (stars on left side of the in DSU in the left-hand image in Figure 2A). Wells 1 and 2 (red wells on right side) produced for 34 days before child wells 3, 4 and 5 were completed. During production, the hydraulic fractures, and possibly the natural fractures, experienced decreased pressure, resulting in a pressure sink. The two parent wells were not shut in and were producing during offset well stimulation treatments.
FIGURE 2A
DSU-A (Non-Tank Development)
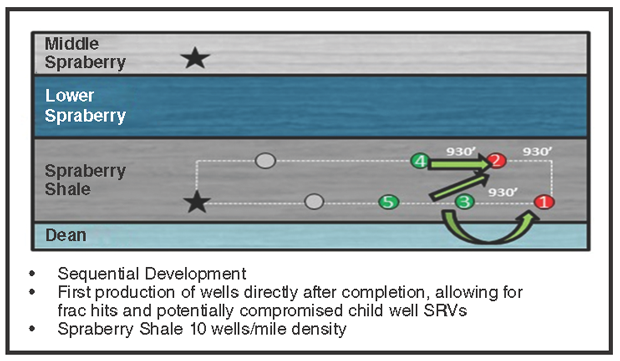
When wells 3, 4 and 5 were completed, the hydraulic energy and fluids preferentially grew toward the pressure sink. This was expected and matched previous frac modeling efforts. Wells 1 and 2 experienced 36 days of lower production because of the interference frac hits. This was not an isolated event in our experience; production losses have occurred with every sequential well completion and production startup. Some wells returned to their forecast levels while others never resumed their previous paces.
Using all observed frac hit data, production loss was quantified as a function of distance. This relationship is used to understand and incorporate the economic effects of frac hits in development planning when using a sequential development technique. Indications of compromised child well SRV also are evident, which is consistent with microseismic data, frac modeling results and production analysis.
In addition to the sequential development test, one horizontal infill program was executed as part of the sequential development study to shed more light on the economics of infilling for stranded reserves within the Spraberry formation. In the one-mile DSU study, two Spraberry infill wells were drilled and completed 150 feet above seven producing Spraberry wells and approximately 650 feet below four producing Middle Spraberry wells. At the time the two infill wells were completed, the 11 existing wells’ combined production was roughly 3 million barrels of fluid during a period of 24-28 months.
While completing the infill wells, seven of the 11 existing wells, positioned both above and below the infill wells, experienced interference frac hits. Production from the wells with frac hits decreased 30-100 percent and took several months, if ever, to return to prehit trends.
In addition, the two infill wells’ output dropped (50 percent EUR reduction) compared with all other wells producing in the Spraberry. We attribute this to a compromised SRV caused by the pressure sinks above and below the wells. This hypothesis is supported by frac modeling results, which predicted immediate growth into pressure sinks, proppant settling away from the wellbore and smaller SRVs. Considering current operational costs and oil prices, it is not economic to drill additional infill wells at this time. This perspective emphasizes the need to understand optimal multiple stratigraphic horizon spacings to balance stranding economic oil and maximizing value.
Tank Development Concept
To overcome the pitfalls at DSU-A, the goal in DSU-B and DSU-C (Figures 2B and 2C) was to optimize the development strategy rather than use a mitigation technique, leading to the creation of the multidisciplinary tank development approach that aims at optimizing both surface and subsurface operations and exploiting a volume of rock at one time to maximize reservoir potential.
FIGURE 2B
DSU-B (Tank Development)
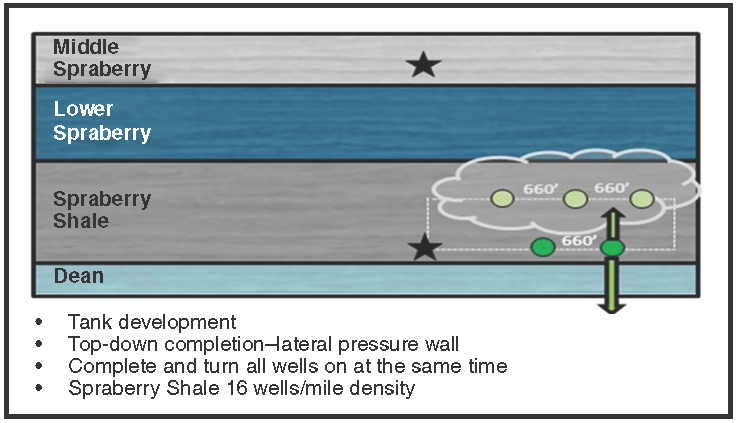
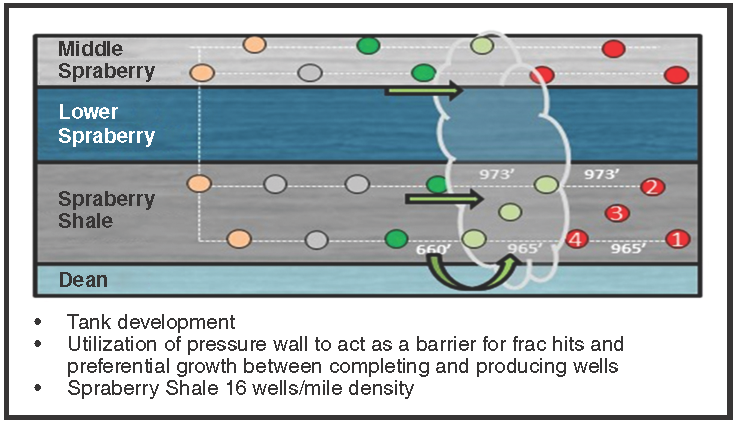
FIGURE 2C
DSU-C (Tank Development)
Ideally, all wells in a given area are drilled, completed and then brought on line at the same time to minimize the effects of frac hits associated with pressure sinks. However, understanding the practical balance between optimal development and production goals prompted the development and implementation of a “pressure wall” concept to minimize well interference while optimizing production and stimulation.
In this context, a pressure wall is a lateral and/or vertical volume of reservoir that has been completed (“pressured up”), but not turned on line for flowback. Because of completion energy, the reservoir within the pressure wall is above pore pressure and acts as a barrier to frac hits and preferential energy growth between completing and producing wells. A volume of unstimulated rock acts as a buffer between drilling and completion operations (Figure 3). Prior to implementing this buffer, QEP Resources had experienced multiple frac hits that resulted in drilling operation downtime and associated cost increases.
FIGURE 3
Continuous Tank Development Approach
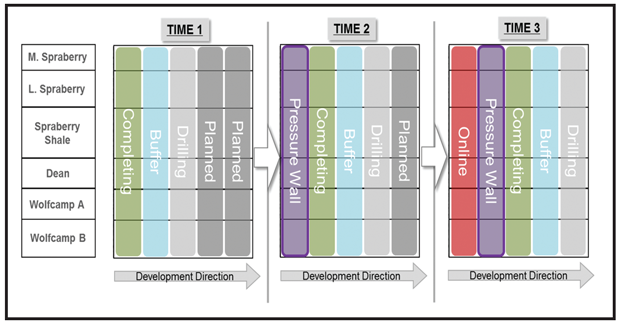
Tank development must therefore be accomplished by continual timely development of a DSU, such that each drilling rig is followed by a completion crew that creates a pressure wall, which in turn, is followed by simultaneous flowback and production of all wells. The three ideal steps to deploying tank development are:
- Completing wells in a “top-down” manner whenever possible to minimize stimulation fluid and pressure leak-off into shallower, lower-pressure zones and open naturally fractured rock, generating more near-wellbore complexity;
- Bringing wells on line only when there is a pressure wall separating producing wells from completing wells; and
- If a pressure sink exists, wells are drilled laterally away from the sink and completion operations are started at the pressure sink.
Prior to implementing tank development, it was recognized that the approach would maximize surface efficiencies through higher utilization (such as less downtime) of drilling, completion and facilities equipment, crews and infrastructure. In addition, it was hypothesized that it would maximize subsurface reservoir energy and well productivity by supercharging the reservoir. In this context, supercharging is the conservation of pressure and additive energy within a volume of reservoir from multiple horizontal hydraulic stimulations.
Case Study Results
The first implementation of tank development was on the DSU-B in the Spraberry. Development consisted of five wells at a density of 16 wells a mile, offsetting existing parent wells in both the Spraberry and Middle Spraberry. Completed from the top-down, the upper bench was completed first in the five wells, resulting in a lateral pressure wall, followed by the two wells in the lower bench of the Spraberry.
The two lower-bench wells had an unusually low gas-to-oil ratio signature for the formation, which was interpreted as evidence that the lateral pressure wall increased the two lower wells’ near-wellbore complexity. The lateral pressure wall also may have forced some completion energy downward into the underlying Dean formation, which would be expected to have a lower GOR than the Spraberry.
Early production from the DSU-B 16-well density test with tank development performed similarly to an eight wells/mile nontank development, suggesting an uptick in production likely tied to the tank development strategy. Rate transient analysis and reservoir simulation are ongoing in this DSU to provide more insight into the physics of tank development and pressure wall utilization.
Following the success at DSU-B, the DSU-C was planned similarly in the Spraberry at an average 16 well/mile density using tank development with comparable completion designs, but also including wells in the Middle Spraberry. DSU-C was the first attempt at continual tank development with multiple simultaneous operations across six pads. The pressure wall concept also was implemented successfully. Using surface gauge data, production and electric submersible pump intake pressures, an effective reservoir pressure barrier was formed that minimized production losses from frac hits and maximized effective stimulations.
To further evaluate the effectiveness of the tank development strategy, a surface microseismic array was deployed to monitor four wells (wells 1, 2, 3 and 4) in the Spraberry formation during completion. A surface array was selected over a vertical array in order to detect focal mechanisms, minimizing false conclusions that can result from interpreting solely raw events. Focal mechanisms describe the failure mechanisms associated with an event and are critical in modeling discrete fracture networks (DFN) and any corresponding propped DFN.
Moment magnitudes and failure mechanisms indicative of hydraulic fracturing combine with rock properties to create a DFN. This DFN is calibrated using a mass-balance approach where the fluid-induced fracture volume is equal to the injected fluid and proppant volume minus the leak-off volume (as measured from a leak-off test). Proppant is injected on a stage-by-stage basis in an elliptical fashion honoring the shape of the event cloud.
Each of the four Spraberry wells were completed east to west, with Well 1 completed first and Well 4 completed last. As tank development advanced and wells were stimulated continually, both measured event count and magnitude of each well increased (Figure 4). This is evidence of breaking more rock by supercharging the reservoir and is consistent with Mohr-Coulomb failure criteria (as fluid injection increases pore pressure, normal effective stress diminishes, moving the system into a state of shear and causing those fractures optimally oriented to regional stresses to fail first).
FIGURE 4
Increased Event Count and Moment Magnitudes
With Tank Development
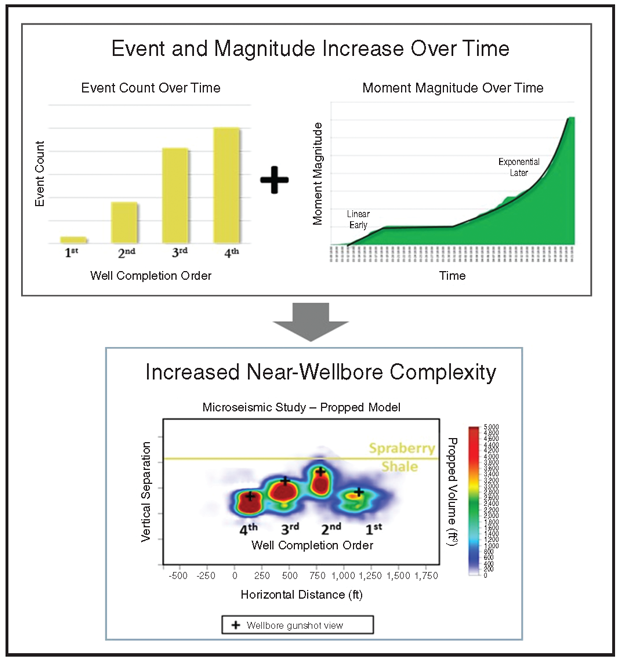
Near-Wellbore Complexity
The added pressures and stresses increase formation stress past the critically stressed failure point, allowing fractures to fail as the completions progress. In Figure 4, the propped SRV is increasingly compact from Well 1 to Well 4, with smaller height and lateral extents, suggesting increased near-wellbore complexity as tank development advances. The increased propped volume and near-wellbore complexity seen in microseismic data are corroborated by production diagnostics. A diagnostic plot of the reciprocal productivity index of DSU-B indicates that tank development created a larger fracture network surface area and greater fracture complexity than the nontank developed DSU-A.
Completion datasets contain trends that imply the process creating this complexity. Pressure data from DSU-C exhibit a rising trend in prefrac pressures when wells are completed in close proximity to one another. Figure 5 shows initial shut-in pressures rising between stages toward the end of a sequence of tank developed wells on the west side of DSU-C. The pressures for the first two pairs of wells did not increase dramatically, perhaps because of the greater spatial extent of their positions, having been spread over two formations, but well pairs three and four in the sequence exhibit increasing initial pressure profiles. This suggests that the latter wells were influenced by energy from the preceding completions.
FIGURE 5
Pre-Frac Shut-In Pressures (West Side of DSU-C)
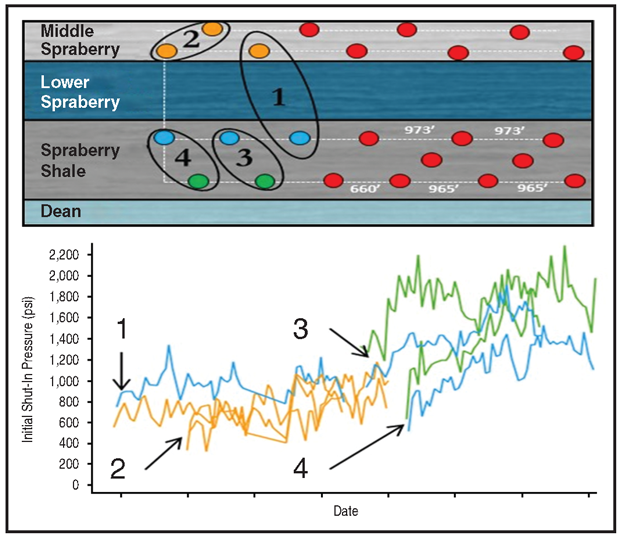
The fluid placed by the first two pairs elevated reservoir pressures, increased local pore pressures and diminished the system’s normal effective stress, moving the system toward its shear failure envelope. Completion pairs three and four then were completed in the same reservoir and at tighter spacing than the first two pairs, into a system for which energy had been elevated by the first two completions. This region of heightened pressure and stress above well pairs three and four appears to have acted as a partial hydraulic seal for the last two completion pairs, leading to greater localization of completion energy and greater elevation in initial pressures.
The relationship between rising initial pressures during the course of a tank developed package of wells is significant because it indicates tank development is supercharging the reservoir, adding energy to the system faster than it can be dissipated through fracture propagation and leak-off. It is apparent in the microseismic data that the increasing residual energy correlates with accelerating fracture event generation and cumulative moment.
The connection between the rising prefrac pressures and accelerating event generation is shown schematically in Figure 6. Starting points A and B are higher than the first well’s initial prefrac shut-in pressure, translating into more fracture initiations, greater near-wellbore complexity and greater event generation.
FIGURE 6
Adding Energy to Reservoir System
With Tank Development
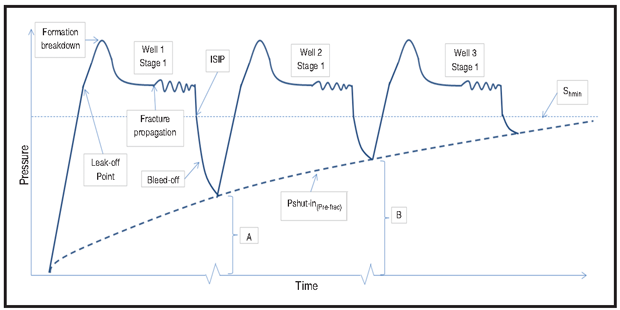
Because the prefrac shut-in pressure increases for each subsequent well in a tank development sequence, the net energy needed to return the system to a critical state diminishes with each additional completion. The end result is that subsequent completions in tank development sequences spend more completion energy generating fractures, and less time, energy and capital are spent elevating the system energy to the point of formation breakdown.
The correlation between initial shut-in pressure and cumulative moment magnitude is tank development’s value creation mechanism: High density tank development results in more fracture network surface area per unit volume of reservoir than conventional sequential development. As a result, the same volume of rock can support a greater number of NPV-optimal wells, achieve greater cumulative asset value and recover more resource.
Higher EURs
Operators face competing and often conflicting enterprise objectives, including the need to maximize project rates of return, shareholder returns, and growth in production, margin and reserves. Perhaps paramount among these is the need to execute a development plan that maximizes the asset’s present value, given capital constraints.
To accomplish this, sufficient density tests should be conducted to give an operator reasonable confidence in how a reservoir’s performance will vary as a function of well density. These EUR trends can be used to profile an asset’s cumulative value to determine the value-optimal development density.
A key validation of the field trials is that the EUR trends observed from tank developed wells greatly exceed the results from nontank developed well packages. The average EURs of the density tests show distinct behavior between tank and nontank developed peer wells. This trend departure is a product of two factors:
- Tank developed wells do not suffer frac hits, which means SRV impairment is avoided in both child and parent wells; and
- Tank developed wells exhibit greater event generation and fracture network surface area from increased fracture network complexity (a clear performance uplift with significant asset value implications).
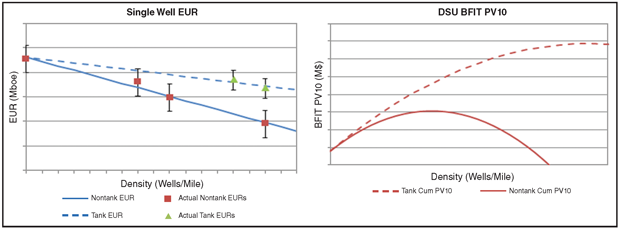
The significant EUR trend differences also are seen in the present value trend (Figure 7). When this trend is rolled up to the DSU level, tank development allows an operator to increase density and increase the value of a given volume of rock. The magnitude of this increase is specific to the reservoir and the DSU’s location within the basin, but in the case of the Spraberry example, tank development allowed both peak value and the well count at which peak value was realized to more than double. This means the DSU can support a greater number of wells at a considerable value multiple as compared with a nontank development regime.
FIGURE 7
Average EUR and PV10 Trends of Spraberry Wells
(Tank versus Non-Tank Development)
This next wave of development has only begun in the Midland Basin, and operators are shifting from parent well tests to increased well density development. However, the development of increased well densities in a sequential parent/child methodology commonly results in less effective SRVs of child wells, increased production downtime, and drilling hazards.
The principle result of the Andrews-Martin counties field tests is that productivity indexes for the wells in the tank development program clearly exceed the productivity indexes of nontank wells using a standard sequential approach. In addition, tank development effectively eliminates the detrimental effects of parent/child sequential well interactions, including negative impacts from child well completions on parent well production and poor stimulation results in child wells caused by parent well energy sinks.
Creating a pressure wall minimizes well interference while optimizing stimulation, production and operational efficiency. Moreover, supercharging the reservoir creates an exponential microseismic event growth profile, resulting in completions with greater near-wellbore hydraulic fracture network complexity. The increased complexity results in more surface area per unit volume of rock, which in turn, supports higher well densities and oil recoveries.
As demonstrated in the initial Midland Basin applications, tank development is proving essential for maximizing asset value during simultaneous development of multiple horizons with horizontal wells in close proximity. The tank development strategy is expected to undergo continuous optimization as QEP Resources incorporates new field tests, additional data acquisition and reservoir modeling into the analysis.
Editor’s Note: The co-authors acknowledge the team at MicroSeismic Inc. for its work on the tank development field test project, and QEP Resources’ Josh Cooper, William Drake, Eric Kuhl, Chris Buscemi, Derek Hargrave, Douglas McCartney, Andrew Forcina and Eric Mansanarez for their contributions. The preceding article was adapted from URTeC 2902895, a technical paper originally prepared for the 2018 Unconventional Resources Technology Conference, held July 23-25 in Houston.

JILL THOMPSON is a senior staff geologist in the Permian Basin for QEP Resources Inc. She joined the company in 2015 and became a member of the QEP team that pioneered the tank development concept. With more than 12 years of industry experience as a geoscientist in West Texas, South Texas, the Rockies, Appalachia and the Gulf of Mexico, Thompson primarily has focused on multidisciplinary development and portfolio planning, data acquisition and integration, and geomechanics and natural fracturing. Thompson previously worked as a senior geologist at Newfield Exploration and as a senior production geoscientist at Shell Western E&P. She holds a B.A. in geology and social geography from Colgate University, and an M.S. in geology/geophysics and an M.B.A. from Boston College.

NICK FRANCIOSE is a reservoir engineer with QEP Resources, dedicated to the Permian Basin asset team. He joined QEP in 2015, and worked in acquisition and divestitures for new ventures before shifting focus to the Permian. With seven years of reservoir experience in the Rockies, West Texas and Haynesville plays, Franciose brings a suite of traditional RTA tools and next-generation analytics to inform development optimization strategies. He holds a B.S. in physics from Mary Washington University, an M.S. in data science from Regis University and an M.S. in mechanical engineering from the Colorado School of Mines.

MARC SCHUTT is the Haynesville and Bakken reservoir engineering manager for QEP Resources. He has been with QEP/Questar for 19 years, working assets in Louisiana, Texas, North Dakota, Oklahoma, Wyoming and Utah. The first half of his career was spent as an area engineer, where he focused on production, completions and reservoir engineering. The second half of his career has been spent in reservoir engineering. Schutt holds a B.S. in petroleum engineering from Colorado School of Mines.

KATE HARTIG formerly served as Permian geoscience manager at QEP Resources and was part of the team that created QEP’s tank development strategy. Hartig joined QEP in 2013, where she focused on asset evaluations, exploration and operational excellence. She began her career in 2003 at Pioneer Natural Resources as a geologist. She played an integral role in Pioneer’s Spraberry/Wolfcamp reservoir characterization efforts, and designed and coordinated various development programs. After nine years at Pioneer, she took on a geologist role at Energy Exploration Partners. Hartig has worked multiple basins during her 15 years, including West Texas, South Texas, Tunisia and the Gulf of Mexico. She holds an M.S. in geology from the University of Oklahoma, and a B.S. in geology and environmental science from Central Michigan University.

JON MCKENNA is the Denver team leader of the completions evaluations group at MicroSeismic Inc. His work relies on microseismic measurements during hydraulic stimulation to quantify dynamic stress changes in the reservoir and develop accurate fracture models to simulate proppant placement and forecast production. McKenna has more than 20 years of engineering geology experience, and is the primary inventor of three U.S. patents. He holds a B.S. and an M.S. in geology and geophysics from the University of Georgia, and a Ph.D. in geological engineering from the Colorado School of Mines.
For other great articles about exploration, drilling, completions and production, subscribe to The American Oil & Gas Reporter and bookmark www.aogr.com.