


Downhole Insights Power Frac Design
By Colter Cookson
For completion engineers to design hydraulic fracturing jobs that have the right stage spacing, pump rates and frac fluid chemistries, they need to reach accurate conclusions about the downhole environment. Only then will they be able to place clusters in rock with similar qualities to maximize cluster efficiency, predict how far fractures will extend to minimize interference between wells, and identify the most effective chemistries for maximizing proppant transport.
Fortunately, the industry is getting better at assessing downhole conditions. Today, service companies report completion engineers can create pseudo logs from readily-available surface drilling data, characterize fracture networks after each stage without disrupting their operations, and send fast-moving cameras down hole to measure perf erosion, an indicator of proppant placement.
As modern completion software simplifies data collection and analysis, the information operators gather about each well is becoming easier to turn into better fracs. Meanwhile, service companies say electric frac fleets and advanced friction reducers are allowing pressure pumpers to deliver higher-quality completions at a lower cost.
Surface drilling data is one way completion engineers can gain useful information, says Mohit Paryani, an engineering team lead with FracGeo. “Detailed logs would be better, but because acquiring logs in the lateral is expensive, FracGeo has developed models that transform surface drilling parameters, which we already collect, into information about the reservoir. These models are based on corrected mechanical specific energy (CMSE), or the amount of energy the bit needs to break the rock.”
Mechanical specific energy models have been used to estimate rock elasticity for years, says Peter O’Conor, the company’s vice president of sales and marketing. “In the past, they worked well for relative comparisons but lacked the accuracy to estimate absolute values,” he says. “One of the biggest issues is the amount of energy lost to friction between the bit and the surface, which can cause surface parameters such as torque, rate of penetration and weight on bit to be misleading unless we correct for friction.”
With new models that accurately evaluate torque and drag, O’Conor says those corrections can be made quickly and easily. He adds that surface drilling parameters now can be used to estimate pore pressure, differential stress and natural fractures in addition to rocks’ static mechanical properties, thereby accounting for all major frac gradient drivers.
“In some cases, the drilling parameters can be even more accurate than log-based information,” O’Conor says. “For example, Equinor worked with us to estimate pore pressure across a multicounty asset in the Eagle Ford play and compared the results with direct measurements and traditional estimates based on rock compaction. Relating pore pressure to compaction works well for young, Gulf Coast-type rocks in conventional plays, but CMSE is a better fit in tighter formations, so the drilling-derived estimates were more accurate.”
Fast Simulations
To turn data on static rock properties, pore pressure, differential stress and natural fractures into the right decisions, operators often use simulators to see how fractures are likely to propagate and to predict stimulated reservoir volume, O’Conor notes.
“This data can be transferred to a reservoir simulator to estimate production and depletion,” he comments. “Understanding depletion is vital for determining the best lateral spacing to avoid frac hits or other interference between wells.”
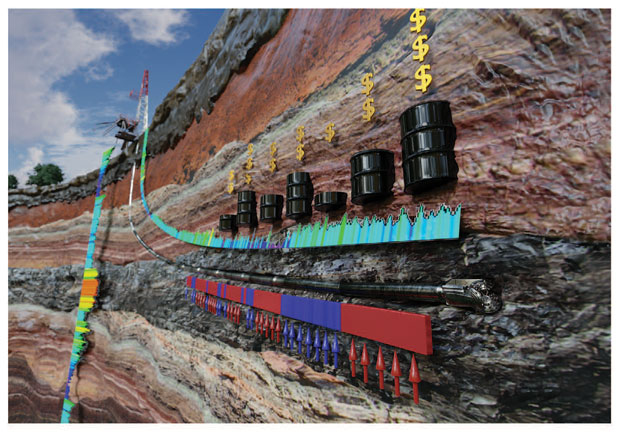
With new models, surface drilling parameters such as torque and weight on bit can be turned into accurate pseudo logs of differential stress, pore pressure, natural fractures, porosity and static geomechanical properties, FracGeo reports. In addition to guiding geosteering during drilling, these pseudo logs can be combined with fast simulations to help operators pinpoint the best completion designs.
FracGeo’s fast reservoir simulator can analyze a given stimulated reservoir volume’s effect on production, reservoir depletion and child wells in only a few minutes, O’Conor reports. “This is much faster than a conventional numerical simulator, which could take several hours to make the same calculations,” he says. “We are able to achieve that speed without a meaningful loss in accuracy using a simulation technique called the fast marching method, which solves the diffusivity equations using one-dimensional approximations. This allows operators to test more ideas.”
O’Conor mentions that FracGeo is working with a consortium of operators–including majors such as Shell and Total, as well as independents such as Anadarko Petroleum, Jagged Peak Energy, DJR Energy, SRC Energy, Sundance Energy, Painted Pony Energy and Wintershall Dea–to improve models for estimating vertical frac growth. He explains that many of the traditional models were developed for conventional reservoirs and tend to overestimate vertical frac growth.
“One of the reasons for that overestimation is geologic interfaces, or the boundaries between beds,” he says. “If the boundaries have an imperfect seal, or weak interfaces, the frac fluid can slip between the beds and travel along them. In that situation, some of the energy gets put to the side instead of going upward, as the old models assumed.
“To allow more people to try our simulators, we are putting parts of our technology into a cloud-based app,” O’Conor reports. “With that app, users will be able to take surface drilling data, engineer completions, and get production and economic forecasts, much as they can in our traditional software. But because it does not need to be installed on local machines and can be licensed on an as-needed basis, it will be easier to try and less expensive once the user sees the value.”
Real-Time Monitoring
Given how much geology can vary from stage to stage, even within a single well, operators are moving away from optimizing completion programs by conducting intense but expensive tests on science wells, says Panos Adamopoulos, founder and chief executive officer of Seismos Inc. Instead, he describes, they are using modern technology to understand the subsurface and evaluate completions quickly so they can iterate from well to well or even stage to stage.
According to Adamopoulos, one of the most effective evaluation methods involves sending acoustic pressure pulses into the well after each frac stage and using the reflections to reveal the fractures’ height, half-length and width, as well as the fracture network’s near and far-field complexity, conductivity, and proppant placement.
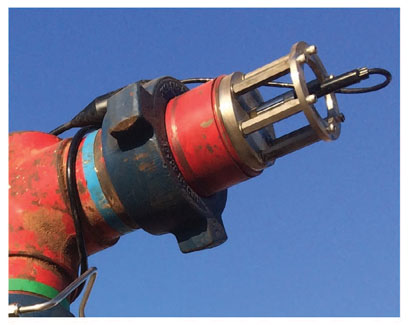
This wellhead instrument records acoustic pulses that allow Seismos Inc. to characterize fracture networks on a per-stage basis and provide information operators can use to refine their completion parameters. The company emphasizes that the technology works without requiring any extra downtime, changes to hydraulic fracturing procedures or offset wells.
“This technique gets data to the frac van in near real-time,” Adamopoulos emphasizes. “This is extremely powerful, because it means the completion engineer can make adjustments from stage to stage until the fracture network has the desired characteristics.”
Such real-time optimization can yield significant production increases, Adamopoulos says. “The size of the increase is all over the place because of variations in reservoir quality and the base line completion design’s effectiveness, but in general, it exceeds 10%,” he says. “We frequently see increases in production, but most importantly, more sustainable pressure depletion.”
In one of the more dramatic applications, the well completed with real-time adjustments was producing 32,000 barrels of oil equivalent and had a wellhead pressure of 900 psi 50 days after it came on line. By that point in its life, the offset’s production was at 18,000 boe with a wellhead pressure of 300 psi, Adamopoulos relates.
“The equipment’s footprint is almost zero,” he says. “To read the acoustic pulses, we put a small instrument module on the wellhead, which takes less than half an hour. There is no change to the frac job and no need for offset wells, geophones or other equipment, so it is a plug-and-play solution.”
The acoustic pulses travel down hole through the wellbore fluid, dissipate into the fractures, and reflect back, Adamopoulos describes. Because the reflections only need to travel a short distance and do so through the wellbore fluid rather than the rock, he says they can be measured accurately without geological models, which often incorporate assumptions that might be incorrect. “This makes our error bar extremely small,” he reports. “In fact, from tests where we could compare the measurements with core data, we know it is less than 5 percent.”
In addition to characterizing the fracture network after each stage, the acoustic pulses can analyze each stage’s perforation tunneling before pumping begins to warn the operator when stages may be difficult to treat, Adamopoulos mentions. He says this can allow changes in the completion fluid’s chemistry or the stage’s pumping schedule to minimize the amount of pressure and time needed, as well as the risk of screening out.
“These connection checks act like insurance,” he says. “The adjustments made to the completion chemistry might cost $3,000-$4,000 for each stage the service flags, but that is far less than bringing a coiled tubing unit on site to deal with a screen-out, which can cost north of $100,000.”
Downhole Video Analytics
With the right analysis, downhole cameras can help completion engineers evaluate cluster efficiency, says Todd Lilly, senior technical sales adviser for U.S. land at EV. “By using cameras to capture images of the perforations and dimensioning those perforations with cutting-edge video analysis software, we can measure how much each perf has eroded. The more extensive the erosion, the more proppant went into the perf,” he explains.
To calculate each stage’s eroded area, the company needs to know each perf’s initial size. “A bigger hole has more exposed surface area, so it will tend to erode faster than a smaller one,” Lilly says. “A few operators record the perfs before the frac to capture their pre-frac size, then go back afterwards to capture the erosion. But to save time and money, we generally recommend shooting perforation reference holes that are never fracced. These reference holes allow us to estimate the other stages’ starting perforation sizes at each phase angle, eliminating the need for prefrac camera runs.”
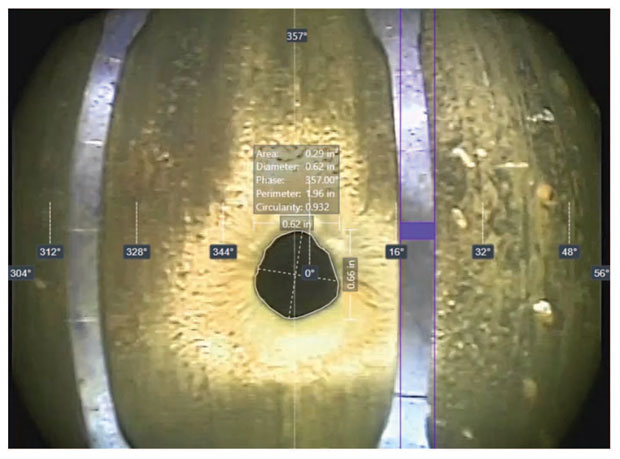
By using sophisticated software to analyze videos from downhole cameras, EV says it can measure perforation size to a hundredth of an inch, allowing it to determine how much each perf eroded during the frac. Because proppant causes most of that erosion, the company then estimates how much proppant each perf received to help operators identify completion parameter combinations that distribute proppant more evenly.
The videos are sent to an office in Houston for analysis, Lilly relates. “While we do extensive quality checks, much of the work is automated,” he says. “Since we know the size of the tool assembly’s centralizer blades, our software uses them as a reference to calculate the size of each perforation, then compares that with the reference hole values to determine the amount of erosion. The measurements are proven accurate to within a hundredth of an inch.”
The software tallies the total eroded area for each stage, breaks that into percentages for each perf, and applies those percentages to the amount of proppant pumped during the stage to estimate how much went into each cluster, Lilly outlines.
“When the clusters within a stage are of like design, proppant tends to more heavily penetrate the heelside clusters because more sand flows by and through them,” Lilly notes. “However, operators can achieve more even distributions by modifying completion parameters such as the charge type to vary hole sizes, putting more perfs toward the toe and experimenting with proppant mixes and diversion methods. We often see clients test multiple configurations in one well so they can identify the most effective parameter combinations and apply those to the next project.”
EV has analyzed erosion in more than 65 completions in the onshore United States, Lilly reports. He credits many of those jobs to a newly commercial tool that speeds each run and significantly reduces the associated costs.
“Previous camera technology allowed for a downhole camera and a single side-view camera, which meant we needed to stop at every perf and rotate the side-view camera to find the hole. That process took five-eight minutes for each perf, so analyzing a high-stage count completion could take several days. Also, because the cameras required live transmission to surface rather than storing the video internally, we had to run them on an e-coil or tractor. That made using cameras to analyze perforations cost-prohibitive for all but majors and large independents.
“With our new tool, that has changed,” Lilly contrasts. “As the industry’s first true sideview memory tool, it has four cameras in an array, allowing it to capture 360 degrees of the wellbore while maintaining a constant logging speed of 15 feet a minute. Also, it can be sent down hole by virtually any deployment method, from standard coil to stick pipe. This shortens the typical time from rig up to rig down to 10-12 hours and dramatically reduces system cost to the operator.”
Lilly adds that the tool’s 360-degree coverage can reveal other issues, such as casing damage from leaking plugs or plug drill outs.
“The perforation analysis service’s final deliverable is a comprehensive database and report detailing completion efficiencies at the perf, cluster and stage levels independent of the assumptions and interpretation of production data,” Lilly says. “The service often complements other evaluation techniques. For example, it provides a volume component to tracer surveys, a calibration reference to fiber-optic distributed acoustic sensing, and more accurate perforation dimensions to ultrasonic imaging. However, it is increasingly being deployed on its own.”
Making Data Usable
Pressures, pump rates and other data collected on the frac site is stored in unwieldy formats, says Joshua Churlik, CEO and co-founder of Well Data Labs. “By default, the raw data is locked in 300-page PDFs or comma-separated value files that are poorly structured and difficult to use in near-real-time analysis,” he assesses. “To turn those files into something usable, we developed a platform that extracts the data, normalizes it and presents it in meaningful ways.”
Instead of e-mailing PDFs or CSV files to the operator, service companies log into the platform and upload the files after each stage or job. At that point, Churlik says the software checks for thousands of quality issues, such as missing labels or time stamps, and corrects or flags them.
“For operators who work with multiple frac companies, it’s common for equivalent data fields to have different labels or units,” Churlik mentions. “For example, one crew might label the treating pressure ‘treating pressure,’ while another calls it ‘Bob’s truck pressure.’ We normalize those labels so it’s easier for operators to analyze the data and optimize their completions’ cost efficiency.”
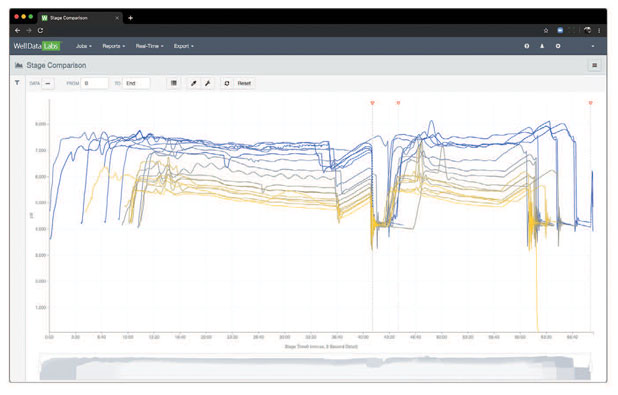
Well Data Labs says its platform normalizes completion data and presents it in a userfriendly way quickly enough to allow completion engineers to adjust their completion designs after each stage.
Once the data is in the platform, Churlik says the operator can make it available to anyone who needs to see it, such as frac consultants and other value adding service providers. “This is much faster than digging through e-mail to find the PDF with the data, than forwarding it,” he comments. “It allows the operator to create workflow efficiencies and get more value from their post-stage service providers.”
One of the platform’s common uses involves looking at post-stage data to compare chemical usage with horsepower in order to optimize chemical costs and ensure they are tuned equally across shifts, Churlik relates. He adds that many operators perform stage-by-stage analyses to determine whether they should modify the completion design.
“During the next 12-18 months, the frac space will move toward real-time analytics fueled by machine learning,” he predicts. “To support that, the platform gives data scientists and completion engineers the ability to create and deploy machine learning models that analyze historical and real-time data and alert them when something they care about happens. For example, they may want to know when treating pressure behaves abnormally or when the chemical usage changes.”
“Once those models are trusted, they can be deployed to the front lines, where they will inform engineers, consultants and frac hands when something needs their attention and help them make better and faster decisions,” Churlik outlines. “This gives data scientists and completion engineers a way to collaborate and bring their proprietary insights to the field more easily.”
To maximize machine learning and predictive analytics’ benefits, Churlik encourages operators to invest in project managers who understand change management best practices. “It is important for real-time analytics to have an executive champion,” he stresses. “If the project gets pushed too deep into the organization–a common pitfall–the implementation team may lack the power to make necessary changes to the company’s procedures or to get information quickly from colleagues who don’t see the project’s value.”
One issue with which the implementation team will need to grapple is who receives the alerts and who has the authority to act on them, Churlik notes. “Most operators likely will start by sending the notifications to an engineer in the office,” he muses. “If the authority to act on the notifications lies with someone else in the field, such as a specific job’s consultants, it may make more sense to include them in the notification and establish clear decision making expectations.”
Electric Frac Fleets
In addition to reducing noise and emissions, electric frac fleets offer low operating costs, according to Jared Oehring, the chief technology officer for U.S. Well Services, which operates both electric and diesel fleets.
“The biggest savings come from using a natural-gas-fueled turbine to power the equipment,” Oehring says. “On almost every pad, we are able to run on field gas. This cuts fuel costs as much as 95 percent, saving customers up to $1.5 million a month for each electric fleet they contract,” he calculates. “If field gas is not available in sufficient quantities, we can switch to compressed or liquefied natural gas, which still is much cheaper than diesel.”
The fuel savings will become more significant with time, Oehring predicts. He explains that the International Maritime Organization’s 2020 fuel standard, which requires ships to switch to low-sulfur bunker fuel, could increase diesel prices significantly.
Taking diesel delivery trucks off the road improves employee safety and community relations by reducing congestion and the risk of accidents, Oehring says. “Another safety benefit comes from eliminating the need for hydraulic oil, turbochargers and diesel engines, the primary causes of fires on frac sites,” he says. “If a fire does occur, the turbines are equipped with detection and suppression systems so they can put it out quickly.”
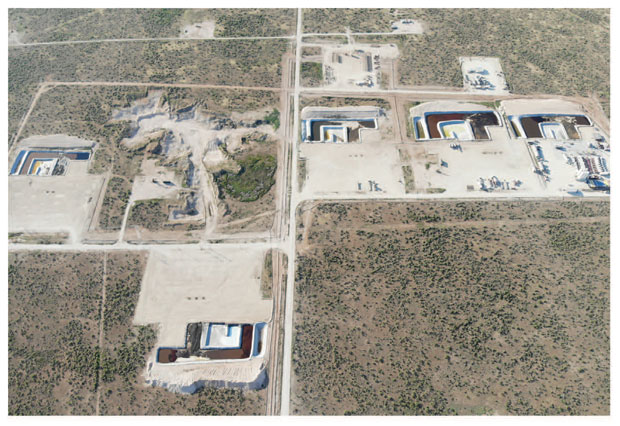
Because they are powered by natural gas rather than diesel, electric hydraulic fracturing fleets greatly reduce emissions and fuel costs, according to U.S. Well Services. To reduce the amount of time spent moving a fleet from one pad to the next in areas with several nearby pads, the fleet’s natural gas turbine can be set up once and connected to the active pad using overhead power lines.
Oehring says turbines and electric motors produce less sound than diesel engines. “Electric fleets generate as much as 95 percent less low-frequency noise, which is the source of most noise-related complaints because of how far it travels and how much it shakes peoples’ homes and bodies,” he details. “The fleets also cut audible noise by 80 percent. In fact, we had one sound surveyor complain that crickets were interfering with his noise monitoring once he got to the edge of the pad.
“Nothing compares with the reliability, efficiency and longevity of all-electric systems,” Oehring enthuses. “They replace potential failure points such as hydraulic hoses and valves, as well as consumables such as oil and filters, with components that are designed to last 25 years.”
Because those components require minimal maintenance and place less strain on frac pumps, U.S. Well Services generally is able to reduce in-shop maintenance when using its electric fleets, Oehring reports.
“The electric engines give us pump rate flexibility,” he adds. “They are not bound by gears, so we can pump 0.4 barrels a minute or 5.0, 5.1, or 5.2 barrels a minute as needed. For example, if our real-time monitoring shows that a pump is starting to shake, we can adjust the speed to get out of a resonance zone and keep it running in the most efficient and longest-lasting manner possible.”
Eventually, Oehring says electric fleets will become standard. “Diesel fleets will continue to be more economic for small jobs that involve refracturing or drilling a single well, but for multiwell pads, electric fleets almost always offer better economics,” he argues.
In areas with several nearby pads, Oehring says fleets can improve those economics by installing a turbine near one pad and connecting it to others through overhead power lines. “For a project in the Permian Basin, we linked five pads that were 1.5 miles apart,” he says. “This let us keep the turbine in one place, which reduced the time to shut down the fleet and move it to the next pad from two or three days to 24 hours.”
Completion Fluids
Optimizing frac fluid chemistry can be complex, says Dave Grottenthaler, who heads Chemstream’s oil field division. “To design the most cost-effective fluid, chemical providers need to put science behind every decision,” he emphasizes. “We cannot assume the geology and water quality will remain the same from job to job.”
Before the completion crew gets to the pad, Grottenthaler recommends analyzing cuttings’ geochemistry to determine the most likely sources of scale and select an appropriate inhibitor. He also suggests conducting microbiocide efficacy studies and running friction loop tests to identify the microbiocides and friction reducers that will offer the lowest total cost for a given water quality and area.
“During the job itself, it’s often worthwhile to periodically test the water for bacteria and analytes of concern, such as barium, sulfate, calcium and iron, especially if the water source or the ratio between produced and freshwater has changed,” he says. “After the plugs have been cleaned out, testing the water again can show whether the chemistry succeeded at minimizing the risk of scale and bacteria growth.”
Application-specific chemistry generally reduces chemical consumption or improves well performance enough to justify the extra investment, Grottenthaler assesses. He says the laboratories and equipment needed to conduct the necessary tests also give chemical providers powerful tools for research and development.
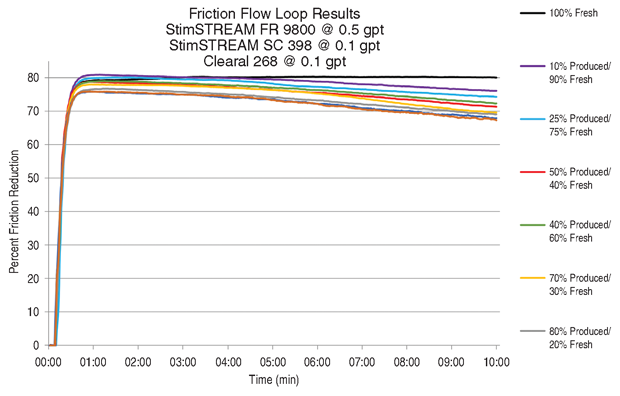
Flow loop tests and field trials show that a new friction reducer from Chemstream retains its effectiveness in low-quality water, including 100 percent produced water. The company says the FR works in small dosages, allowing it to minimize the chemical costs associated with hydraulic fracturing.
“Through that research, we are producing more effective microemulsions, surfactants and clay control additives,” he reports. “However, the advancement I’m most excited about is a nanodispersion FR that viscosifies the frac fluid to improve proppant transport while significantly reducing friction.”
As a dispersion, the friction reducer has a higher charge density, molecular weight and solids concentration than the emulsion-based FRs traditionally used, allowing it to activate more quickly and effectively, Grottenthaler says. “The extra lubricity means frac crews can achieve the desired pump rate–whether it is 100 or 105 barrels a minute–at much lower pressures, which minimizes formation damage. It also significantly reduces dosage rates and total chemical costs,” he says.
Because of their reduced formation damage and better proppant placement, wells completed with the nanodispersion generally produce 10-30 percent more than offsets, Grottenthaler reports. While the improvement varies widely from well to well based on the geology and frac design, he says it is significant and consistent enough that the nanodispersion quickly has become the FR for 30-40 percent of Marcellus and Utica wells.
“Many of those jobs are completed with 100 percent produced water, which emulsions struggle in because it contains calcium and dissolved or ferrous iron,” he mentions. “The calcium hardness can stop the emulsion’s inverting surfactant from uncoiling and building the polymer chain needed to provide lubricity, while the ferrous iron cuts the chain like a Ginsu knife.”
The nanodispersions are more resilient, Grottenthaler assures, in part because of how quickly they spread through the water and activate. “The chemistries are formulated to hydrate rapidly. In fact, they achieve maximum lubricity and begin building viscosity within three or four seconds,” he says.
Chemstream is looking for partners to take the FR into other regions, including the Mid-Continent and the Rocky Mountains, Grottenthaler mentions. “We are tweaking the formularies and experimenting with our manufacturing process to develop next-generation dispersions that offer even better performance,” he concludes.
For other great articles about exploration, drilling, completions and production, subscribe to The American Oil & Gas Reporter and bookmark www.aogr.com.