


Drilling Data Improves Completions
By Dusty Daves and Robert Downey
MIDLAND–A new approach to optimizing horizontal well completions uses detailed descriptions of rock properties derived from standard drilling performance data to tailor stimulation treatment designs based on variable rock characteristics along the length of the lateral section.
Rather than relying on “base line” designs that specify predetermined stage lengths, perforating strategies, treatment volumes, etc., leveraging drilling data to customize stimulation treatments specific to each individual horizontal wellbore has the potential to optimize fracture geometries and treatment effectiveness for improved asset performance. The technology works by extracting the portion of mechanical specific energy (MSE) that is directly related to rock removal during the drilling process and uses it as a description of rock properties (termed “rock MSE”).
Rock MSE is closely related to the unconfined compressive strength (UCS) of the rock along the lateral and can be used for completion design and evaluation purposes alone, or in combination with other measurements. The drilling performance data used to provide the rock MSE description in horizontal laterals is regularly acquired as part of horizontal well operating procedures, and no additional measurement devices or tools are required.
Using rock MSE information allows the operator to select completion stage boundaries to avoid large-scale changes in rock properties within each completion stage. It also gives the ability to determine the most advantageous locations to place perforation clusters and optimize cluster depths to minimize rock MSE variations between perforation clusters, promoting more even distribution of fluid and proppant among all clusters in a stage. Rock MSE descriptions also can be compared with fracture treatment pressures for detailed evaluation of individual stimulation treatments.
To compare the performance of standard base line completions to engineered completions using rock MSE data, a field study was conducted of four pairs of wells adjacent to one another in the Midland Basin. There were two main objectives:
· Identifying any relationships between rock MSE properties and stimulation treatment pressure responses; and
· Determining whether data-driven completion designs where perforation depths were selected for each stage using the rock MSE profile would result in statistically valid performance improvements in stimulation treatment efficiency, net pressure development, and/or well performance.
The four well pairs are on two adjacent pads, with each pad having two Wolfcamp and two Spraberry wells. Pad 1 had lower potential for interference and possible depletion effects from neighboring pads that already had been completed. There was increased risk of depletion in the four Pad 2 wells.
Each pair of wells included one well completed with a base line design stage length and number of perforation clusters per stage, and one well where the perforation depths and stage boundaries were selected from rock MSE data with additional input from mud gas measurements. The fracture treatment pressure responses were correlated to the rock properties, and the two completion methodologies were compared to determine any operational or production benefits related to the rock MSE methodology.
Distinctive Difference
The results show a clear and distinctive difference in treatment responses between the engineered completions and base line completions. The most striking difference was higher instantaneous shut-in pressure (ISIP) in wells where completion stages and perforation depths were selected based on drilling-derived rock properties, without corresponding increases in average treatment pressures. This likely indicates improved fracture containment (higher net pressures), which would be expected with equitable fluid distribution among perforation clusters. Furthermore, the analysis allowed for the identification of rock parameters associated with increased risk of excessive height growth, which is independent of the completion methodology.
Each pair of wells was completed simultaneously, alternating fracturing operations from one well to the other in a zipper frac procedure. Except for the fact that four of the wells used base line designs and four used tailored engineered designs, the completions were similar in all other respects, with the same total number of completion stages and same pumping schedules. Stimulation treatment parameters from some 400 individual stimulation treatments in the eight study wells are included in the results. After completion, treatment summaries and digital treatment data (pressure, rate and proppant concentration) were compared with rock MSE measurements in the wells with engineered completions.
The rock MSE profiles for the two Wolfcamp wells with base line completions were computed during the evaluation phase to determine if differences in results could be attributed to completion design or differences in rock properties between the two wells. The rock MSE trajectory plots for all four Wolfcamp study wells are shown in Figure 1. They illustrate the differences in well paths and rock properties along each of the laterals, as represented by the different colors used to represent rock MSE values. The same color scale is used in all images.
FIGURE 1
Rock Property Profiles in Four Wolfcamp Wells
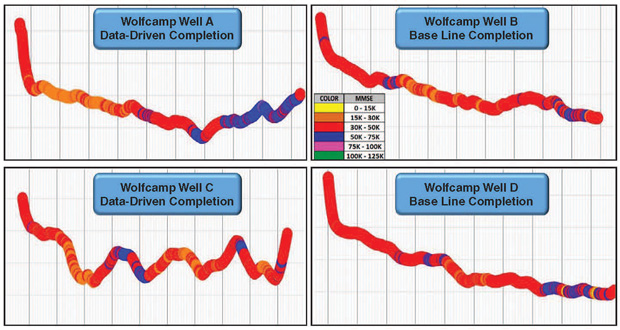
The degree to which differences in rock properties (as represented by rock MSE) can affect the stimulation treatment pressure responses depends on the completion design method, the average rock MSE values within each completion stage, and the heterogeneity of the rock MSE values among the various perforation clusters within each treatment stage.
Wolfcamp Wells
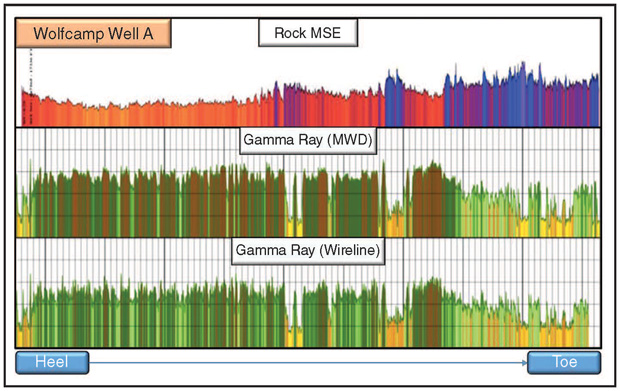
On Pad 1, Well A (engineered completion) and Well B (base line design) were completed simultaneously in the Wolfcamp with a single fracture equipment setup. The separation distance between the two wells was considered sufficient to minimize interference between the induced fractures from the two wells. The rock MSE and gamma ray plots for Well A (Figure 2) show differences in rock properties at both the heel and toe, with increasing variability at the approximate center of the lateral. The images also show good depth control, and indicate that changes in rock MSE properties occur where the gamma ray profiles show similar changes (however, it should not be inferred that rock MSE values directly correlate to gamma ray values).
FIGURE 2
Rock MSE and Gamma Ray Readings in Wolfcamp Well A
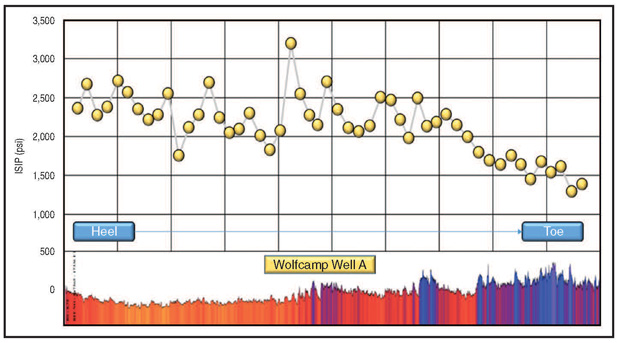
Treatment pressures while completing the Pad 1 Wolfcamp wells showed identifiable relationships between fracture treatment pressure responses and rock properties, as represented by the average rock MSE values within each completion stage. The first observation was that the breakdown pressures recorded during each of the stimulation treatments tended to increase with increasing average rock MSE values. A second observation was that ISIPs were generally lower in treatment stages with average rock MSE values in excess of 50,000 psi.
Figure 3A shows how the ISIPs compare with the rock MSE profile and rock property variability in the horizontal section of Well A. The results show that completion stage breakdown pressures are related directly to the average rock MSE values in each stage. The ISIPs are mostly independent of the average rock MSE values above and below the critical value of 50,000 psi. The lowest ISIPs are found in the section of the lateral where rock MSE values are highest, increasing as rock MSE values decrease as the completion progresses toward the heel of the well.
FIGURE 3A
Wolfcamp Well A Stimulation Treatments ISIPs
Well B’s rock MSE profile was computed after it had been completed with the base line design and placed on production. The data showed a more uniform profile throughout the entire length of the Well B lateral as compared with Well A. Based on the more homogeneous nature of the rock MSE profile, it might be expected that the breakdown pressures and ISIPs would mirror the results in the toe-downward heel section of the Well A lateral, where there was greater similarity between the rock properties in the two wells. In fact, the opposite was true.
More than 70 percent of the stimulation treatments in Well A generated more net pressure based on ISIP comparisons than the corresponding stimulation treatment stages in Well B. The breakdown pressures during Well B treatments were more randomly distributed among the range of rock MSE values and reached higher levels at lower rock MSE values. The difference is attributed to the base line perforating method where individual clusters within each stage were spaced geometrically without adjusting for the variability of rock MSE values among the cluster depths. This heterogeneity also caused breakdown pressures to become less predictable compared to the average rock MSE values for the Well B stages.
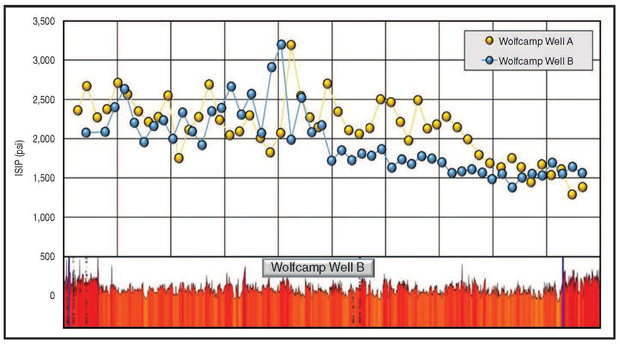
Figure 3B compares ISIPs for the two wells, with the rock MSE profile from Well B as a reference. For the first half of the total completion in Well B, the ISIPs were noticeably lower than those in Well A, although the average rock MSE values throughout the lateral were similar to those associated with higher ISIPs in Well A. It was not until half of the total number of stages were completed that ISIPs reached levels equivalent to those in Well A. The analysis shows that the base line completion produced less consistent results in a well with less apparent rock property variability according to the rock MSE profiles.
FIGURE 3B
ISIP Comparisons for Pad 1 Wolfcamp Wells
On Pad 2, previous completion and production activity had taken place near the newly drilled Wolfcamp wells, causing some concern that depletion effects might be present. Rock MSE properties were used in designing Well C’s completion while Well D used the same base line guidelines as Well B on Pad 1. Unfortunately, the digital treatment data files for the Pad 2 wells were corrupted and not usable. Therefore, results are based only on reported pressures found in the completion reports, limiting the evaluation to comparisons of rock MSE profiles and ISIPs.
The results show that ISIPs from the Well D base line completion are noticeably lower than those for Well C in sections where the two laterals had only minimal difference in average rock MSE values. In fact, the largest difference in ISIPs were observed when comparing these two Wolfcamp wells. Well D encountered rock with higher average rock MSE values in the toe-half of the lateral. The combined effects of the rock properties and increased heterogeneity produced the distinct difference in ISIPs between wells C and D.
It is also interesting to note that the ISIP differences diminished greatly as the average rock MSE values and corresponding heterogeneity decreased in the heel section of Well D during stimulation treatments. The similar decreasing ISIP trend in both wells is a possible indication of reservoir pressure depletion, suggesting that an external influence might be responsible.
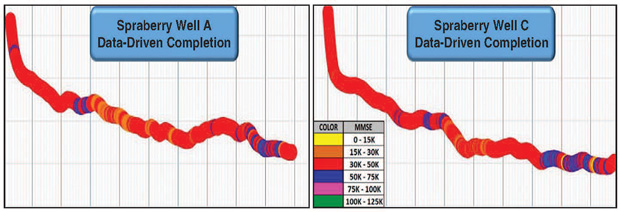
Spraberry Wells
For the four Spraberry wells, rock MSE profiles are available for only the two engineered completions (wells A and C), as shown in Figure 4. Offset wells B and D completed with the base line design were assumed to have no significant differences in rock MSE profiles compared with wells A and C.
FIGURE 4
Rock MSE Profiles for Spraberry Wells (Engineered Completions Only)
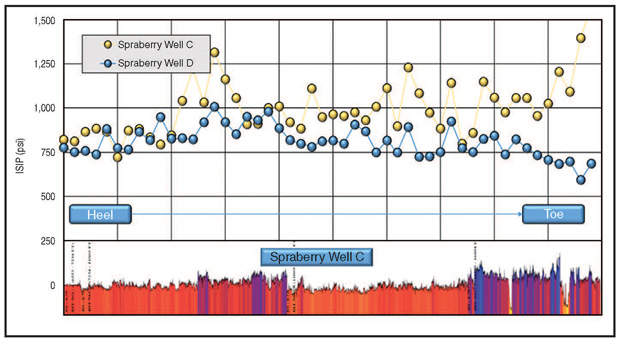
Figures 5A and 5B compare the ISIPs for both the engineered and base line completions, the first for Pad 1 (wells A and B) and the second for Pad 2 (wells C and D). As with the Wolfcamp treatments, no linear relationship was observed between ISIPs and rock MSE values in the Spraberry wells. However, this observation should not be interpreted to mean that end-of-stage fracture geometry was independent of near-wellbore rock properties. Instead, the data indicates that the degree of rock property heterogeneity among perforation depths within individual treatment stages played a role in net pressure development through its effect on the distribution of fluid and proppant within perforated intervals.
FIGURE 5A
ISIPs for Pad 1 Spraberry Wells A and B
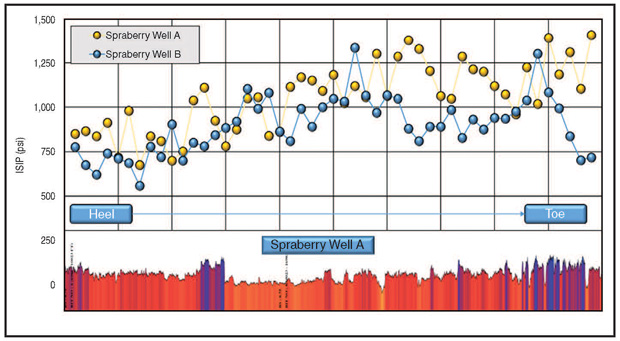
FIGURE 5B
ISIPs for Pad 2 Spraberry Wells C and D
Increased heterogeneity was assumed to exist in the base line completion treatments as compared to the data-driven completions. If the variability in rock properties is large enough that the distribution of the fluid and proppant favors only a limited number of perforation clusters, fracture geometry can be affected. Reducing rock property heterogeneity within the perforation clusters for each stage promotes more equitable distribution of the stimulation materials and better fracture height containment, as shown by the differences in ISIPs.
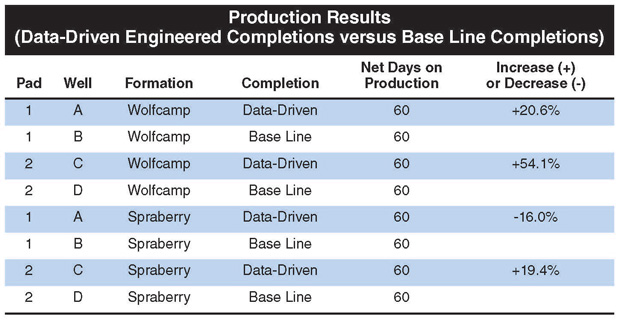
Table 1 shows total oil production during the first 60 days of continuous production for all eight wells. The percent changes are the differences between the total production of the well with data-driven engineered completions and their respective offsets with base line completions. Spraberry Well A on Pad 1 experienced some difficulties and flow rates were limited for several days before continuous production operations could be established. However, cumulative production for Well A after the production difficulties had been resolved is nearly identical to Well B.
TABLE 1
Despite difficulties encountered with the field data on the Pad 2 wells, the results of the study confirm that rock properties computed from data recorded while the horizontal section is being drilled can be helpful in evaluating pressure measurements during stimulation treatments.
The results of the Midland Basin study provide a clear path forward to improving future wells by understanding how rock properties and completion design relate to fracture height growth. This allows for a re-evaluation of future drilling targets and the modification of treatment designs to maintain the maximum amount of fracture energy within the target zone. It also will help to provide further evidence that completions can be improved through the optimized placement of stage boundaries and perforation clusters.
DUSTY DAVES is senior operations engineer at Legacy Reserves Operating LP, responsible for supervising drilling and completions operations in the Permian Basin. Before joining the company in 2007, he was a drilling and completions engineer for Mewbourne Oil Company in the Texas Panhandle and eastern New Mexico. Daves holds a B.S. in petroleum engineering from Texas Tech University.
ROBERT DOWNEY is technical adviser for the Mid-Continent region for Drill2Frac LLC, specializing in using drilling-derived rock data to design staging and perforation strategies for horizontal well stimulations. Before joining Drill2Frac, Downey had a 27-year career at Schlumberger in production and stimulation engineering positions, including serving as principal engineer and interpretation manager for microseismic services. He holds a B.E. in mechanical engineering from the University of Saskatchewan.
For other great articles about exploration, drilling, completions and production, subscribe to The American Oil & Gas Reporter and bookmark www.aogr.com.