


Drilling Mud Returns Contain Valuable Insights About Proppant Distribution
By Debotyam Maity and Jordan Ciezobka
DES PLAINES, IL.–A new proppant log technique using drilling mud returns from child wells was developed using through-fracture cores at the Hydraulic Fracturing Test Site in the Midland Basin (HFTS 1) and validated through actual mud return samples from test wells at HFTS 2 in the Delaware Basin.
The proppant log methodology provides qualitative as well as quantitative insights into spatial distribution of proppant sand particles from the prior stimulation of parent wells. As a child well is being drilled, periodic mud return samples are collected at the rig site and preserved for analysis. The workflow involves systematic cleaning of the samples and segregating into relevant size fractions of interest (i.e., < mesh 20) based on specifications of pumped sand during parent well stimulation.
The clean samples are imaged using high-resolution transparency scanning. Scan images are then systematically analyzed for particles of interest using computer vision techniques. Sample counts are further validated using elemental analysis of smaller subsamples at various depths. This step is necessary to isolate proppant versus other naturally occurring minerals such as sulphates and carbonates with similar optical properties.
Using the approach at HFTS 2, proppant distribution was correlated successfully against the existing parent well and validated propped versus relatively unpropped zones for a child well. A plethora of data available at the test site allows spatial proppant distribution to be correlated against variability in stimulation response based on independent observations such as image logs, microseismic attributes, and distributed acoustic sensing, all of which tend to corroborate one another. One of the significant successes of this project was accurately describing varying degrees of impact of the parent well along the lateral length of a stimulated child well.
The workflow represents a systematic and one-of-a-kind interpretation of spatial proppant distribution while drilling child wells. The insights provide unique opportunities to better understand the current state of the target reservoir, including zones that are likely more drained relative to others and how the planned completion of the child well can be improved. Finally, the log can be useful for validating optimal well spacing in new field development.
Earlier through-core experiments at the Midland Basin HFTS 1 provided insights regarding proppant transport and far-field screen out behavior, and helped explain propped fracture growth as associated with various stage and cluster designs. However, proppant particles can be detected in other subsurface samples as well, such as mud returns. Researchers recognized that if samples could be analyzed systematically, it might be possible to generate a useful proppant log for infill well drilling, and in turn, help improve infill hydraulic fracturing programs.
HFTS 2 Project
The study was piggybacked on other tests being carried out as part of HFTS 2. The test area already had pre-existing producing laterals (BR1H/BR2H) and the mud return samples were collected while drilling the B2H child well. The sampling process involved collecting a slipstream of mud returns to get a subsample for later analysis to search for proppant at predetermined depth intervals. Each composite sample is based on the depth range when the sample was collected.
In terms of the relative positioning of the child well versus BR1H and BR2H, the parent wells’ laterals are much shorter than the child well. Furthermore, the distance of the new lateral with respect to the parent laterals is 375 feet above and 700 feet to the west of BR1H and 125 feet below and approximately 1,400 feet to the west of BR2H. The parent wells were typical plug-and-perf slickwater completions with 20-22 frac stages at 200-foot spacing. The stages typically had six clusters and 100-mesh sand.
The high-resolution log images capture most of the proppant and provide a reasonably accurate quantitative indication of the number of particles present in the imaged sample. For quality control, scanning electron microscopy and energy dispersive X-ray spectroscopy analysis is incorporated to accurately discriminate actual proppant from other proppant-like particles such as calcites and sulphates, which also can be on the scale of 100-mesh sand (≤100 microns). In fact, actual samples from the field suggest that 100-mesh sand particles can be as small as 60 µm.
Two sampling rates were tested for the proppant logging experiment. Initial samples were captured at a rate of one sample every 30 feet. The sampling rate was increased later to one sample every 90 feet The sampling rates and identified proppant counts are shown in Figure 1, with the positioning of parent laterals BR1H and BR2H for context. The red curve shows proppant counts. The blue curve shows other proppant-like mineral counts. The dotted black trace shows the sampling rate.
FIGURE 1
Identified Normalized Proppant Counts at Logged Locations in B2H Child Well
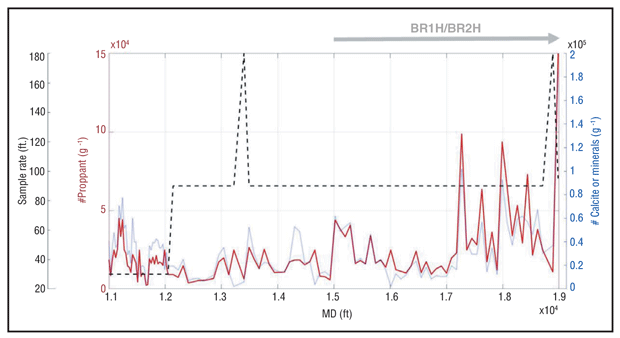
Widely varying proppant distribution was observed across the logged lateral. However, at first glance, it appears that the toe of the child well had significant pre-existing proppant particles logged when compared with the rest of the well. The proppant counts from the log are displayed as normalized with respect to the total sample weight imaged and analyzed so that counts are normalized per gram of sample collected at any logged locations.
Absolute proppant counts as well as particle ratio (proppant versus other minerals) are required for accurate interpretation. Sampling locations with lower counts but high ratios are indicative of proppant presence, just not in large quantities. There are multiple ways to develop a thresholding or normalization criteria such that both these measures can be used to decide locations that are propped and likely to be drained versus locations that are relatively unpropped or zones with other issues (such as localized proppant screen out).
Study Results
An important indicator for presence of proppant in the samples, apart from the actual counts, is the ratio of proppant to other mineral particles. if the sample preparation protocols are appropriate and consistent, one should see higher ratios where proppant particles are observed in the samples.
A significant increase in the ratio of proppant to other mineral particles was observed in the zone corresponding to the shadow of the parent laterals. This result was validated using open-hole oil based microimager (OMBI) log interpretations to correlate possible hydraulic fractures with observed proppant distribution.
The OMBI data was used to identify the distribution of subvertical fractures in the B2H child well and compare the location of fractures with the identified proppant distribution. The two datasets (Figure 2) show a strong correlation between the zone where significant and likely hydraulic fractures begin (laterally proximal to BR1H/BR2H) and the initiation of significant proppant particles. This validated the broader proppant particle distribution, particularly the relative proppant count, which is the strongest indicator of presence of proppant particles.
FIGURE 2
BR1H/BR2H and TR7H/TR8H Parent Well Fracture Intersection Corridors with B2H Child Well
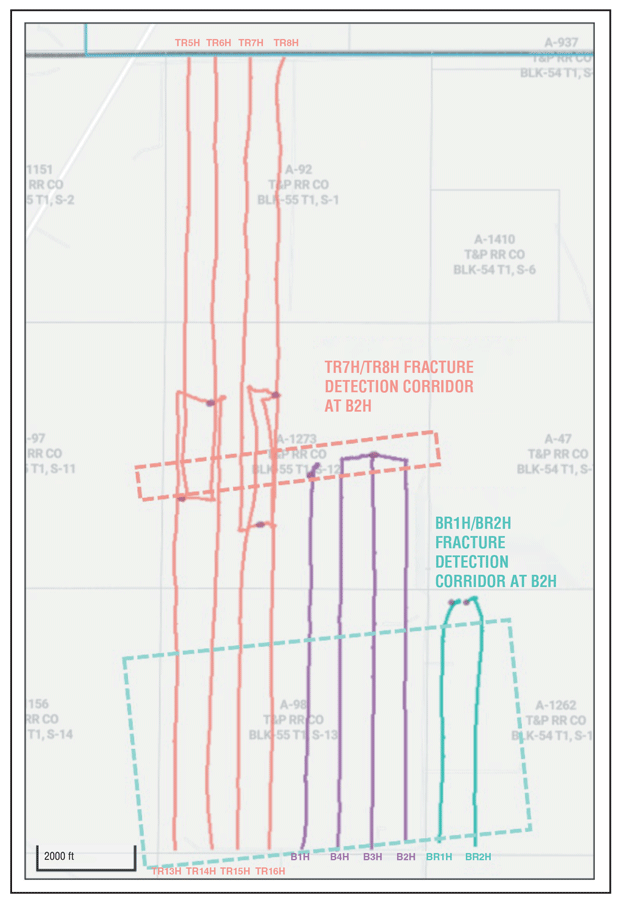
There were sections along the parent laterals where identified proppant counts were relatively low, from 16,000 to 17,000 feet MD, for example. However, since very high relative proppant counts were observed in these areas, these depths and sections were interpreted to be proppant rich. Interestingly, significant proppant peaks are apparent in the heel end of the B2H lateral at the shallowest measured depths along the sampled interval. These peaks correlate with significant subvertical conductive fractures, as observed from image log data. The BR1H/ BR2H parent laterals cannot explain this observation.
The most likely explanation is that these fractures are associated with other pre-existing parent laterals (TR7H/TR8H) to the west of the pad. Figure 2 shows a schematic representation of these wells and the expected hydraulic fracture corridors, or windows, as observed in the B2H child well. Importantly, these observations suggest that proppant is transported significant distances from the treatment well. In the case of BR1H/ BR2H parent laterals, approximately 1,400 feet, and in the case of TR7H/TR8H parent laterals, more than 3,000 feet of transverse fracture growth and proppant transport. Also based on independent observations, we believe that some of these propped zones may have a significant impact on fracture growth in child wells and may affect well productivity.
The interpreted fracture gradients from the pump shut-ins for various stages also can be a good indicator of significant impact of parent wells on the stimulation of child well stages. We can map the fracture gradients for various test wells and a visual comparison suggests that there is a clear impact of parent BR1H/BR2H drainage zones on the stimulation of B2H. The effect is obvious across the toe-half of B2H along the BR1H/BR2H wells. Lower fracture gradients (or instantaneous shut-in pressure) are indicative of a reservoir with much higher differential stresses because of drainage zone overlap.
Parent Well Influences
Apart from observed frac gradients, the pre-existing BR1H/BR2H wells can expected to influence fracture growth behavior in the new child well. If we expect no significant propped fractures from parent wells intersecting the B2H, we expect fracture growth toward (B3H) and relatively more uniform fracturing on both flanks of the well. On the other hand, with significant propped fractures from parent wells intersecting B2H, we would expect reduced fracture growth toward B3H (i.e., more skewed fractures toward the parents). Due to expected variations in fracture growth behavior across the B2H, we can verify whether expressions of such growth can be observed in microseismic event distributions as well as cross-well strain response behavior or cross-well communication.
This behavior then can be reconciled with observed variability in proppant distribution across the logged B2H. Figure 3 shows variability in microseismicity across the pad. The panel at left shows microseismicity mapped using all captured events, while the panel at right shows only high-confidence events.
FIGURE 3
Microseismicity Distribution during B2H’s Stimulation for Stages across BR1H/BR2H Parent Wells (All Captured Events versus High-Confidence Events)
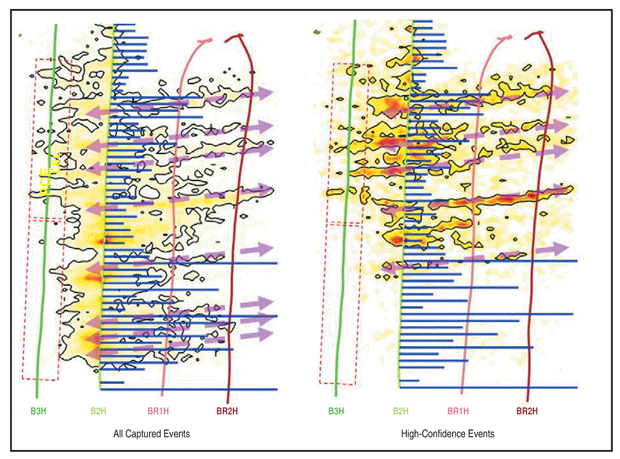
The microseismic surveys were well controlled multiarray (three) acquisitions. An “event density” parameter was used to display the arial spread of microseismicity observed during fracturing of B2H stages. In addition, proppant distribution observed from the log in B2H is mapped as blue bars, with the length of the bars indicating relative proppant counts/density.
Despite the large sampling interval associated with the proppant log data (one sample every 90 feet), large local peaks in the proppant data seem to correlate with identifiable microseismic event features propagating toward the BR1H/BR2H parents. Because of acquisition geometry, there were no significant events proximal of the toe-ward stages in B2H, leading to fewer events close to the toe. Also, for the high-confidence events, we use a cutoff of travel time misfit < 2.5 milliseconds and at least two arrays for source location triangulation.
Cross-Well Communication
The study also investigated cross-well communication between B2H and B3H while B2H was being hydraulically fractured using permanently installed fiber optics in B3H to monitor B2H treatments for cross-well strain measurements. As indicated, BR1H/BR2H fractures in B2H will cause preferential fracture growth eastward toward the parent laterals and reduced cross-well communication with B3H to the west of B2H.
Figure 4 shows cross-well strain measurements along the fiber in B3H mapped at the depths associated with the corresponding stages in B2H. Along with the cumulative strain observed, the figure highlights the identified fractures observed to intersect or communicate with B3H during B2H’s fracturing. These are shown using the green vertical lines for a relative distribution. Each data point along the blue curve (as well as each green bar) represents data for a corresponding B2H stage. This entire depth interval is situated across the BR1H/BR2H laterals.
FIGURE 4
Cross-Well Strain Response Parameters Observed in B3H during treatment of B2H’s Stages
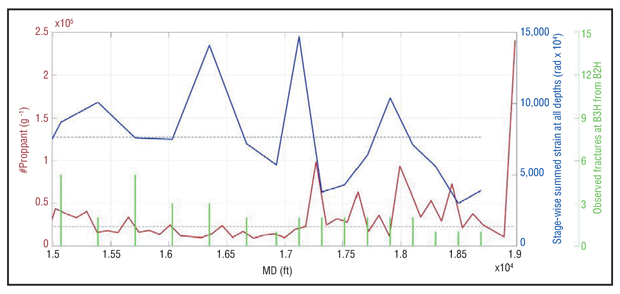
In zones with fewer significant pre-existing propped fractures from BR1H/BR2H parents (15,000-17,250 feet MD), fractures grow more uniformly compared with the toe-end of the well (17,250-18,750 feet MD. The toe-end sections show significant propped zones and show fewer fractures growing westward toward B3H, indicating much higher preferential growth eastward toward BR1H and BR2H. Therefore, fractures in this section are likely more skewed toward the parent wells. The lower summed strain response in the toe-end section also corresponds with fewer interpreted fractures observed in B3H.
Looking at cross-well communication observed at B4H versus observed communication at B3H during B2H fracturing, an interesting phenomenon became apparent regarding preferential fracture growth toward B4H versus B3H: fracture growth toward the two westward wells was more uniform in the heel-half, but skewed toward B4H in the toe-half. B4H is located at a shallower depth compared with B2H, while B3H is deeper. Deeper fractures would be expected to be significantly more propped compared with shallower fractures from proppant settling behavior. Therefore, it was assumed that fractures would have significantly more drainage in the deeper layers than in shallower layers with respect to observed fractures/proppant in B2H.
This would lead to the conclusion that more preferential fracture growth should be expected eastward at deeper depths compared with growth observed in shallower depths, which would be in line with observations from the cross-well strain response.
Preferential Growth Trend
Finally, the source mechanisms from moment tensor inversion on microseismic events observed during B2H’s treatment were investigated, considering the significant variability in proppant distribution across B2H child zone. Our interpretation is that there is preferential growth toward parent BR1H/BR2H in the toe-half of this zone versus the heel-half, where more fractures traveled westward. Identifying events that are double couple versus compensated linear vector dipole (CLVD) can indicate zones where most fractures show shear failure with the former versus areas where we tend to see tensile failure with the latter.
Typically, we expect the microseismicity to be dominated by shear fracturing, as has been observed in many of the field microseismic datasets. However, the toe-end of the well shows a preponderance of CLVD or opening-mode failures.
More opening-mode failure toward the toe of B2H could indicate re-activation of pre-existing fractures during stimulation, which would suggest a relatively higher impact of BR1H/BR2H completions in this section compared with the middle of B2H. Moreover, we would expect more propped fractures with tensile fracturing compared with shear fracturing. The difference in the two sections is relative, with significant tensile mode fracturing likely occurring across the entire lateral, as would be expected in typical fracturing operations. This transition seems to occur around stages 11-13 in B2H.
The HFTS 2 study demonstrates the viability of the new proppant detection and classification methodology. Analysis of the data suggests that the parent wells had a significant impact on the proximal new child well. This includes both BR1H/BR2H to the east and TR7H/TR8H to the west. This translated to observable proppant transport over more than 3,000 feet in the case of the TR7H/TR8H laterals.
A proppant log can help identify locations where significant propped or “mother” fractures exist, which can have an adverse impact in terms of cross-well communication and child well productivity. A proppant log can be a useful tool in assessing well spacing, indicating locations of mother fractures and predicting interwell communication will be the strongest before frac operations begin. The approach also can help explain post-completion well behavior.
Editor’s Note: The authors acknowledge Occidental and Shell for hosting HFTS 2 and providing access to significant background data, Optasense for fiber data collection and quality control, and Borehole Seismic for microseismic data collection and processing. This material is based on work supported by the U.S. Department of Energy under Award Number DE-FE0031577.

DEBOTYAM MAITY is a senior engineer in the energy supply & conversion group at the Gas Technology Institute. He has worked with GTI for the past eight years, and his research interests include data analytics, reservoir characterization, and hydraulic fracturing optimization and diagnostics. Maity has been involved with various DOE-funded research projects, including the HFTS 1 and HFTS 2 demonstration programs in the Permian Basin. He holds three patents in hydraulic fracturing completion techniques and diagnostics. Maity has an M.S. and a Ph.D. in petroleum engineering from University of Southern California.

JORDAN CIEZOBKA is a senior engineer in completion and stimulation research at the Gas Technology Institute, where he helps manage unconventional oil and gas research and demonstration programs, such as HFTS 1 and HFTS 2. Ciezobka joined GTI in 2010 after starting his career as a field engineer with a major oil field service company in Texas. His experience includes hydraulic fracturing design and execution in multiple unconventional formations, including tight sands and shales. He is also experienced in cement design and execution. Ciezobka holds a B.S. in mechanical engineering from Purdue University.
For other great articles about exploration, drilling, completions and production, subscribe to The American Oil & Gas Reporter and bookmark www.aogr.com.