


Part 2
Field Test Validates Completion Design Part 2
By Jessica Barhaug, Victoria Martinez King, Andrew Schmidt, Angie Southcott, Lee Steinke and Harold Harper
Editor’s Note: The following article is the second in a two-part series on optimizing completion design in the Bakken/Three Forks play. Part I focused on data analysis and completion design, and was featured in the December issue of AOGR.
DENVER–To optimize the completion effectiveness in Bakken/Three Forks horizontal wells in the Williston Basin, WPX Energy conducted a two-phase project to gather and analyze data, integrate the results in a calibrated fracture model, and then develop and field test a recommended optimized design.
The recommended design was a cemented plug-and-perf completion in a 9,500-foot lateral with 25 stages spaced at 380 feet, 73 entry points, 425 pounds per foot of mostly ceramic proppant, and a pump rate of 30 barrels a minute. That compared to the previous design of 16 stages spaced at 594 feet, 31 entry points, 347 pounds/foot of mostly ceramic proppant, and a pump rate of 45 bbl/minute.
The project defined completion optimization as improving well performance and fracture behavior while also increasing internal rate of return. Consequently, the economic impact of the new design had to be measured to ensure that improvements in target metrics were not in conflict with improved profitability. This was an especially important consideration, given that the completion capital required for the preferred design was greater than for the standard design being used at the time. The economic analysis confirmed that the preferred design could be considered “optimized” because of an increased internal rate of return.
Economics were run to compare completion designs that had been used by the company within a two-year period. Swell packers utilizing plug-and-perf, swell packers and sleeves, and cemented liners utilizing plug-and-perf methods were compared. Risked completion costs were used in the economics to account for consistent failures and issues that were encountered for the respective completion method.
TABLE 1
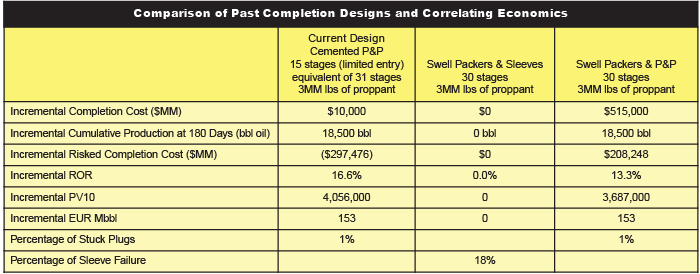
Table 1 shows that the then-current design method was outperforming swell packers and sleeves significantly, but the important difference to notice is that the current design was expected to require $500,000 less in capital investment (when risk was taken into account) compared with swell packers using the plug-and-perf method.
Economic analysis was run for the current and recommended completion designs to analyze associated costs and expected performance. Expected performance was estimated by using the multivariate tool to forecast cumulative production after 180 days using five key completion variables: lateral length, proppant volume, stage length, treatment rate, and proppant type. Entry point type, perforation scheme, and fluid type were not accounted for in the economic comparison because of the limitation of available public data.
Once the 180-day cumulative production was determined, a type curve was hung to review the well economics. Transitioning to the recommended completion design had an 8 percent incremental added cost to optimize the completion design, but generated a predicted 11 percent to the rate of return, 16 percent to the PV10, and 10 percent to the estimated ultimate oil recovery.
Recommended Design
The recommended design took into account risk, expected performance and cost, with the goal of increasing the internal rate of return while managing capital investment. The strength of the recommended design came from having integrated multiple datasets and analyses that supported a component of the completion design, which provided a confidence level for each component as well as the design as a whole.
FIGURE 1
Phase Two Layout
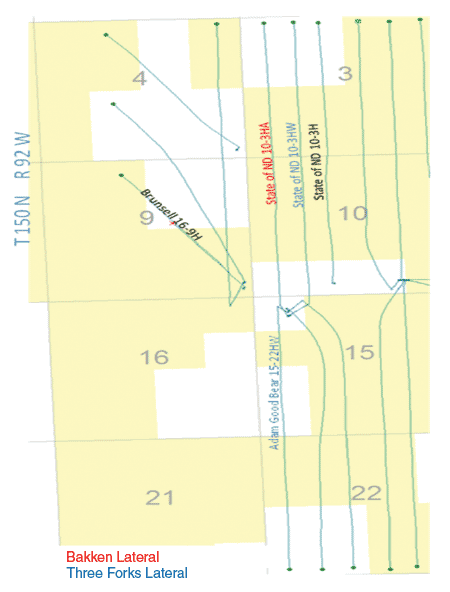
The second phase of the project was implemented to test the effectiveness of the recommended design and verify the predictions of the datasets that were used in the first phase. An offset pad was identified to perform the second phase that had an available wellbore for microseismic monitoring. Two wells were tested with the optimized completion design: the State of North Dakota 10-3HA (Middle Bakken) and the Adam Good Bear 15-22HW (Three Forks).
The fluid system for the two wells was similar to the phase one system. A hybrid design was used with slickwater in the pad and 100-mesh stages, and 20-pound cross-linked guar gel was used for the 20/40-mesh stages. The same 35/65 split of sand/intermediate-strength proppant was used as in the phase one wells, but gel loading was decreased to retain conductivity.
The microseismic program in this phase was two spacing units west of phase one. It utilized two vertical monitor arrays and one horizontal monitor array (Figure 1); 12 stages from the treatment well, State of North Dakota 10-3HA, were monitored. A 30-tool, 14-level stacked array was deployed in the 10-3H, with the depth of the top tool at 8,350 feet measured depth and the bottom tool at 9,350 feet MD.
The same array design was deployed in the Brunsell No. 16-9H, with the top tool at 8,550 feet. An 18-tool unstacked array was deployed in the horizontal section of the No. 10-3 HW and was moved up hole to remain opposite the active treatment stages. The arrays were oriented using perf shots and 610 microseismic events were located. Some stages of the Adam Good Bear 15-22 HW were monitored, but these results are not yet available.
The dominant fracture trend that had been observed in the microseismic data acquired in phase one was not as prominent in phase two data. The dominance of the primary trend varied slightly, and the frac coverage was consistent along the wellbore. In five stages, events can be seen at the 10-3H well; which at the time, had been producing for 2.5 years. The microseismic showed good fracture coverage along the wellbore with adequate stage isolation.
FIGURE 2
Comparison of Height Growth for Phases One and Two (Top = Past Design; Bottom = Current Design;
Grid Cell Size = 250 x 250 feet)
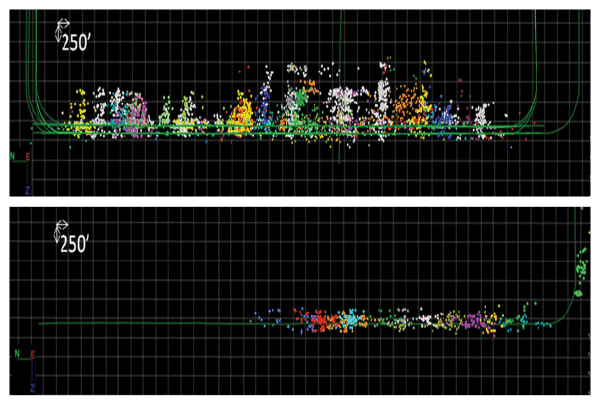
Significant vertical height growth was a common thread among all completion types in phase one. The north-to-south cross sections in Figure 2 show all microseismic events (colored by stage) from phase one (top) and phase two (bottom). In all but one stage in phase two the maximum vertical height growth did not exceed 300 feet. The very shallow events on the south (right) end of the bottom picture are the product of simultaneous operations on an adjacent pad.
Of the 610 located microseismic events in phase two, 42 were related to simultaneous drilling operations on an adjacent pad and 273 (48 percent) of the remaining 568 events were in zone. Height growth out of zone was significantly and systematically reduced.
Hydraulic Fracture Model
Since the entire phase two wells were pumped with the same recommended design, not as many stages needed to be hydraulic-fracture pressure-history matched in order to get a high number of data points (FPHM was used on a little more than half of the stages on both wells). The previous GOHFER® planar 3-D geometry fracture simulator model was able to achieve high confidence matches when shifted to the Adam Good Bear 15-22HW.
On the State of North Dakota 10-3HA, however, the GOHFER model showed a significant mismatch at the beginning-of-job and end-of-job instantaneous shut-in pressure, indicating that the MEM model was not an accurate representation of current stress conditions. The original 10-3H well is 1,400 feet away from the 10-3HA, and a sidetrack exists on the 10-3HA. These both could be affecting the initial stress state. Therefore, only the results from the Adam Good Bear 15-22HW were used. The results from these matches were consistent with what the model was predicting for the recommended design fracture geometry.
Tracer Data
FIGURE 3
Phase One and Two PFLA and Fracture Height Comparisons
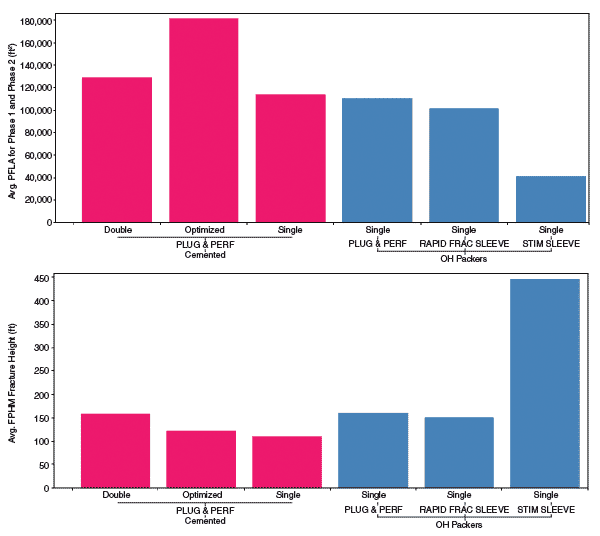
FIGURE 4
Proppant Tracer Layout and Logged Wells
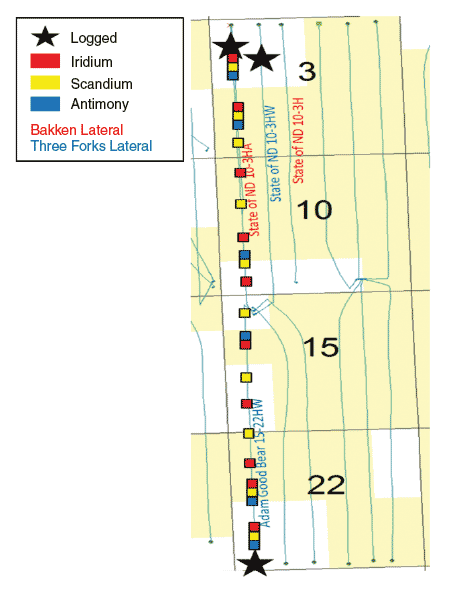
Figure 3 shows how the propped fracture length area (PFLA) and fracture height from phase two compared to the rest of completion/isolation combinations. With the optimized completion design, fractures are being achieved that maximize PFLA while limiting height growth out of zone.
Multiple types of tracers were utilized to observe possible communication between offset wells, to better understand productive communication between the Three Forks and Middle Bakken formations, and to monitor oil flow along the wellbore over time.
Proppant tracers were pumped with proppant in both the State of North Dakota 10-3HA and Adam Good Bear 15-22HW. Figure 4 shows the isotopes pumped and the locations along the wellbore where they were used. The traced wells were logged using a spectral gamma ray tool. The original plan for the project included logging three offset wells, but only one, the State of North Dakota 10-3HW, was successfully logged because of weather complications and economic considerations.
Proppant tracer was not detected within the wellbore or the near-wellbore region of the 10-3HW well. This was in contrast to the considerable amount of proppant tracer detected on direct offsets of the previous fracture treatment design, which used less proppant and fluid volume but fewer entry points and number of stages, compared with the recommended design utilized on the 10-3HA and 15-22HW wells. This was a significant result, as one of the goals of the recommended design was to more effectively control the fracturing treatment energy to prevent overstimulation and maximize treatment within the oil-producing zone.
FIGURE 5
Oil- and Water-Soluble Chemical Tracer Layout (Including Sampled Offset Wells)
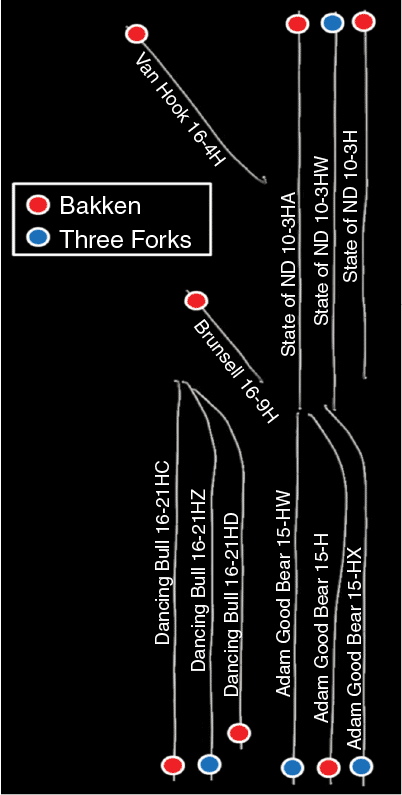
Both oil-soluble and water-soluble chemical tracers were used. On the State of North Dakota 10-3HA, five unique oil-soluble tracers and five unique water-soluble tracers were pumped during the frac treatment. Following treatment, samples of production fluids were taken from the treatment wells and several offset wells (Figure 5).
A noteworthy observation was that oil-soluble tracers pumped during the treatment of the No. 10-3HA were not observed in samples collected from the nearest offset to the east (the State of North Dakota 10-3HW, a Three Forks well). However, oil-soluble tracers were detected in the next nearest offset well to the east (the State of North Dakota 10-3H, a Middle Bakken well). The two offset wells to the west of the 10-3HA (the Brunsell 16-9H and the Van Hook 16-4H) also both had oil-soluble tracers detected in production fluid samples.
These results, combined with the fact that proppant tracer was not detected in the State of North Dakota 10-3HW, suggest that the recommended design pumped on the State of North Dakota 10-3HA may have resulted in preventing downward growth into the Three Forks formation. Also noteworthy was that oil-soluble tracers were detected in both directly offsetting wells to the Adam Good Bear 15-22HW, which are both Middle Bakken, while the Adam Good Bear 15-22HW is a Three Forks well. This is in agreement with microseismic results that show height growth into the Bakken from the Three Forks.
Production Logs
Production logs were used to compare perforation schemes and correlate with proppant tracer data. The production logging tool consisted of mini-spinners, and electrical and optical probes positioned both on a maneuverable arm and the low side of the tool body. The sensors each make a direct, localized measurement of the velocity of the fluid passing through to enable the calculation of a multiphase velocity profile. This facilitates detecting velocity variations in the vertical diameter of the wellbore that otherwise may be missed by a single-spinner logging tool.
The No. 10-3HA was logged 42 days after the fracturing treatment was completed, while the 10-3HW was logged 30 days after treatment. In both cases, the log was run on coiled tubing and did not reach total depth. For both wells, approximately 35 percent of the lateral length was logged.
The 10-3HA utilized three cluster schemes (number of holes listed from the heel side to toe side): 6, 6, 6; 6, 6, 8; and 6, 6, 10, while the 10-3HW utilized the same cluster scheme on every stage (6, 6, 8). Perforation schemes were chosen based on limited-entry principles to more equally divert fluid flow among perforation clusters. The percentage of frac stage oil production per cluster is shown in Table 2 according to each perforation scheme used. Several observations can be made from the data, assuming that equally treated clusters will result in equal production among those same clusters in a frac stage.
TABLE 2
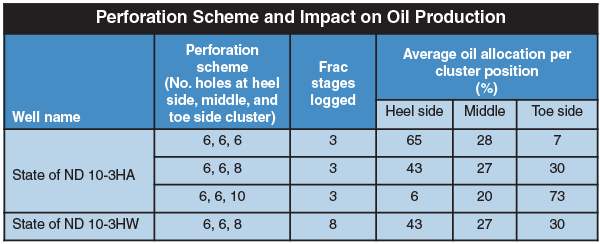
First, in the case of the State of North Dakota 10-3HA where the “6, 6, 6” scheme was used, the highest oil-producing cluster was at the shallowest position, while the lowest oil-producing cluster was at the deepest position. This is anticipated because one would expect a preference of frac fluid injectivity (therefore, production) toward the heel-side cluster when all clusters have the same number of perforations.
Second, in the case of the 10-3HA where the “6, 6, 10” scheme was used, the opposite result was observed, with the majority of detected production at the deepest position where the largest number of holes were used. This suggests that the difference between number of holes at the toe-side position to the heel side and middle positions was larger than optimal. Last, it is interesting that in the case of the “6, 6, 8” perforating scheme, the average oil production at each cluster position was identical for both wells and displayed a more evenly dispersed production distribution.
Spectral gamma ray logs for detecting proppant tracer can be used to surmise whether a specific perforation cluster has been treated. Since both proppant tracer data and production log data were collected on the 10-3HA, data were checked for any possible correlations. Of the three stages that had proppant tracer added to the frac fluid slurry, no correlation could be made with the effectiveness of frac treatment per cluster in a specific stage to the ratio of production among clusters in the same stage. However, a single frac stage on the 10-3HA showed good proppant tracer coverage across all clusters, but only one of these clusters had oil production, according to the production log. This reinforces the idea that conclusions should be made based on multiple datasets.
TABLE 3
Production Validation
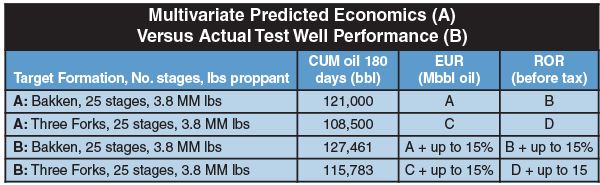
Cumulative 180-day production numbers were compared with the actual 180-day numbers for the two wells in the study. In both cases, the actual production numbers were higher than the model had predicted (Table 3). In fact, the 180-day cumulative production was approximately 30 percent higher for the State of North Dakota 10-3HA and 25 percent higher for the Adam Good Bear 15-22HW. Exceeding expectations was somewhat expected since the model was not able to account for isolation type or number of entry points.
No study of this size and scope is without uncertainty from a variety of sources, and acknowledging these risks is necessary for continued improvement. Some of the sources of uncertainty were geologic assumptions, data acquisition limitations leading to nonunique or inconsistent data, nonstatistical samples, using numbers to describe qualitative interpretations, and differences in target metrics across the study. Integrating independent datasets assisted in mitigating the impacts of some of this uncertainty on study results.
The design components preferred by different datasets or different target metrics were not always in agreement. When the studies agreed, confidence in the results increased, and when they disagreed, a lower level of confidence was acknowledged. Disagreement required that internal experts discuss the relative strengths and weaknesses of the studies for those specific contexts, and to make decisions about which analytical results were more confident or plausible. Internal company expertise in multiple disciplines was necessary to work through data and interpretive differences to provide a quality result with well understood strengths and weaknesses.
In conclusion, the cross-discipline integrated analysis resulted in a modified completion design that gave an as-predicted response in microseismic, tracer and FPHM data, and outperformed the multivariate prediction and the economic goals.
JESSICA BARHAUG is a senior completions engineer at WPX Energy, specializing in hydraulic fracturing design and evaluation, completions, rate transient analysis, and geomechanics. Before joining WPX in 2011, she was a production stimulation engineer with Schlumberger Data & Consulting Services, specializing in tight gas and shale formations. Barhaug holds a B.S. in engineering with an environmental specialty, and an M.S. in petroleum engineering, from the Colorado School of Mines.
VICTORIA MARTINEZ KING is the completions engineering team lead for the Williston Basin at WPX Energy. She joined the company in 2008 as a completions engineer in the Piceance Basin, before being promoted to completions engineer in the Williston. Martinez previously served as a petroleum engineer with Energy Corporation of America in the Appalachian Basin. She holds a B.S. in petroleum engineering from the Colorado School of Mines.
ANDREW SCHMIDT is a senior completions engineer at WPX Energy, designing and optimizing completion processes and methods for Bakken wells. Before joining WPX Energy in 2010, he served for seven years in completion procedures at Schlumberger, including as senior completions engineer, production stimulation engineer, product development engineer, and a hydraulic fracturing field engineer. Schmidt holds a B.S. in chemistry from Bethel University and a Ph.D. in chemistry from the University of Minnesota-Twin Cities.
Angie Southcott is geology team lead and senior geoscientist at WPX Energy in the Williston Basin. Before joining the company in 2011, she was a senior geoscientist at Rosetta Resources, a staff geophysicist at Oxy, and a geophysicist at Resource Solutions. Southcott holds a B.S. in geophysical engineering from the Colorado School of Mines.
LEE STEINKE is geology manager, Williston Basin, for WPX Energy. Before joining the company in 2011, she was at Williams for six years, where she was geology manager for the Powder River Basin and a senior geoscientist in the Piceance Basin. She began her career at Texaco as a geoscientist. Steinke holds a B.A. in geology and classics from the University of North Carolina at Chapel Hill, an M.S. in geology and geophysics from Yale University, and an M.B.A. from The Wharton School at the University of Pennsylvania.
HAROLD "HAL" HARPER has 34 years of experience as a geophysicist and geoscientist working in basins and settings around the world, including the Norwegian Sea, North Africa, Gulf Coast, Permian Basin, Mid-Continent, and all Rocky Mountain basins. He has worked at Professional Geophysics Inc., Conoco, Tom Brown Inc., Encana, Pioneer Natural Resources, Williams and WPX Energy. Harper holds a B.S. in geophysical engineering from the Colorado School of Mines.
For other great articles about exploration, drilling, completions and production, subscribe to The American Oil & Gas Reporter and bookmark www.aogr.com.