


Frac Diagnostics Key In Marcellus Wells
By James O. Barth, Kevin M. Ryan, Michael J. Mayerhofer and Neil A. Stegent
HOUSTON–Seneca Resources completed a group of Marcellus Shale horizontal wells in sequential order with preplanned fracture and reservoir diagnostics to better understand completion and stimulation efficiency, as well as drainage patterns, given a certain well spacing. Insights were gained by integrating microseismic fracture mapping, diagnostic fracture injection tests, downhole pressure gauges, post-frac pressure transient analysis, nontoxic chemical tracer and production data.
FIGURE 1
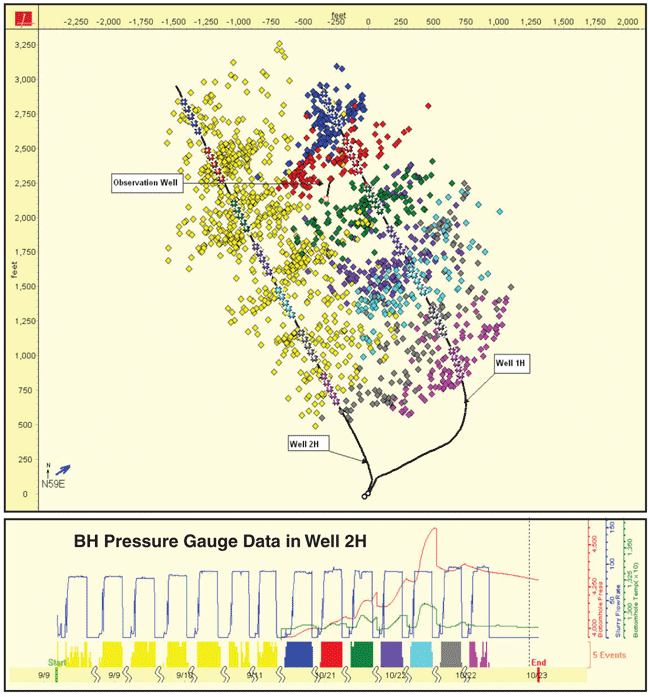
Well Pad Layout with
Well Nos. 1H and 2H, and
Microseismic Monitoring Well
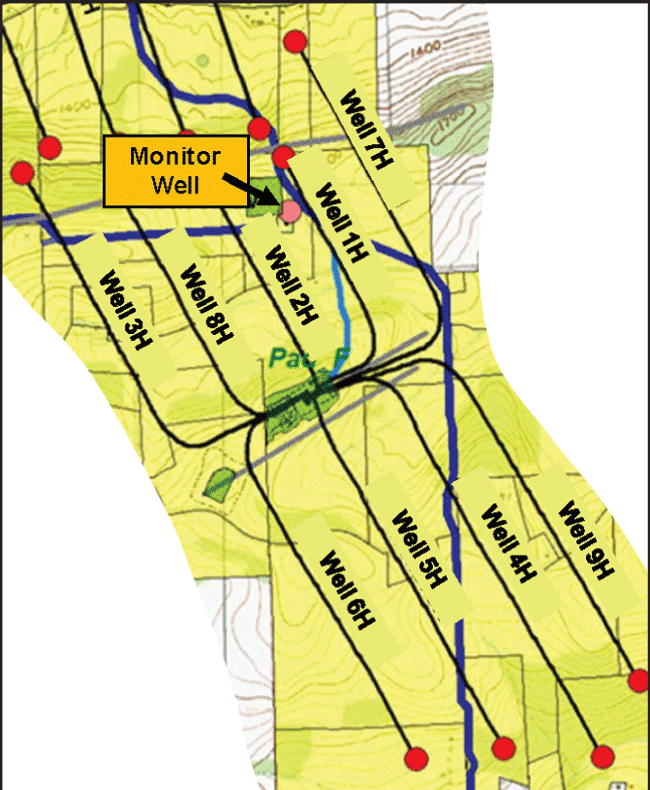
Microseismic fracture mapping was performed during the completion of two offset horizontal wells (Nos. 1H and 2H) in Tioga County, Pa. Because the two wells were completed sequentially, it was possible to deploy downhole pressure gauges in one well while the offset well was completed. This procedure provided the unique opportunity to monitor potential communication between the two wells and correlate the results with the overlap of microseismic activity. The pressure gauge also was used to monitor the initial post-frac buildup in that well. A second buildup test was conducted after five months of production.
Integrating various engineering data leads to interesting conclusions with respect to effective fracture length, correlating microseismic events with actual hydraulic fracture communication, and production interference. These insights provide important information for optimizing infill drilling, well placement and fracture completion strategies in the Marcellus Shale play.
The two wells were drilled transverse, or perpendicular to the expected fracture azimuth, to the Marcellus Shale formation and completed as cemented laterals. Both laterals were drilled in the Union Springs member of the Marcellus, approximately 950 feet apart. Well 1H is located northeast of Well 2H, and is positioned slightly higher in the Marcellus (Figure 1). The perforation strategy on 2H covered 2,500 feet of lateral, compared with 2,300 feet for 1H.
The wells were stimulated with seven hydraulic fracture treatment stages, each using plug-and-perf completions. In addition to determining the fracture pay zone coverage (height, length and azimuth), induced fracture complexity, and stimulated reservoir volume, the primary objective was to integrate various fracture diagnostic technologies to optimize future well placement and infill drilling strategies.
TABLE 1
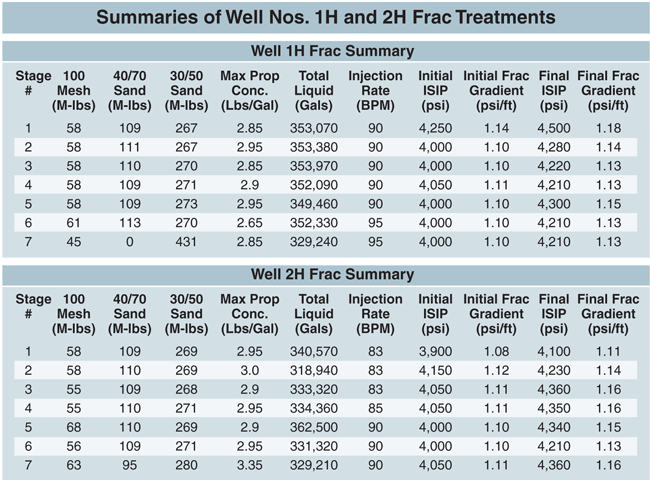
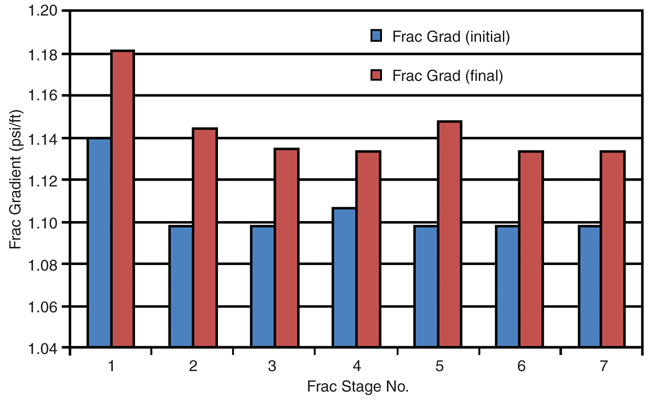
FIGURE 2
Calculated Frac Gradients for Well 1H Fracture Stimulation
Fracture Treatments
Both wells were fracture stimulated with seven-stage fracture completions at pump rates of 80-95 barrels a minute. Each frac stage consisted of pumping 350,000 gallons (8,350 barrels) of a slick-water fluid system, with 56,000 pounds of 100-mesh sand, 110,000 pounds of 40/70-mesh Jordan sand, and 270,000 pounds of 30/50-mesh Jordan sand. During stage seven of Well No. 1H, the 40/70-mesh Jordan sand was eliminated and 430,000 pounds of 30/50-mesh Jordan sand were pumped.
There were five, two-foot-long perforation clusters per stage with 60 shots across approximately 200 feet of the lateral well bore. Tubing-conveyed perforating was used on the first stage of each well, and plug-and-perf was utilized to complete the remaining frac stages.
Well 2H was fracture stimulated first, flowed back and cleaned up, and then placed on production. After flowing Well 2H for seven days, bottom-hole gauges were installed and the well was shut in for a pressure buildup test. Well 1H was fracture stimulated five weeks after the Well 2H completion. Both wells were mapped using downhole microseismic mapping. Table 1 shows a summary of the stimulation treatments and Figure 2 shows a plot of initial and final frac gradients (instantaneous shut-in pressures) in Well 1H.
The treating pressure data for each stage along the 1H well bore indicate no fracturing pressure increase from toe to heel, indicating that stress buildup from previous stages is not a factor. There also are no meaningful frac gradient differences between the two wells. There were no mechanical failures encountered during the completion of Well 1H. Figures 3A and 3B show a plot of the seven-stage fracture treatment, as well as the increased bottom-hole pressure in offset Well 2H while fracturing stages one through six in the 1H well.
FIGURE 3A
Well 1H Seven-Stage Fracture Completion
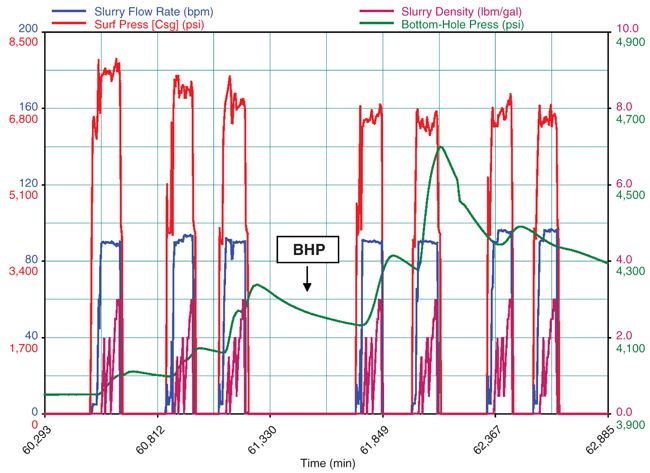
FIGURE 3B
Increased BHP in Well 2H while Fracturing Well 1H
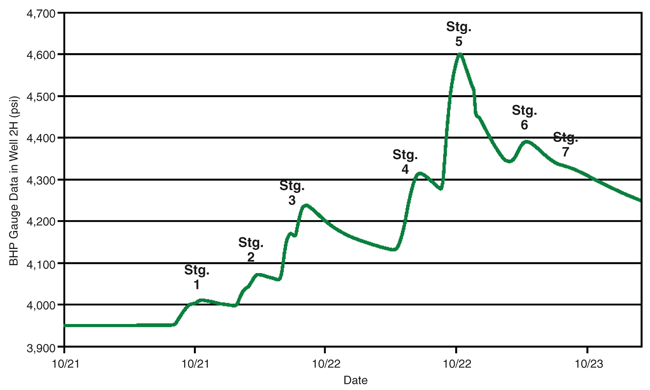
A more detailed plot of stage five of Well 1H shows BHP increasing as a result of communication with Well 2H. After stage five, because of increasing pressures, the surface pressure was blown down for about 15 minutes between stages. Pressure communication between the wells was observed in six of the seven stages pumped. No distinctive pressure anomalies were observed in the Well 1H treatment data, which could be indicative of communication with the fracture network from previously stimulated 2H. Only by using a bottom-hole gauge in the offset shut-in Well 2H was it possible to verify interwell communication, and fracturing pressure data in the treatment well alone were insufficient to diagnose communication between wells.
Microseismic Mapping
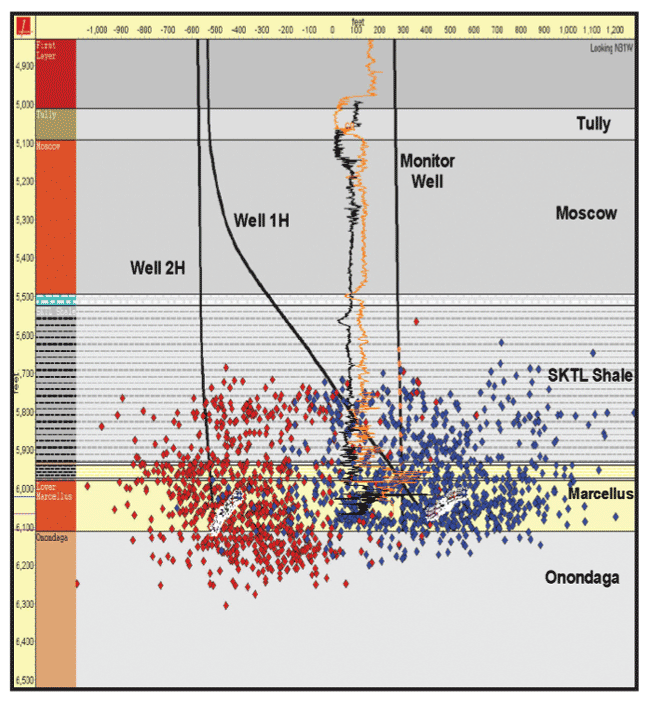
Microseismic results for all stages of both wells (2H in red and 1H in blue) are shown in Figures 4A-4C. The primary fracture azimuth is approximately north 45 degrees east to north 55 degrees east. Fracture network heights ranged from 250 to 480 feet, with vertical growth imaged in the overlying Skaneateles Shale group and minimal downward growth detected in the underlying Onondaga group. Fracture growth into the Skaneateles group above the laterals was very similar for both wells, although more downward growth into the Onondaga was observed while completing Well 2H. During the seventh stage, vertical growth into the overlying Stafford and Skaneateles groups was not observed, which may be related partly to observational distance.
FIGURE 4A
Map View of
Microseismic Mapping Results
(Blue = 1H; Red = 2H)
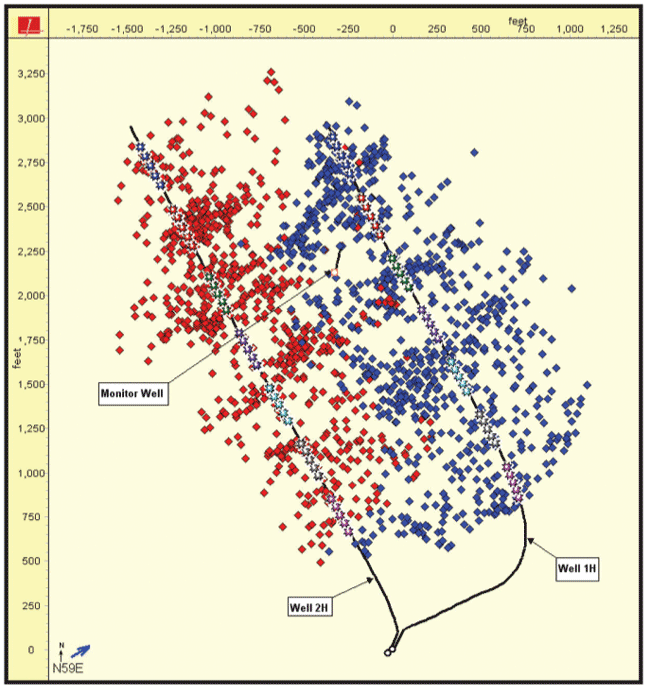
FIGURE 4B
Lateral Side View of Microseismic Mapping Results
(Blue = 1H; Red = 2H)
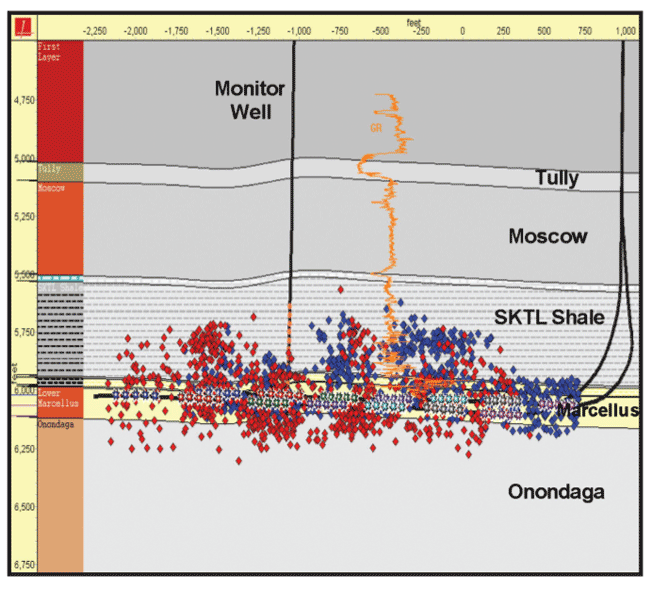
FIGURE 4C
Lateral End-On View of
Microseismic Mapping Results (Blue = 1H; Red = 2H)
Fracture half-lengths ranged from 620 to 1,125 feet for 1H, with maximum fracture extension achieved during stage six. Fracture half-lengths were slightly shorter in 2H, ranging from 700 to 875 feet, with the majority of the microseismic activity imaged to the east-northeast of the lateral. The pre-existing network in Well 2H likely affected the network generation in 1H, as substantiated by the pressure communication data. The fracture half-lengths in Well 1H were primarily symmetrical relative to the lateral, with the majority of microseismic data observed on the east side of the lateral.
Fracture network widths ranged from 510 to 920 feet in 1H, nearly three to four times larger than the perforation intervals, indicating complex fracture systems may have been generated in these wells. The fracture network widths in 2H were smaller (370-620 feet). It appears some of the perforation clusters in this well received minimal stimulation fluid, particularly during stages four and five.
For the most part, the perforation intervals in Well 1H were stimulated, with the exception of stage four, which migrated up the well bore toward the planned stage five perforations. It should be noted that the perforation intervals in 2H were approximately 60 feet longer than in 1H during stages three through seven.
Bottom-Hole Pressure Data
The bottom-hole pressure gauges were positioned in the curve of the 2H well bore just above the horizontal section to record the pressure buildup in 2H and subsequently monitor the pressure response during the completion of Well 1H to determine if the fracture networks were communicating hydraulically. Data from the pressure gauges clearly indicate communication on six of seven stages.
This communication was confirmed by the bottom-hole pressure increase in Well 2H during Well 1H fracturing treatment, as shown in Figure 5, which integrates the BHP pressure response chart with the microseismic plot. The microseismic activity (shown in yellow) correlates the timing of microseismic event overlap between the two wells with the BHP response in 2H. The color-coded circles, which are the same color as the individual stages in Well 1H (stage one denoted in blue, stage two in red, stage three in green, stage four in purple, stage five in light blue, stage six in grey, and stage seven in pink), represent the area of microseismic data detected when BHP increased in 2H. The dotted arrows show the direction of microseismic events during communication.
The pressure communication coincided with an overlap of microseismic activity, indicating that the events are very close to the actual hydraulic fractures providing the pressure communication. The first and second stages communicated roughly through the same area, approximately midway between the laterals and between the respective perforated intervals. Stage three communicated across from its perforations and also midway between the laterals. Stage four also communicated across from its perforated interval, but the events appeared to emanate from the heel-side of the interval and grow “backward toward the toe” when communication was established. Stage five communicated across from its interval and overlapped with events from stage four.
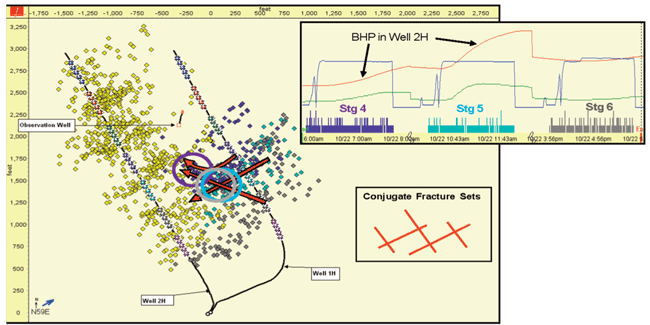
Figure 6 shows a composite plot of stages four through six, illustrating the correlation between microseismic activity and pressure communication. The red arrows, which show the preferential direction of communication between fracture networks, indicate that stages four to six are potentially communicating through conjugate fracture sets (normal and parallel to the laterals), as illustrated by the red arrow originating from the stage six perforations and pointing backward to the previous stages.
FIGURE 5
BHP Response in Well 2H and Microseismic Data while Treating Well 1H
The gray circle identifies the detection of stage six events in the area of stages four and five at the time of pressure communication. The largest pressure response was observed during stage five. This is likely because of the interaction with the pre-established network in stage four and repeated communication. The pressure response was smaller during stage six, which may indicate a larger pressure drop, since the perforated interval is located farther away from the point of communication. There was no pressure increase observed during stage seven, as confirmed by microseismic data.
These results appear to indicate the presence of natural fracturing with conjugate azimuths, particularly in the mid-lateral section. The initial frac stages had minor indication of pressure communication with Well 2H, but this continued to intensify as the intervals in the middle of Well 1H were completed. The data indicate consistently increasing pressure communication from stages one through five during the stimulation of 1H, with an 318-psi incremental increase during stage five, followed by a smaller increase in stage six and no increase in stage seven. The total pressure increase for all stages is 800 psi. However, the surface pressure was “blown down” between stages five and six.
Nontoxic chemical tracers were used on all seven stages of Well 1H. Each frac stage was treated with a different chemical tracer. No tracers were used in the 2H treatment. Nontoxic chemical tracers from stages two, three, six and seven in 1H were found in 2H’s produced water. In addition, 2H-produced water chlorides dropped from 86,000 to 44,5000 parts per million, indicating a mixture with frac water. The chloride concentration returned to near previous concentrations in five days. The tracer communication into the 2H and the dilution of chlorides in the produced fluid of 2H provide independent confirmation of communication.
FIGURE 6
Composite Plot of Frac Stages Four, Five and Six
SRV And Pressure Diagnostics
The total stimulated reservoir volume (SRV) was calculated using an algorithm to estimate the volume of the 3-D fracture network structure, and was estimated at 311 (106) cubic feet for Well 1H and 354 (106) cubic feet for Well 2H. Only the thickness of the Marcellus Shale group was considered “SRV pay” for this calculation. To determine network overlap between the two wells, the total combined SRV for both wells was calculated within the Marcellus at 663 (106) cubic feet. From an SRV perspective, there is no significant overlap of the fracture networks created in each well at 1,000-foot spacing. However, this may be misleading since communication was clearly established, most likely through dominant, higher-conductivity hydraulic fractures.
The SRVs calculated for the two treatment wells are small in comparison with wells in the Barnett Shale, where SRVs typically range from 1,000 to 3,000 (106) cubic feet. Therefore, production results in these two Marcellus wells indicate substantially better shale flow capacity compared with a Barnett well that requires more SRV to achieve commercial production.
A diagnostic fracture injection test was performed prior to stimulating stage one in Well 1H to estimate fracture closure pressure, pore pressure and permeability. Closure pressure (minimum horizontal stress Shmin) was estimated at 5,362 psi (0.89 psi/foot) and reservoir pressure was estimated at 3,929 psi (0.65 psi/foot). Reservoir permeability was approximated at 0.0007 milliDarcy (700 nanoDarcies). The falloff indicates pressure dependent leak off (PDL), which implies that the permeability estimate is an upper limit.
The G-function analysis used to estimate fracture closure pressure indicated that fracturing net pressures could easily overcome the deviatoric stress to promote opening conjugate fracture sets, as potentially indicated by the well communication and microseismic data (fracture network widths larger than perforated intervals).
Production Data
Although well communication during pumping operations is not uncommon in naturally fractured shales, it is important to evaluate whether these hydraulic connections remain open under drawdown and production conditions. Figure 7 shows the first eight months of gas flow rates and flowing tubing pressures for both wells. In March 2010, Well 2H was shut in for a pressure buildup test. The production in 1H responded with a progressively increasing change of flow rate by approximately 500 Mcf/d (approximately 20 percent of the total rate in 2H prior to the buildup), indicating clear production communication between the two wells.
FIGURE 7
Gas Production Rates and Flowing Tubing Pressures
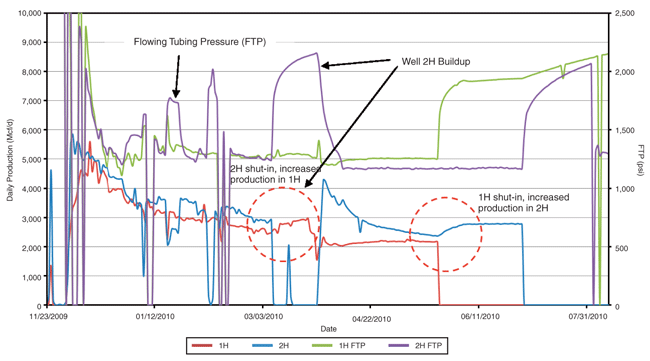
When 2H was returned to production, the gas rate from 1H dropped about 1,000 Mcf/d, followed by a slow increase that appeared to converge with the rate in 2H at constant flowing tubing pressures. In May 2010, 1H was shut in, resulting in a rate increase of 400 Mcf/d in 2H, indicating that communication is mutual. Cumulative gas production of the two wells was essentially equal after the first year.
The production data clearly show communication between the two wells, which demonstrates that effective fracture half-lengths are at least 500 feet from each well across some portions of the interwell area, corresponding with the created half-lengths measured with microseismic mapping.
Pressure Buildup Analysis
Two post-frac pressure buildup tests were performed in Well 2H, the first shortly after the fracture completion was cleaned up and a stable initial gas flow rate was established with a shut-in time of 26 days. The second pressure buildup test was conducted after the well had produced for five months with a shut-in time of 22 days. Figures 8A and 8B show the log-log diagnostic plots of the pressure buildup, as well as the well test model match and actual data. The buildup interpretations are ambiguous, raising questions about the interpretation when multiple stages in horizontal wells are commingled.
FIGURE 8A
First Post-Frac Buildup Test (Final Interpretation)
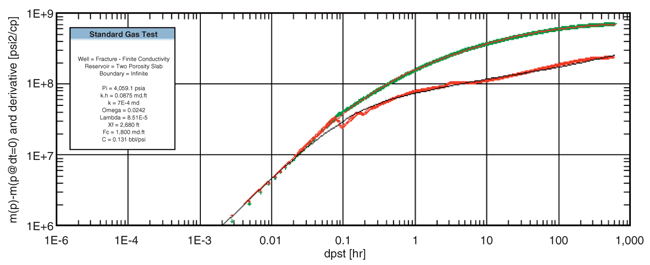
FIGURE 8B
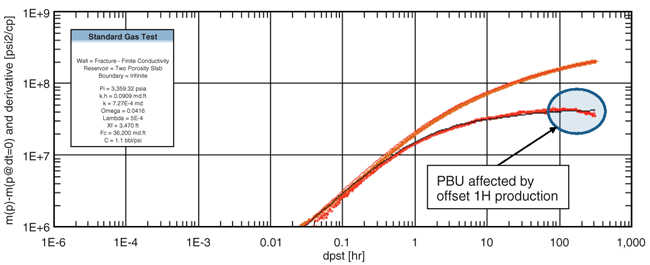
Second Post-Frac Buildup Test after Five Months of Production
The first buildup test after the initial cleanup shows a potentially finite conductivity fracture system. The standard interpretation indicated a 72-foot total effective fracture half-length for all seven stages combined with a high reservoir permeability of 0.09 mD and a low fracture conductivity of 17 mD-foot. This interpretation is not consistent with well communication data, reservoir permeability data, and the fracture lengths that should be achieved with seven stages of 8,000-barrel frac treatments.
Consequently, an alternative solution was developed using a dual-porosity slab model and honoring the DFIT permeability of 700 nD (Figure 8A). The resulting total effective fracture half-length is 2,680 feet for all seven stages (383 feet average per stage, assuming one equivalent fracture), which is more plausible, considering the well communication and microseismic data. However, the fracture conductivity yields a very high value of 1,800 mD-foot, which may not be realistic. Using lower conductivity numbers would have resulted in a significant deterioration of the buildup match. Reservoir pressures are realistic at slightly above 4,000 psi, which is consistent with the DFIT and other pressure estimates. This analysis indicates that natural fractures may play a significant role in this area.
Figure 8B shows the log-log diagnostic plot and analysis match for the second post-frac buildup test in Well 2H, conducted five months later. The buildup derivative appears to show a quick transition to pseudo-radial flow, but this effect could be caused by communication with 1H, which was flowing during test. Well communication was clearly seen in the increased flow rates of 1H while 2H was shut in. The results indicate an improved fracture half-length of 3,470 feet (496 feet average per stage), which may be the result of additional cleanup. Again, the very high fracture conductivity is most likely not a reliable number from this analysis.
In conclusion, it appears that the buildup analyses do not provide a clear interpretation of stimulation effectiveness and reservoir quality. Without additional diagnostic data, ambiguous interpretations and wrong conclusions could be made, such as the interpretation of extremely short fracture half-lengths with unrealistically high reservoir permeability.
Communication between wells is common in naturally fractured shales while pumping hydraulic fracture treatments, but in this case, the production data clearly show communication between the 1H and 2H wells under drawdown conditions. This demonstrates that effective fracture half-lengths have to be at least 500 feet from each well across some portions of the interwell area, roughly corresponding with the created half-lengths measured with microseismic mapping.
However, it is not clear whether these connections are only a few high-conductivity fractures (“pipelines”) that cross the two wells but do not sufficiently cover the interwell area to maximize gas recovery factors, or if there are multiple smaller connections and fractures that will eventually recover most of the gas between the two wells.
Reservoir simulation would be an avenue to explore these possible scenarios and predict ultimate gas recovery factors based on history matching actual production and forecasting well performance. This modeling then can be used to evaluate optimum well spacing. At this point, the roughly 1,000-foot well spacing may appear too close, since communication is pronounced and indicates substantially conductive fractures between the two wells.
As this project underscores, upfront science and integrating different types of diagnostic data are critical for shortening the learning curve in shale play development and optimization.
Editor’s Note: The views and opinions expressed in the article are strictly and solely those of the authors. They are not official statements of National Fuel Gas Company or any of its affiliates or subsidiaries, and no attempt should be made to attribute or otherwise relate these views to National Fuel Gas Company or any of its affiliates or subsidiaries.
JAMES O. BARTH is senior completions adviser at Seneca Resources Corporation and is actively involved with Seneca Resources’ California and Pennsylvania fracturing programs. Barth joined Seneca Resources in 2007 after working as completions, reservoir, production and facility engineer for Chevron U.S.A. Inc. and Cities Service Gas Company. He has completed numerous vertical wells in eight states, and horizontal wells in the Marcellus Shale in Pennsylvania and the Tulare and McClure shale formations in California, and is designing Seneca Resource’s first Utica Shale horizontal completion in Pennsylvania. Barth holds a B.S. in petroleum engineering from Missouri University of Science & Technology and an M.S. in environmental engineering from the Colorado School of Mines.
KEVIN M. RYAN was named vice president, reservoir engineering, at Seneca Resources Corporation in 2010, and oversees the company’s reserves, reservoir engineering, acquisition and divestiture analysis, corporate budget, and economics. He joined Seneca Resources in 1998 as a senior engineer and was promoted to reservoir manager in 2004. Prior to joining Seneca Resources, Ryan was employed by Berry Petroleum Company and Chevron U.S.A. Inc. in drilling, production and reservoir engineering roles. He holds a B.S. in petroleum engineering from the University of Texas at Austin.
MICHAEL J. MAYERHOFER is director of the Fracturing Center of Excellence at Pinnacle, a Halliburton service, in Houston. He leads a team of engineers providing advanced fracture engineering solutions with special emphasis on unconventional shale and tight gas plays. His responsibilities include applying tiltmeter and microseismic hydraulic fracture mapping results for optimizing fracture completion, well placement and infill drilling strategies, designing and evaluating hydraulic fracturing treatments, reservoir engineering, and integrated field studies. Mayerhofer’s 20-year involvement in hydraulic fracturing and reservoir engineering includes fundamental research and field applications in various global producing areas. Prior to joining Pinnacle in 1997, he worked for Union Pacific Resources. Mayerhofer holds a Ph.D. in petroleum engineering from Mining University Leoben in Austria.
NEIL A. STEGENT is a technology manager for Pinnacle, a Halliburton service, in Houston. He has worked in various roles at Halliburton for 30 years, including engineering, sales, management and marketing. Stegent has a vast amount of field experience involving implementing theory into practice in basins across North America and globally. With expertise in fracture evaluation, diagnostics and completion optimization, he has been working with the Pinnacle group for the past couple years in integrating frac mapping technologies with real-time onsite fracture decision making and frac design alteration. Stegent holds a degree in agricultural engineering from Texas A&M University.
For other great articles about exploration, drilling, completions and production, subscribe to The American Oil & Gas Reporter and bookmark www.aogr.com.