


Study Evaluates Proppant Distribution in HFTS Wolfcamp Wells
By Sara J. Elliott and Julia F.W. Gale
AUSTIN, TX.–Investigating proppant distribution in hydraulic fracture treatments is important for understanding the propped fracture network, and in turn, the flow behavior during flowback and production. Near-wellbore proppant detection is a common practice, but understanding proppant location farther away from the well also is necessary to optimize well spacing, completion design and production.
As part of the Hydraulic Fracturing Test Site (HFTS) project in the Midland Basin, a high-angle slant core was drilled through hydraulically fractured Upper and Middle Wolfcamp shale sections to examine fracture face characteristics and physically recover and quantify injected proppant from parted fracture breaks. The slant core well was drilled at an 82-degree inclination between two adjacent producing wells within a development spacing configuration in the Upper and Middle Wolfcamp formations.
This study was one of the first attempts to recover and quantify injected proppant within a stimulated reservoir, and the results are significant in terms of understanding propped fracture networks and predicting future proppant distribution during hydraulic fracturing.
The HFTS includes more than 400 frac stages in 11 long-lateral horizontal wells drilled in the Upper and Middle Wolfcamp formations, as well as two recompleted legacy wells, at a Laredo Petroleum-operated location in Reagan County, Tx. The principal objectives of HFTS include researching methods to improve the hydraulic fracturing efficiency of horizontal shale wells, minimize potential environmental impacts, and demonstrate safe and reliable frac operations.
To improve understanding of hydraulic fracture growth and patterns, proppant distribution from the collected cores was analyzed to address basic questions regarding proppant behavior in the subsurface. This included determining if variations existed along the length of the examined core, finding out whether the majority of proppant grains remained whole or tended to get crushed during pressure pumping, and seeing if proppant would be found mainly within hydraulically-induced fractures or reactivated natural fractures, or transported into core drilling-induced fractures during the core recovery process.
Sample Analysis
To answer these questions, all material was collected from every open fracture (407 samples total) within ~600 feet of core. Samples consisted of drilling mud, aluminum shavings from the core barrel, shale and lithic fragments, calcite, and proppant pumped while fracturing adjacent wells. Samples were washed, sieved into four grain size fractions, weighed and imaged for quantitative analysis. Retrieved samples were labeled with respect to a master fracture database, where fractures were identified in the core and on CT scans of each three-foot interval, allowing them to be coded as either hydraulic, natural reactivated or coring-related fractures (the fracture description methodology was detailed by the authors in URTeC paper 2902624).
From this coding, the amount of proppant within each fracture was quantified, and the distribution of grains among the different fracture types was analyzed. In addition to quantifying the total amount of proppant present in each fracture, both plain sand (95 percent of the treatment volume) and colored resin-coated sand (5 percent of the treatment volume) had been pumped during treatment in an attempt to diagnose the pumping stage linked to specific fractures by tracing the colored grains.
Proppant packs of 0.5-1.0 centimeter thick were found in two locations with complex fracture geometry, but fracture faces showed no evidence of proppant embedment. In situ sand patches were found on a few fracture faces, mostly in fractures near the proppant packs. Pumped proppant was 100- and 40/70-mesh or 149-420 micrometers (µm), and even though widespread grain crushing was not observed, the majority of recovered proppant ranged from 63 to 250 µm.
The distribution of retrieved proppant, especially larger sizes of more than 250 µm, mirrors the proximity of the slant core to the hydraulic fracture treatment wells. Hydraulic fracture samples contained variable amounts of proppant, and natural reactivated fractures sometimes contained more proppant than nearby hydraulic fractures, suggesting subsurface transference between fracture types. Regarding colored proppant, some colored sands occurred in discreet fractures, whereas other colors appeared to be mixed and widespread.
High-Resolution Imaging
After a vigorous washing and cleaning process to remove drilling mud, proppant samples were wet-sieved into four size fractions: larger than 500 µm, 250-500 µm, 120-250 µm, and 63-120 µm, with all material below 63 µm removed. After separating by size, a pipette was used to remove excess water, clumps of paper fibers and floating aluminum shavings. The samples were then air dried, with the four size fractions of each dried sample weighed on a high-precision balance scale.
All material then was imaged in monolayers on a black background using a mounted digital single-lens reflex camera with a macro lens to capture small particles at full resolution. This step resulted in up to 59 per size fraction per sample (omitting the proppant packs, which contained very little material other than sand and were not imaged). The digital camera settings were such that darker material such as shale fragments blended into the background, while the lighter sand, calcite and aluminum appeared bright.
Image analysis was performed using an open-source platform to determine both total material present and abundance of proppant in each size fraction within each fracture sample. Images first were prepared in two different ways using commercial photo editing software. The first preparation was for total particle counts, where black and mid-tone levels were brightened until all particles were visible. The second preparation was for proppant counts only. The white level was brightened until proppant stood out and the black level was darkened until most other material nearly disappeared into the background. This process made image “thresholding” easier and more accurate.
Figure 1 shows the image analysis protocol for proppant counts using an example portion of an image of the 250-500 µm size fraction. At top left (A) is the prepped sample image containing proppant, aluminum and some shale still visible. The image analysis protocol consisted of:
FIGURE 1
Image Analysis Protocol Using 250–500 µm Size Fraction Example
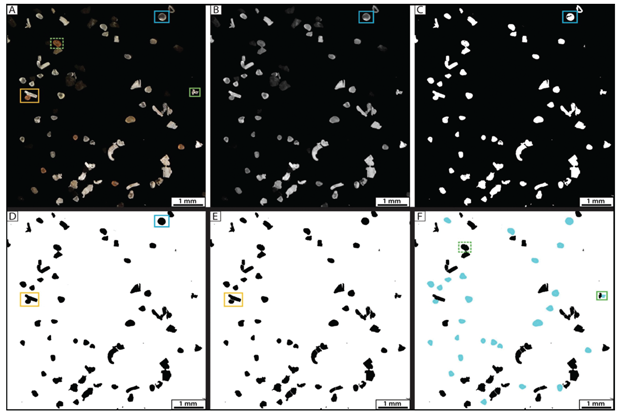
- Changing each image to eight-bit and applying a median smoothing filter dependent on edge pixel size, as shown in panel B in Figure 1 (1 pixel for 63-120 µm and 120-250 µm, 2 pixels for 250-500 µm, and 3 pixels for >500 µm);
- Conservatively thresholding the image to only capture bright particles and ignore shale (panel C) and then inverting the lookup table (LUT) so particles were black on a white background;
- Applying the “fill holes” action because proppant tended to have a darker interior and brighter perimeter (D);
- Applying a watershed algorithm to separate borders of touching particles (E); and
- Setting “analyze particle” parameters to only count particles of a certain size (pixel2, depending on the size fraction) and circularity (0.83-0.90, also depending on the sizes being analyzed) to exclude angular calcite and elongated aluminum, and then applying a count mask to the image to get a minimum proppant count (F).
The blue boxes in the A-D panels are examples of proppant with a darker interior and bright perimeter needing infill after thresholding. The orange box in D shows proppant touching aluminum, which then was separated with the watershed algorithm. The green boxes show automation error, which counted a piece of aluminum (solid box) and excluded a red proppant (dashed box).
For total particle counts, the protocol was the same, except the images were thresholded to include all visible particles rather than only bright objects. To estimate error, proppant grains were counted manually and compared with the automated analysis. The error margin was negligible for larger (250-500 µm and >500 µm) fraction sizes and ~5 percent for the two smaller size fractions, resulting in a minimum estimate of proppant abundance by automated counting.
Proppant Packs
While collecting samples from the core, the occurrence of any in situ sand patches, colored grains and thick proppant packs was noted. While no evidence of embedment (dimpling) was evident on fracture faces, panel A in Figure 2 shows one of the proppant packs found in two locations with complex fracture geometry containing various arrest features. In this case, the pack measured 1.0 centimeters thick.
FIGURE 2
In Situ Sand within Core (Uphole View) And Base Sand Before Sample Collection
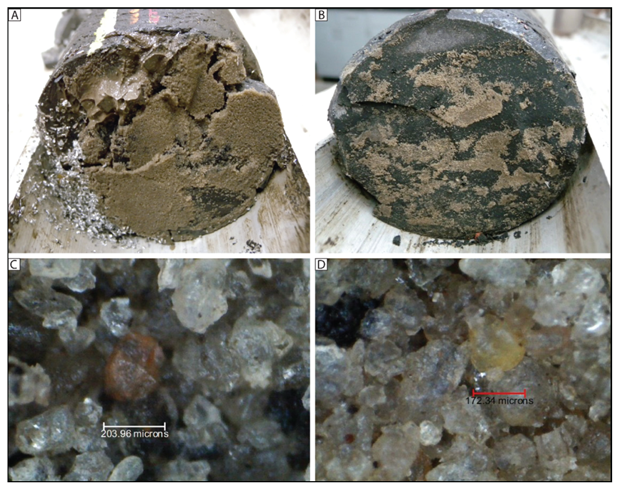
Nearby the proppant packs, a few other fractures contained undisturbed thinner sand patches on the fracture face (panel B in Figure 2). The lack of drilling mud in these fractures reinforced the interpretation that the sand was in place in the subsurface prior to core drilling. The majority of retrieved sand from the proppant packs/patches found in the Upper Wolfcamp cores matched the pumped 100-mesh proppant. Panels C and D show base sand along with potential red and yellow proppant measured in situ before sample collection.
A large proppant pack also was encountered between cores five and six in the Middle Wolfcamp, which jammed the core drilling rig (5 percent sand was observed in mud logger samples from this area). The proppant pack was interpreted to have been in a fracture similar to those containing packs in the Upper Wolfcamp, but it was not preserved because of five feet of missing core between cores five and six, where it would have been located.
The 100- and 40/70-mesh proppant pumped during treatment had a grain size of 149 to 420 µm, yet the majority of recovered proppant was in the two smallest size fractions, especially the 63-120 µm range. Originally, it was hypothesized that the size discrepancy between pumped and recovered proppant could be related to widespread grain crushing of the larger sand within the subsurface, but inspection of recovered proppant indicates that this was not necessarily the case.
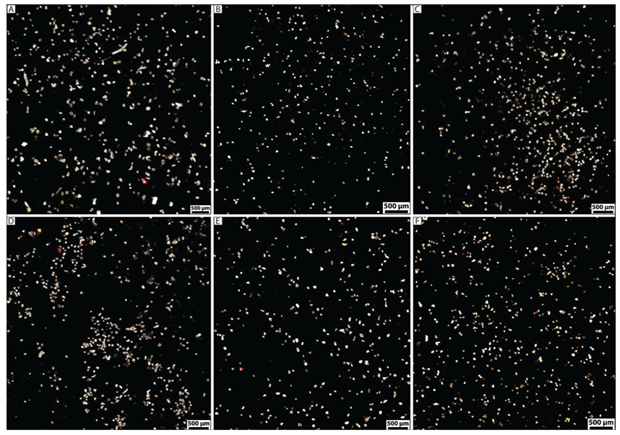
Figure 3 shows randomly chosen examples of retrieved 63-120 µm proppant across all six cores, demonstrating minimal grain crushing in both Upper (panels A-D) and Middle (E and F) Wolfcamp fracture face samples. Some grain crushing can be observed, but the majority of proppant recovered is rounded. Therefore, most of the recovered proppant is seemingly 100-mesh base sand, possibly because the pumped proppant contained a much larger size range than was indicated by the standard mesh size.
FIGURE 3
Random 63–120 µm Examples from Upper (A-D) And Middle (E and F) Wolfcamp Samples
Colored Sand Diagnosis
As noted, 5 percent of the 40/70-mesh sand pumped during treatment had included grains coated in colored resins, with different colors pumped in different stages in the adjacent wells. All recovered colored grains (red, yellow, green and blue) were noted in an attempt to diagnose the pumping stage linked to specific fractures. However, this aspect of the project was done in only a semiquantitative manner because of challenges in diagnosing the colored versus base proppant.
One issue in interpreting the colored particles included the fact that in a separate study under the HFTS project, autoclaving of fresh red resin-coated proppant in the laboratory showed that the resin itself had changed color to a more orange-yellow hue under high-pressure/high-temperature conditions. Based on these results, it was assumed that the other pumped colors could have changed in hue after the initial fresh state.
Another challenge related to the 100-mesh base sand, which contained pink and yellow-hued grains in addition to clear-to-white. Scanning electron microscopy X-ray energy dispersive spectroscopy (SEM-EDS) revealed that many of the 100-mesh base grains have Fe-oxide deposits on the surface, giving them a reddish or yellowish color. Figure 4 (left) shows examples of a random sampling of fresh 100-mesh base proppant imaged with a macro lens, highlighting the vast range in sizes pumped. The white boxes denote the oxidized grains with yellow-orange-reddish hues.
FIGURE 4
Fresh 100-Mesh Base Sand (Left) and Recovered 250-500 µm Proppant (Right) Samples
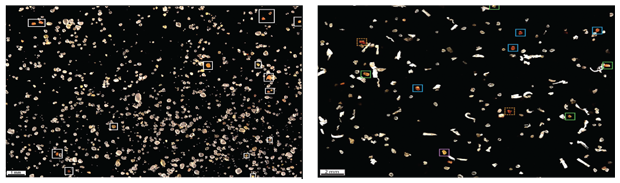
For these reasons, colored proppant within the imaged samples was categorized as either base, red, yellow, blue or green. Blue likely included some green grains, and vice versa, and some of the oxidized base grains potentially were counted as red or yellow, and vice versa. Colored proppant was visually estimated manually in a very conservative manner from each image, giving the minimum estimate of any colored proppant found. The blue/green proppant rarely occurred in discreet fracture samples, but the red and yellow proppants usually were found together, indicating either potential mixing within the core barrels or that the oxidized base grains are more ubiquitous than previously thought.
Figure 4 (right) is part of a 250-500 µm image illustrating the difficulty of characterizing colored proppant after retrieval from the subsurface. Clear-to-white base proppant is abundant and obvious. Blue boxes are red proppant, the purple box is yellow proppant, green boxes are grains that either could be oxidized base or faded red or yellow proppant, and the dashed orange boxes are examples of other colored particles found within samples that are not proppant.
Ultimately, all sampled fractures contained at least some base and/or colored proppant, especially in the smallest size fractions but the extent to which the proppant was introduced during the core drilling process is unknown.
Editor’s Note: The HFTS proppant analysis and distribution study was funded by a Gas Technology Institute subcontract under National Energy Technology Laboratory contract DE-FE0024292. The authors acknowledge Core Laboratories, which was instrumental in handling all logistics of cutting the tubes, cleaning the exterior surfaces, and marking, laying out and repackaging the core.
In addition to Laredo Petroleum as the Midland Basin HFTS host, participants include Chevron, ConocoPhillips, Core Laboratories, Devon Energy, Discovery Natural Resources, EnCana, Energen, ExxonMobil, Halliburton, Pioneer Natural Resources, Shell, SM Energy, Total, Occidental Petroleum, The University of Texas at Austin, and the UT Bureau of Economic Geology. GTI also has initiated a second DOE/NETL-funded HFTS in the Delaware Basin at an Anadarko Petroleum Corp.-operated location in Loving County.
Editor’s Note: The preceding article was adapted from URTeC 2902629, a paper originally prepared for presentation at the 2018 Unconventional Resources Technology Conference, held July 23-25, 2018, in Houston. For more information on the Midland Basin HFTS research findings, see a series of papers related to various aspects of the project presented during two special technical sessions at URTeC.

SARA J. ELLIOTT is a research scientist associate III at the Bureau of Economic Geology in the Jackson School of Geosciences at the University of Texas at Austin. She joined BEG in 2013 after receiving an M.S. in geosciences from Pennsylvania State University and a B.S. in geological sciences and biology from the University of Miami. Elliott specializes in scanning electron microscopy imaging, especially cathodoluminescence and SEM-based image analysis.

JULIA F.W. GALE is a senior research scientist at the Bureau of Economic Geology in the Jackson School of Geosciences. She joined the University of Texas at Austin in 1998 after teaching structural geology and tectonics for 12 years at the University of Derby in the United Kingdom. Gale’s current research is focused on natural fracture characterization in shale reservoirs. She holds a Ph.D. in structural geology from Exeter University.
For other great articles about exploration, drilling, completions and production, subscribe to The American Oil & Gas Reporter and bookmark www.aogr.com.