


High-Definition Video Provides Revealing Insights Into Completion Efficiency
By Curtis Jerrom and Ashley Cote
CALGARY–Fracture treatments and sand placement within the propped reservoir volume have always been at the crux of the success or failure of unconventional wells. One common question is whether bigger is necessarily better when it comes to pumping frac sand (and fluid). How about pump pressures? Do higher pressures equate with improved well performance?
These two factors–frac sand volume and pump pressure–are critical in terms of well productivity and recovery rates. The size and orientation of the perforations are a key determinant of both sand placement and breakdown pressures. To analyze how the internal expansion or growth in diameter of perforations influences fracture efficiency, a high-resolution downhole camera was run in a horizontal well in the Montney Shale formation in northern British Columbia.
The horizontal wellbore has 4.0-inch inside diameter L80 casing cemented in place to provide continuous isolation. True vertical depth is 3,408 feet with a downward toe at 6,454 ft and small rises or undulations throughout the lateral measuring no more than 20-35 feet from the high to the low. For this wellbore, the clusters were small and not orientated. It was completed in 18 stages using the plug-and-perf method. All perforations were shot with limited-entry tools using three perforations per cluster and five clusters per stage with 60-degree phasing (perforation every 3.14 inches) with 23-gram deep penetration charges.
To determine fracture effectiveness of each stage, the downhole tool was run on electric line post-fracturing to capture video for analysis. The camera deployed in this application has a corrosive-resistant, 1 11⁄16-inch outside diameter housing that is pressure rated to 16,500-psi and can withstand temperatures to 302 Fahrenheit. Advancements in downhole camera technology include high-speed bidirectional video telemetry and sophisticated downhole processors that enable streaming high-definition 720p resolution on an electrical conductor.
The downhole tool integrates two cameras–one forward facing and one side view–with a robust bi-directional motor that allows it to turn in either direction. This allows the operator to view the perforations at right angles to the wellbore for accurate measurements of the perforations “on the fly” with visual software programs that account for either gas or fluid environments.
Immediate Assessment
One main advantage of this real-time video capture is that it allows the operator to immediately assess the data within the wellbore. The camera captures hydrocarbon and water inflow, reducing the wait-and-see time associated with other downhole analytical tools, and it is not impeded by multiphase flow regimes or sensor thresholds. The camera can orient quickly to the phasing of the perforations and evaluate the condition of each perforation as it relates to erosion.
The camera was deployed on 2 1⁄8-inch coiled tubing with an electric line pumped inside to allow for downhole communication to the surface. This enables the camera to livestream video to anywhere in the world. The CT is needed to push the camera horizontally throughout the lateral leg of the well in a controlled manner to allow the camera to capture all the video of the perforations. The logging speed through the perforations was 10-12 feet/minute to allow the best view of the perforations, and then 60 feet/minute through the areas where there were no perforations. These were the optimal speeds to reduce time on location and gather the high-definition data required for a thorough analysis.
It should be pointed out that in this Montney Shale well, the operator elected to use “frac pods” as diverter agents pumped into the wellbore during the stimulation treatment to allow for equal distribution of fracture pressures across the clusters. The pods effectively flow into dominant perforations to restrict their flow, with the ensuing backpressure forcing the fluid and sand into other perforations within the clusters so that they fracture equally.
The objectives of this project included:
- Determining the effectiveness of the operator’s fracture treatment program regarding the amount of sand pumped in each cluster and stage;
- Determining the effectiveness of the diverter treatment in each cluster; and
- Assessing whether the diameters of the perforations increased equally in size throughout the fracture treatment process, thereby allowing the formation to equally produce oil, gas and condensate throughout its trajectory.
Perforation Growth
The camera investigated the size and orientation of the perforations immediately after fracturing with the original frac treatment water in the wellbore. No clean-out was done prior to running the camera since the operator wanted to see the insitu results of the treatment as well as note any potential areas of sand or liquid holdup. The cameras were able to see 92% of all 288 perforations within the horizontal section of the wellbore before the E-coil fractioned off at stages one-three toward the toe of the wellbore. The video was able to easily identify many oblong and deformed perforations within the clusters, as well as many untouched perforations within the same cluster.
The results led to some important conclusions for the operator regarding cluster efficiency, stage efficiency and whether there were other factors missing from the fracture treatment data that were needed in order to create the full picture.
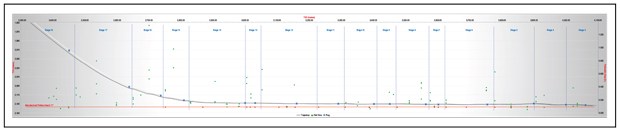
Figure 1 shows a perforations analytics graph of the Montney well. Each dot on the graph represents one perforation that was visually seen and accurately measured with video. Each dot also is placed along the directional survey of the well as it pertains to the depth location within the wellbore and associated with the cluster and stage to which it belongs. The position of the green dot corresponds to the increased size as a percentage after treatment compared with its nominal manufacturer circular area of 0.11 inch. The farther away from the red dotted line, the larger the perforation hole grew from the fracture treatment.
FIGURE 1
Perforations Analytics Graph of 2-D Wellbore with Clusters, Stages and Deviation Survey
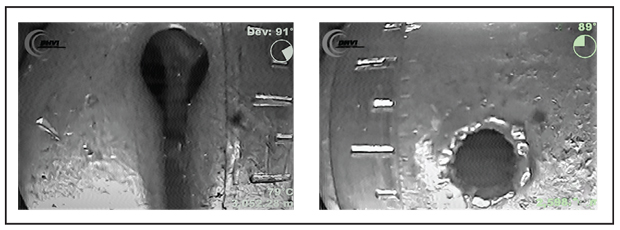
It is apparent that not all perforations take the fluid and proppant equally, with some showing a defined heel or toe expansion from the sand (Figure 2). The typical unfractured perforation still exhibits sharp edges and a “crown.” Perforations that have been fractured with sand have smooth edges with a polished reflection.
FIGRURE 2
Treated (left) versus Untreated (right) Perforation
Optimization Signs
Once the data from the camera was organized and incorporated with fracture treatment data, an interesting trend began to emerge that offered telltale signs of optimization. The data is entered into charts showing cluster efficiency with each perforation having a stage-cluster number (for instance, 16-2 is stage 16, cluster 2) indicating whether it is a heel (numbers from 1 and 2) or toe (numbers 3 and 4) perforation. As shown in Figure 3A, stage 16 shows an even fracture treatment except for cluster 3. Why? By incorporating the fracture treatment data, the differentiators are revealed.
FIGURE 3A
Stage 16 Cluster Efficiency after Fracturing
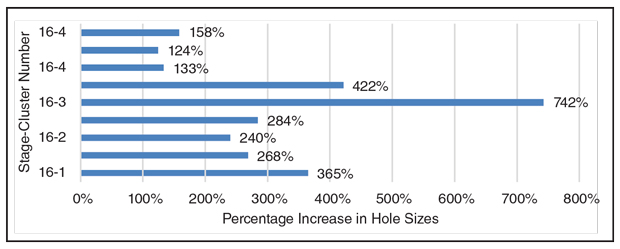
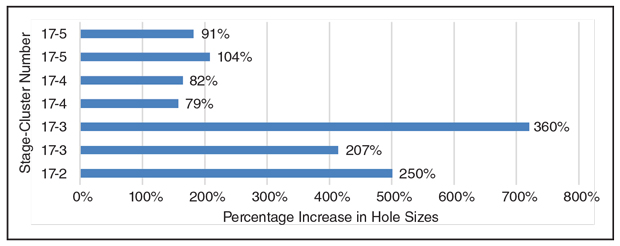
Stage 16 had diverter pods dropped with most of the fracture treatment going evenly into the clusters and a higher percentage of growth in the radius of the perforations. This stage had average growth of 304% and a high of 742% growth in perforation size compared with the initial pre-fracture perforation. Stage 17 (Figure 3B) had no pods and the fracture treatment stayed mainly in the heel section of the cluster, with average growth of 175% and a high of 360% in perforation size. It is easy to see that the diverters helped equalize the growth of the perforations during the fracture treatment process, even though both fracture treatments showed preferential growth toward the heel.
FIGURE 3B
Stage 17 Cluster Efficiency after Fracturing
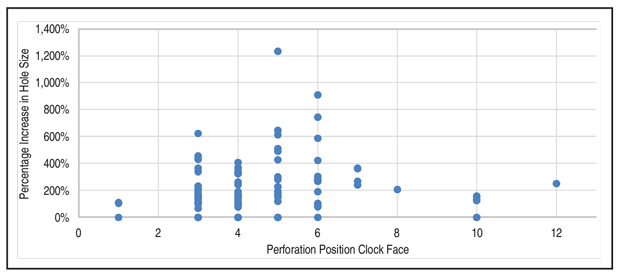
Other variables include perforation orientation within the casing. Using “clock face numbering” from 1-12, with high side representing 12 o’clock and low side 6 o’clock, shows perforation effectiveness (Figure 4). Of course, other variables occur within the wellbore, such as continuous cement bond, deviation and the perforation shot density, but for this wellbore, the data was consistent. The perforations on the low side from 3-7 o’clock showed the largest growth in diameter post-fracture treatment.
FIGURE 4
Percentage Change in Hole Size Versus Perforation Orientation after Fracturing
Referencing the snapshot of the wellbore in stages 16 and 17, let’s now look at post-fracture treatment perforation growth of all the stages to gain potential insights for optimizing future production. The mean average growth was 270% with a minimum of 110% and a maximum of 555%. Combining the perforation analytics process with the fracture treatment data allows the operators to rationalize the performance of each stage, compare treatment data charts to visualize successful treatments, and mitigate trends in fracture treatments that yield poor results.
The data analysis can be transferred to other wellbores with similar properties, but there are many variables that constantly differentiate successful fracture treatment programs that are not shared among wells, frequently even two wells on the same pad.
Data variances also occurred in the Montney well because of mechanical failures within the system where zones 10 and 13 had a bridge plug failure during the treatment that caused a loss of pressure, and potentially secondary treatment to the lower zones.
Enhanced Analysis
As this application demonstrates, downhole video can greatly enhance completion analysis. The data showed that the sand pumped in each stage enhanced the size of the perforations, but was restricted by orientation of perforations such that the low side of the hole received more sand than the high side of the wellbore. In other words, the sand did not travel effectively to the full circumference of the wellbore in the horizontal plane where the deviation was 88-92 degrees. There was not a lot of sand present in the wellbore, so with the large tonnage of total sand pumped during treatment, the high volume of sand was effective and stayed in the formation.
FIGURE 5
Average Percentage Change in Perforation Diameter (All Stages)
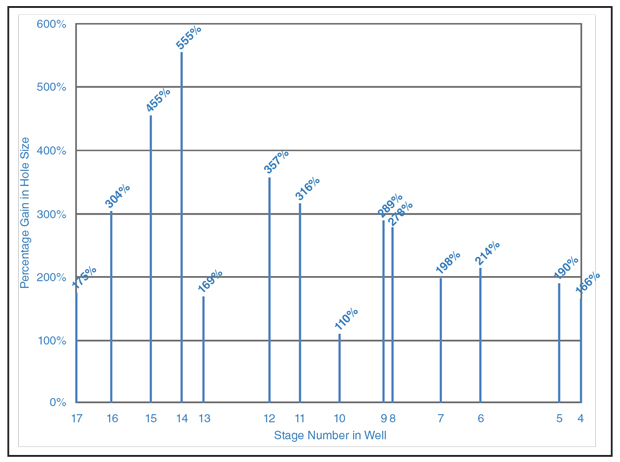
Moreover, the camera showed that diverter pods created more effective and even perforation growth compared with perforations in non-pod clusters that had similar treatments in the same stage. The camera also identified unequal perforation size increases throughout the wellbore, even in clusters that were treated the same in each stage, resulting in unequal efficiencies (Figure 5). The fracture treatment was not equal throughout the wellbore, with diminished effectiveness toward the toe on a wellbore with a mild toe-down trajectory.
All these benefits notwithstanding, downhole video’s greatest potential would be during the production phase when the inflow of hydrocarbons could be seen in situ to answer questions about whether large perforations contribute more production than smaller perforations.

CURTIS JERROM is president at Downhole Video and Intervention (DHVI) in Calgary. He has 24 years of management and operating experience with downhole video applications, production and caliper logging suites. Before joining DHVI in 2017, Jerrom served in executive and management roles at EV Canada and Expro Group Canada, where he helped pioneer downhole camera technology in the upstream oil and gas industry. He holds a B.S. in geology/earth science from the University of Saskatchewan.

ASHLEY COTE’s focus is on real time optimization of hydraulic fracture stimulations as they are being completed. He has authored several technical papers related to well design improvement strategies. Initially gaining hands-on experience in the hydraulic stimulation (fracturing) industry with BJ Services, he has, over the past 15 years, focused on hydraulic fracture design optimization. In particular, his main focus has been on developing improved reservoir stimulation approaches to maximize production. Cote holds a B.S. in petroleum engineering from the University of Alberta.
For other great articles about exploration, drilling, completions and production, subscribe to The American Oil & Gas Reporter and bookmark www.aogr.com.