


Integrated Approach Characterizes Plays
By Troy Tittlemier, John Speight, Charles Hager and Isaac Easow
MIDLAND–There are thousands of feet of stacked unconventional targets from the top of the Leonardian to the base of the Wolfcampian in the southern Delaware Basin. While the liquids-rich Bone Spring and Wolfcamp formations are the primary focus of horizontal activity, operators in the basin also know there are multiple prospective productive Paleozoic formations both above the Bone Spring and Wolfcamp in the overlying Delaware Mountain Group as well as below in underlying intervals from the Pennsylvanian down to the Ordovician–including the Mississippian Woodford.
In deeper Paleozoic formations below the Permian-aged Bone Spring and Wolfcamp, the thermal maturity of the source rocks increases and reservoir fluid is expected to be predominantly gas. There are indications of potential liquid-rich production in specific geological, structural and thermal maturity settings, but only a limited number of laterals have been drilled and completed to date in deeper Paleozoic formations across the basin.
To evaluate a project in a comparatively new area in the southern Delaware Basin with scarce offset well information, Trey Resources implemented a comprehensive reservoir characterization approach based on advanced surface logging measurements collected while drilling one vertical pilot and two horizontal wells targeting the Wolfcamp and Woodford. Mud gas geochemistry, fracture detection from mud flow, chemostratigraphy and source rock evaluation were used to characterize both rock and fluid properties, and the resulting data were integrated with open-hole wireline log data to identify landing targets and optimize completion design.
The integrated approach represents a nonintrusive and cost-effective alternative for reliable formation evaluation. The insights gained can help operators map regional hydrocarbon distribution, locate fracture-prone reservoirs, predict fracture-related porosity and permeability, identify faults, estimate gas-to-oil ratios, identify higher water production intervals, and plan future drilling and completions strategies for both primary and secondary targets.
In this project, the best points for landing depths in both the Wolfcamp and Woodford were selected by evaluating reservoir quality, production potential, reservoir compartmentalization, source rock character, microfractures, estimated reservoir fluid type, and predicted GOR. The surface logging techniques also were used to aid in geosteering the laterals and provide inputs for reservoir quality typing and well completion.
The objectives of the formation evaluation program included measuring hydrocarbons, gas isotope ratios and helium in the formation from the drilling fluid, organic and inorganic geochemical evaluation from drill cuttings, and formation fracture detection from advanced flow measurement of drilling fluid returns. These acquired data were utilized to evaluate the fluid properties and reservoir quality of each potential hydrocarbon-bearing layer in the vertical well, which then aided in selecting landing points and designing completions for the two horizontals.
Project Workflow
The workflow encompassed:
- Identifying formations with significant hydrocarbon saturation and evaluating formation fluid composition and gas isotopic ratios in the vertical pilot;
- Utilizing fluid composition and isotopic data to predict reservoir fluid type;
- Collecting organic and inorganic measurements from drill cuttings to characterize the chemical composition, bulk mineralogy and source rock production potential and maturity;
- Measuring the quantity/quality of oil present in select samples to characterize heavier hydrocarbons and integrate with light hydrocarbons measured from mud gas analysis;
- Identifying natural fractures using surface flow measurements, X-ray fluorescence (XRF) and helium detection;
- Selecting landing targets for drilling the laterals;
- Defining the target lithology with chemostratigraphy in the vertical well for geosteering the laterals; and
- Detecting drill bit metamorphism and evaluating drill bit performance to identify early bit wear and provide geosteering inputs to steer away from abrasive rock that prematurely wears bits.
With a lack of nearby offset wells and reservoir characteristic information available, the primary objective of the formation evaluation program was to assess the hydrocarbon potential of various formations in the upper and lower Paleozoic using reservoir information collected while drilling.
Several zones of interest were selected for reservoir fluid and geochemical characterization using surface logging data acquired while drilling. Zones with higher hydrocarbon quantity were identified and then characterized for gas composition and ratio analysis to identify barriers, compartmentalization and predict fluid type and properties.
FIGURE 1
Composite Log Showing Reservoir Fluid Characterization
Using Light Hydrocarbon Gas Data and Ratios
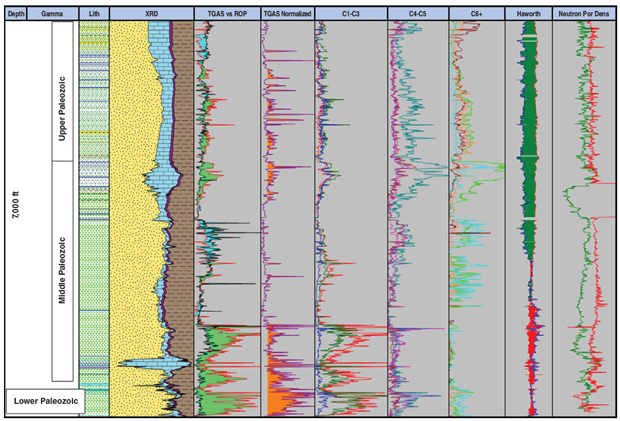
Figure 1 is a composite log showing reservoir fluid characterization utilizing light hydrocarbon gas data and mud gas ratios plotted with bulk mineralogy, measurement-while-drilling gamma (first track) and wireline neutron density and porosity (last track on the right). Plotting the mud gas isotopic ratios associated with zones of interest alongside mud gas ratios on specific geochemical fingerprinting models helps define reservoir seal integrity, diffusion patterns, compartmentalization, origin, fluid associations, fluid mixing, gas type and source rock maturity.
The Haworth gas ratio curves clearly show a fluid compositional transition from green color-shaded higher wetness zones in the upper Paleozoic formation to the red color-shaded lower wetness zones in the Pennsylvanian to the Woodford. Haworth ratios characterize whether gas is rich or lean in higher molecular weight alkanes (ethane to pentane) versus a lighter molecular weight alkane such as methane (gas ratios can be calibrated to local production data when available to improve the accuracy of GOR and fluid type predictions).
Identifying Productive Zones
Based on the ratios from the pilot hole, the upper Paleozoic formations were interpreted to be in the potential productive oil zone. In the deeper Pennsylvanian and Barnett formations, the ratios indicate a potential productive wet gas condensate trend, while the deeper Woodford ratios point to a potential productive condensate or a high GOR fluid.
The gas quantity (normalized for rate of drilling) indicates an increasing trend in the upper Paleozoic. Below the Wolfcamp, gas quantity decreases until the Pennsylvanian. From the Pennsylvanian to the Woodford section, normalized gas quantity increases significantly, with the highest measured quantities in the Woodford.
The evaluation indicates a mixing trend from bacterial to thermogenic gases in the shallower upper Paleozoic formation, while the deeper Pennsylvanian to Woodford gases appear to be thermogenic (upper right in Figure 2). The fluid associations plot at the bottom right of Figure 2 shows a clear delineation of gas ratios versus isotopic ratios for each formation and source rock.
FIGURE 2
Gas Isotopic Ratios Plotted with Mud Gas Compositional Data On Geochemical Fingerprinting Models
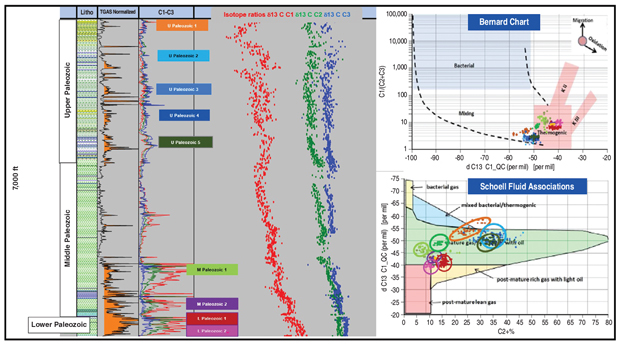
The gas from shallower upper Paleozoic plots high on the boundary between the “mixed bacterial/thermogenic” and “mature gas co-formed with oil or oil-associated gas” windows. Gas from the upper Paleozoic plots in the center of the “oil-associated gas” window. Gas from the Pennsylvanian and Barnett shows much lower wetness, but still plots within the oil-associated gas window. Gas from the Woodford and Devonian formations plots at the boundary of the “oil-associated gas” and “post-mature rich gas with light oil” windows. The isotopic ratio curves show increasing maturity trends (isotopically heavier ratios) from shallow to deep, with a more prominent trend in increased gas maturity along the pilot hole’s vertical column.
Hydrocarbon quantity (using weight percentage of oil present in the rocks) and quality were measured from drilled cuttings using a flame ionization detector. Mud circulation challenges and lost control material saturation made it difficult to obtain these organic measurements, but the gas chromatography data indicate quantity increasing in the upper Paleozoic and all samples within the light hydrocarbon range. However, differences in the character of the chromatography between the samples suggest fluid barriers and compartmentalization.
Total organic content and pyrolysis measurements performed on select samples imply that the maturity trends for the upper Paleozoic are in the oil generation window and in the condensate gas window for the Barnett and Woodford.
Elemental analysis was performed on the cuttings to characterize the rock properties while drilling and provide input to rock typing. The depth of the samples was quality checked by comparing the MWD gamma against the calculated gamma from XRF. The cuttings were representative of depth following the drilling and MWD tool depths. There was a small delay in cuttings arrival at the top of one formation in the upper Paleozoic because of mud losses. A shift in all cuttings-based data had to be applied to compensate for the delayed arrival.
In the Wolfcamp formation, the upper part of the target shows higher organic proxies and terrestrial material as indicated by titanium and zirconium. The lower part of the target shows a decline in these terrestrial materials. Below the target base, the rock is predominantly carbonate-rich, with low silica, titanium and zirconium, but with a higher quantity of formation gas.
Crucial Information
The elemental data provided crucial information on the rock properties within both targets. Figure 3 shows the various chemostratigraphic layers around the target. The first track plots XRF-calculated gamma (red) and MWD gamma (green). Calcium and silica identify the upper silica-rich layers and the deeper carbonate layers. Higher values of organic proxies shown in green with lower values are in blue. Titanium is shaded brown in higher values in the upper target and magenta in the lower carbonate-rich layers. TGas versus ROP shows the intervals with higher gas quantity and the corresponding light hydrocarbon trends. The mineralogy track was quantified from XRF elements.
FIGURE 3
Chemostratigraphic Layers Around Wolfcamp Target
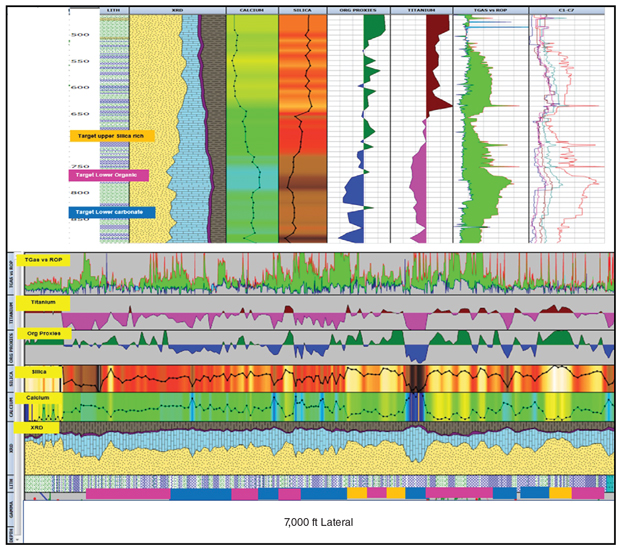
The top and base of the Wolfcamp was defined based on XRF elemental ratios and gas trends from petrophysical modeling. The upper part of the target is rich in silica and the lower part is rich in carbonate. The silica-rich layer shows a higher gas quantity. The lateral was drilled mostly in the lower part of the target and below the base into the carbonate-rich layer with some intervals going into the upper organic- and silica-rich layers. Hydrocarbon quantity was generally high for most of the lateral except toward the toe, where it decreased moderately.
The upper part of the Woodford is interpreted as more silica-rich and cherty, followed immediately by a uranium-and- organic-rich section with higher gas quantity, including minor helium. The middle and lower parts of the Woodford are characterized by higher zirconium content, slightly lower silica and lower uranium. The silica content increases again toward the base of the Woodford.
The target for landing the lateral was selected in between the uranium- and copper-rich layers in the upper Woodford. The lateral was drilled toe-up to the top of the target in the uranium-rich layer. The data suggest a change in gas composition and a potential influence of water in the lower part of the Woodford. The hydrocarbon quantity was uniformly consistent, with traces of minor helium readings recorded throughout the lateral.
Advanced flow analysis (AFA) was carried out on site on the vertical pilot and second lateral using delta flow measurements. Fractures identified using AFA were integrated with the advanced mud gas analysis, helium and XRF elemental analysis data. Wireline logs were run only in the vertical well, including a suite of image logs, but because of wellbore challenges, the tools were unable to log all the way to bottom. Fractures identified from the wireline image logs matched fractures identified with AFA, which helped the operator have sufficient confidence in the advanced surface logging dataset for reservoir characterization.
Fracture Data
The second lateral drilled a 7,000-foot section targeting the Wolfcamp. The Wolfcamp mainly consists of shales with argillaceous carbonates and interbedded sand and silt. The advanced surface logging data were plotted in an integrated plot (Figure 4) to identify relationships with fracture data, mud gas data and XRF elemental analysis data.
The red flags in Figure 4 indicate natural open fractures and green flags denote microfracture zones. Open fracture flags were plotted with increasing density on a scale of one to five from the bottom to the top of the fractures at a given depth interval. Mud volume losses estimate the volume of mud lost in the pore spaces of the formation when a fracture is identified. The larger the loss, the larger the size of the fracture. An increase in the presence of mud gas matches with the identification of open fractures and microfracture zones.
FIGURE 4
Integrated Plot of Lateral Section
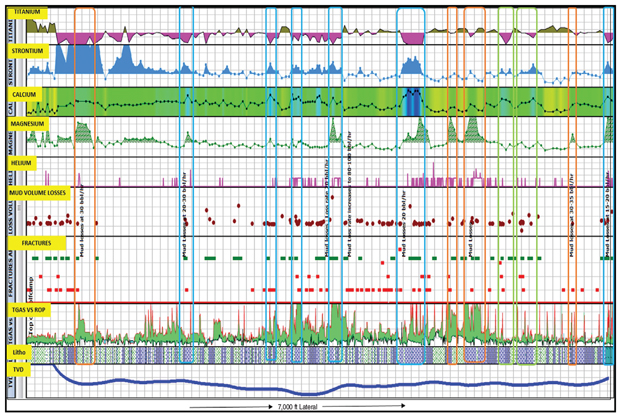
The transformation of rock properties is clearly indicated by the changing trend in the XRF elemental analysis. XRF calcium (Ca) content indicates fractures in the presence of carbonates (blue box areas), while strontium (Sr) and magnesium (Mg) are used as proxies to identify fractures in carbonate and dolomitic rocks (brown box areas), respectively, as well as to identify potential diagenesis. The green box areas indicate fractures detected in transition zones with neither higher calcium nor magnesium content.
Zirconium (Zr) was used as a proxy for siliceous content in the rocks. Increased zirconium at the landing point of the lateral, as well as toward the toe-end of the lateral, indicates sandy/silty zones in a fractured formation. AFA identified multiple fractures throughout the formation, which could also be correlated with the presence of helium. It is likely that helium is trapped within the available pore spaces and seems to have been released while the rock was being drilled, consequently indicating localized seals in porous zones.
The increase in magnesium content, indicating dolomitic properties of the rock, further confirms this theory. AFA identified fractures with relatively large volume losses every time the dolomitic content increased, indicating potentially large-aperture fractures as well as interim total mud loss at high flow rates.
Optimized Bit Runs
The drilling team was able to further push the boundaries of conventional surface logging by utilizing real-time alkenes detection and analysis to optimize bit runs. Since the field supervisor no longer had to rely on just traditional offset bit run data, he could track the generation of alkenes in the drilling mud continuously. In conjunction with penetration rate, weight on bit, torque, cuttings and XRF rock properties analysis, incorporating real-time streaming of this gas parameter optimized the bit run. The geosteering team was kept abreast of formation changes, especially abrasive siliceous content in the formation, to proactively steer away from these formations to prolong the life of the bit and the overall bit run while staying in the target zone.
The first bit drilled with a lower ROP and increasing quantity of alkenes in the background for a prolonged duration. When the bit was pulled to surface for a replacement, the driller determined that it was worn and damaged beyond repair. The subsequent bit run drilled with an optimized penetration rate and the gradual increase in alkenes wes actively tracked. The second bit was pulled in a repairable condition and with nominal wear. This technology adds a valuable component in the decision making process, helping the drilling team reach a decision whether to either continue drilling ahead or pull the assembly to change bit.
As this case study demonstrates, advanced surface logging technologies can provide high-quality data to characterize reservoir source rocks and fluids in near real time at the well site while drilling to assist in formation evaluation and provide valuable inputs to drilling, completions, production and future well planning.
Editor’s Note: The co-authors acknowledge Barzin Chiniwala and Alberto Martocchia at GEOLOG Surface Logging for their technical contributions to the integrated reservoir characterization project in the southern Delaware Basin. For more information on the project, see URTeC 2902718, a paper prepared for presentation at the 2018 Unconventional Resources Technology Conference, held July 23-25 in Houston.
TROY TITTLEMIER is an asset geologist at Trey Resources Inc. in Midland. His responsibilities include optimizing assets by characterizing reservoir targets, conducting well site geology from conception to completion, geosteering horizontal wells and conducting exploration geology for acquisition opportunities. While at Trey Resources as data manager and geological technician, Tittlemier was also an adjunct professor at the University of Texas of the Permian Basin. He holds a B.S. in geology from California Lutheran University and an M.S. in geology from the University of Texas of the Permian Basin.
JOHN SPEIGHT is exploration manager at Trey Resources. He joined the company in 2011, and his responsibilities include overseeing all aspects of the geosciences conducted within Trey Resources and conducting technical analysis of all potential deals. Speight has significant experience in the reservoir characterization of multiple unconventional horizontal resource plays in the lower-48.
CHARLES HAGER is vice president of engineering at Trey Resources. With nearly three decades of industry experience, he has developed and licensed novel technologies in rate transient analysis and generating synthetic sonic shear through geomechanical relationships. Hager began his career in Amoco’s research center and subsequently served as senior reservoir engineer at Enron Oil & Gas, reservoir engineering manager at Tom Brown Inc., consulting adviser for special projects and technology development at NSI Technologies, and technical adviser at Range Resources. He holds a B.S. in petroleum engineering from the University of Alabama.
ISAAC EASOW is advanced technologies champion at GEOLOG International in Houston. With almost 25 years of industry experience, he provides real-time interpretation support for the company’s unconventional and conventional reservoir characterization services and is responsible for its formation evaluation services. Before he joined GEOLOG in 2014, Easow worked as a remote services support manager for a multinational mud logging company, focused on interpretation and operations support. He holds an M.S. in geology from the University of Mumbai.
For other great articles about exploration, drilling, completions and production, subscribe to The American Oil & Gas Reporter and bookmark www.aogr.com.