


Intra-Stage Tracer Data Yields Insights Into More Precise Wolfcamp Stimulations
By Teddy Mohle, Kyle Johns, Wei Tian, Alex Darnley and Chris Dempsey
HOUSTON–Operators have relied on high-intensity completion designs that include a combination of high fluid and proppant volumes, increased perforation cluster density, and smaller mesh-size proppants. These designs seek to create a complex fracture network and increase the contact area with shale rock. They have helped operators achieve higher initial productivity and improve estimated ultimate recoveries while simultaneously enabling horizontal wells to be drilled at optimal spacing.
Because frac fluid recovery and proppant placement ultimately impact hydrocarbon production, engineers need to fully understand frac fluid and proppant distribution within a complex fracture network. The greater fracture complexity created with enhanced completion designs increases fracture surface area for a greater stimulated reservoir volume (SRV) and propped SRV.
SRV is usually estimated from microseismic mapping. It is a rough estimate of the volume of rock that is hydraulically fractured and sometimes is defined as the product of gross stimulated area and pay zone thickness. This estimate typically is made by inferring the size of the microseismic cloud that is recorded during stimulation. Propped SRV, or effective propped volume (EPV), is a fraction of the total SRV that is supported by proppant and capable of flowing during depletion. From a production perspective, the surface area contact of the fractional propped SRV is more important than the gross SRV estimate. Diagnostic tools to estimate propped SRV are critical to optimizing completion design and will be invaluable in the future of shale development.
A study conducted by Crimson Exploration Inc., a wholly owned subsidiary of Contango Oil & Gas Co., involved pumping multiple, unique chemical tracers into a single Wolfcamp B fracture stage. The goal of the tracer test was to shed light on the flowback characteristics of individually tagged fluid and sand segments by adding another layer of granularity to a typical tracer flowback report. Chemical tracer data has been applied extensively to offer stage-level insights into load recovery and hydrocarbon contribution, but this dataset provides new insights by looking at individual fluid segment data within a single frac stage.
This added intra-stage level of detail can provide insights into fracture behavior when stimulating shale reservoirs by looking at individual fluid segment tracer recoveries. This dataset may aid in identifying fluid segments placed outside of the propped SRV and interpreting fracture complexity.
A total of 12 water-phase tracers and 12 oil-phase tracers were injected sequentially from pad to flush within a single heel stage. After pumping the pad stage, unique tracers were used to tag the proppant-laden fluid from the 0.2 pounds of proppant added per gallon of fluid (ppa) of 100-mesh sand stage to the 2.0 ppa of 40/70-mesh sand stage before going to flush. The flush volume was not traced. Upon flowback, fluids were analyzed for the concentration of each tracer within the produced fluid samples.
Frac Stage Characterization
The first goal of the study was to determine whether any traced fluid would be placed within the “unpropped” SRV. The second goal was to determine the order of load fluid returns to verify the “first-in, last-out” phenomenon and ascertain any degree of fluid mixing, which could be an indication of increased fracture complexity.
The results illustrate the average tracer concentrations and arrival times of each traced fluid segment, which then was used to characterize the fracture stage. All tracers were detected in the produced fluid samples, indicating that no traced segment was placed outside of the propped fracture network. The results also indicate significant tracer mixing within the fracture network, a potential indicator of fracture complexity. All individually traced segments flowed back simultaneously, albeit at varying tracer concentrations. The residence time calculation for each tracer showed that frac fluid injected into the later proppant segments generally flowed back faster than the earlier segments.
A few of the questions posed before initiating this study were:
- Do certain fluid segments exhibit poor tracer recovery by being placed within an unpropped fraction of the SRV?
- Does the order of injected frac fluid correspond with the order at which tracer is produced (i.e., first in, last out)?
- Can the residence time calculation for each tracer be used to infer the degree of fracture complexity?
As operators elect to enhance fracture complexity by increasing perforation cluster density, using lower viscosity fluid systems and pumping smaller mesh proppants, the modeling of fracture geometry has proven difficult. In addition, varying perforation cluster efficiency and “sand duning” effects can prevent fluid and proppant from being uniformly distributed within the fracture network.
Without these effects, a piston-like displacement of the frac fluid would be expected within a given fracture. It also is possible that a limited recovery of the pad stage will be observed should it be placed outside of the propped fracture network. By tagging each fluid and sand segment of the stage, the residence time distribution of each tracer should yield insight into fluid and proppant distribution.
The Wolfcamp formation in the Delaware Basin is highly heterogeneous. It contains interbedded shale and limestone. The formation’s carbonate in the northwestern part of the basin has light-colored dolostone, while the Wolfcamp in the rest of the basin consists of dark-colored lime packstone, wackestones and mudstones. The Wolfcamp’s average thickness in the Delaware is 2,000 feet, but thickness can exceed 6,000 feet in the western portion of the basin. Depth ranges from 10,000 to 12,000 feet, with the Wolfcamp divided into four units: A, B, C and D, from shallow to deep, respectively.
Unique Chemical Tracers
The Crimson study focused on a horizontal well drilled and completed in the Wolfcamp B formation. The lateral length is ±10,000 feet with 48 fracture stages. Each stage consisted of ±500,000 gallons of water-based frac fluid and 451,000 lbm of sand. Slickwater and linear gel were used as the carrier fluids. The pump schedule consisted of pumping 100-mesh sand from 0.2 to 1.0 lbm/gallon, followed by 40/70-mesh sand from 1.0 to 2.0 lbm/gallon. The entire stage treatment was divided into 15 segments based on the frac fluid, proppant size and concentration.
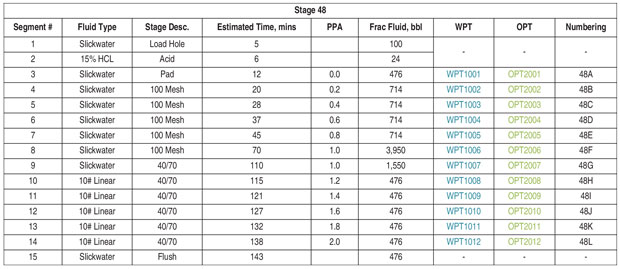
A total of 12 unique water-phase tracers and oil-phase tracers were injected into the heel-most stage (stage 48) to tag individual fluid and sand segments beginning with the pad segment and ending with the 2.0 lbm/gal, 40/70-mesh stage. All fluid and sand segments were allocated unique tracers. The tracers were continuously injected along with the frac fluid at a constant concentration throughout each individual segment. The chemical tracers were “conservative” tracers, exclusively soluble in their carrier fluid and resistant to decomposing or reacting under subsurface conditions. The detailed tracer injection layout and pump schedule is shown in Table 1.
TABLE 1
Tracer Injection Layout for Heel Stage (Tracers in Blue and Green)
After the well was brought on line for flowback and production, water and oil samples were collected at the wellhead. One sample a day was taken for the first two weeks, followed by a reduction in sampling frequency for the remainder of the study. The entire sampling process lasted 80 days, during which 21 water samples and 21 oil samples were collected. All samples were sent to the laboratory for analysis. Water samples were analyzed using high-resolution liquid chromatography-mass spectrometry (LC-MS) and oil samples were analyzed using high-resolution gas chromatography-mass spectrometry (GC-MS).
Tracer Data Results
Raw tracer concentrations measured in the collected samples indicate that tracers injected into different fluid and sand segments were commingled to some degree. Most of the tracers pumped were detected in each sample, including the earliest flowback samples. This shows that some fluid pumped early in the treatment (i.e., pad) was placed near the wellbore, indicating a degree of fracture complexity. Enormous connectivity between primary and secondary fractures may result in sufficient blending of frac fluid segments. This also could have been caused by varying cluster efficiency during the treatment, or duning effects at certain perforation clusters.
In general, the tracer concentration in each fluid sample declined over time as a result of dilution from increasing formation water influx. However, the tracer concentrations suddenly increased on July 25, which suggested that the water flow contribution from the heel stage increased relative to the prior sample date. This normally would be verified by relative changes in tracer production from other fracture stages if that data was available. The other fracture stages of this well were not traced.
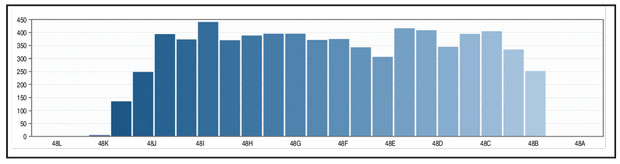
Normalizing raw tracer data to its injected amount accounts for the concentration variations related solely to the different segment volumes. Segments 48G and 48F recovered more tracer than other segments, but their normalized response was decreased somewhat, which allowed for accurate comparison with the other segments. Segment 48A, during which 476 barrels of frac fluid were pumped down hole, was selected as the standard, and corresponding normalization coefficients then were applied to other tracers.
FIGURE 1
Water-Phase Tracer Concentration Normalized to 476 Barrels
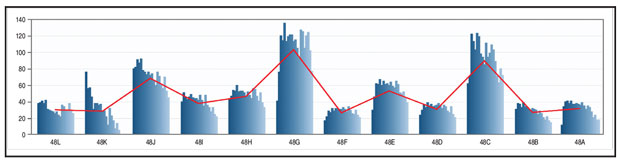
FIGURE 2
Oil-Phase Tracer Concentration Normalized to 476 Barrels
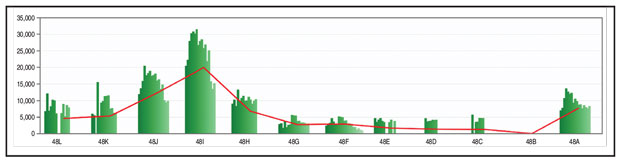
Figures 1 and 2 show the normalized concentration for each tracer. The vertical axis represents the tracer concentration in parts per trillion and the red curve indicates the average tracer concentration during the sampling period.
The earliest segments for both phases of tracer display overall increasing concentrations up to Segment 48C for water tracer and 48I for oil tracer. This could indicate that the earlier segments are more likely to partially flow into unpropped SRV and are at a much lower relative concentration to the other tracers during flowback and production.
Since oil tracer concentration is representative of the oil that is being contacted by the tracer as it travels down hole with the frac fluid, differing magnitudes of concentration imply that the tracers were contacting completely different pockets of hydrocarbon throughout the stage. This further supports the idea of the increased fracture complexity with this style of completion program.
RTD Analysis
FIGURE 3
Flowback Profile of Water-Phase Tracer Injected into Segment 48K
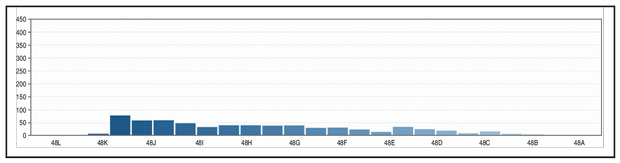
FIGURE 4
Flowback Profile of Water-Phase Tracer Injected into Segment 48G
Further probing the tracer response within a single segment provides insights into how that segment of the frac fluid was being recovered. This type of analysis can be seen visually with Segment 48K and Segment 48G (Figures 3 and 4). The response for Segment 48K exhibits a mostly decreasing profile, with the highest concentration occurring in the first sample. On the other hand, Segment 48G increases from a low number at the first sample and peaks at the fifth sample and then decreases over time. A more quantitative characteristic of these types of responses is necessary to be able to determine just what each type means.
In an effort to better understand how frac fluid in each segment was flowing back, residence time distribution (RTD) analysis was applied to the tracer data. Residence time was calculated for each tracer to indicate the average arrival time of tracer. Since there was a significant increase in water tracer concentration on July 25, only data before that date was used in the analysis. Applying this analysis to the earlier segments shows that the decreasing profile from segment 48K means that the tracer is recovered quicker than for the increasing and then decreasing profile for segment 48G, evidenced by the lower residence times for 48K.
Based on the RTD analysis, water-phase tracers for the pad-stage segment (48A) flowed back faster even though they were injected first (the pad-stage frac fluid should flow farthest into the formation). The tracers injected in 48A could leach into the SRV, which was not well propped near the wellbore. Such a leaching process did not occur to the fluid after pad segment with proppant injection. During flowback, frac fluid as well as tracer for segment 48K flowed back faster than the other fluid segments.
The remaining water-phase tracers injected in the later linear gel segments flowed back before the tracers injected in early slickwater segments. Nevertheless, no obvious piston-like displacement was observed from tracer data. Similar tracer flowback behavior also was observed for the oil-phase tracers.
As this study illustrates, chemical tracer technology is an effective, nonintrusive technique that can provide invaluable information about frac fluid dynamics inside created fractures. All tracers were detected in the flowback samples, suggesting that no fluid segments were placed completely outside the propped fracture network. A high degree of fluid mixing appeared to occur during stimulation, which could indicate high fracture complexity. This could be caused by several factors, including the breakdown of primary, secondary and tertiary fractures; varying cluster efficiency; or duning effects that led to the diversion of frac fluid within the fracture network.
TEDDY MOHLE is senior completions engineer at Houston-based Crimson Exploration Inc., a wholly owned subsidiary of Contango Oil & Gas Co. He joined Crimson Exploration in 2011 as a production/completions engineer after beginning his career as a field engineer at Baker Hughes. Mohle has a B.S. in petroleum engineering from Texas A&M University.
KYLE JOHNS is exploration manager at Contango Oil & Gas. He has led the company’s entry into the southern Delaware Basin and its development effort in the area. Before joining Contango in 2013, Johns was a consulting geologist and senior geologist covering the Appalachian Basin for Citrus Energy. He began his career in 2005 at Denbury Resources, working on conventional assets and in the Barnett Shale. Johns holds a degree in geology from the University of Mississippi.
WEI TIAN is a research and development engineer for ResMetrics in Houston. His research interests include chemical tracers, hydraulic fracture diagnostics, and reservoir characterization. Tian holds a B.S. in energy and resources engineering from Peking University, and an M.S. and a Ph.D. in petroleum engineering from the University of Oklahoma.
ALEX DARNLEY is vice president of business development at ResMetrics, which he helped found in 2017. Darnley began his career as a hydraulic fracturing field engineer with BJ Services, and then worked as a reservoir engineer and product line manager for Core Laboratories, where he supervised various domestic and international tracer projects. He holds a B.S. in petroleum engineering from Texas A&M University.
CHRIS DEMPSEY is vice president of research and development at ResMetrics. As one of the first employees of ResMetrics, he developed the Web-based analytical tool PetroXY™. He continues to lead development efforts in tracer technology and data visualization. Dempsey holds a B.S. in chemical engineering from the California Institute of Technology and a Ph.D. in bioengineering from Rice University.
For other great articles about exploration, drilling, completions and production, subscribe to The American Oil & Gas Reporter and bookmark www.aogr.com.