


Activity Drivers
LNG Puts New Demand On Shale Plays
By Jason D. Baihly, Richard Clayton and Garrett Lindsay
SUGAR LAND, TX.–The U.S. Energy Information Administration forecasts worldwide natural gas consumption will increase from 325 billion cubic feet a day in 2015 to 390 Bcf/d by 2025 and to more than 500 Bcf/d by 2040, with much of the increase in developing countries. While about 10 percent of the natural gas produced globally is now liquefied, LNG is expected to account for a growing share of the world natural gas trade as liquefaction capacity expands.
With the shale gas revolution positioning the United States to become a major natural gas exporter, more than two dozen LNG export projects have been proposed in the lower-48, representing a combined capacity exceeding 200 million tons per annum (MTPA).
The Federal Energy Regulatory Commission has approved five of those terminals to date: Corpus Christi and Freeport in Texas, Sabine Pass and Cameron in Louisiana, and Cove Point in Maryland (interestingly, all five are converted regasification facilities originally permitted to land LNG imports). Together, these terminals have 12 liquefaction trains, all of which are scheduled to commence operations over the next four years.
Most experts believe U.S. LNG export capabilities will ultimately equal about 10 percent of domestic production. But to appreciate the significance of the potential demand call on U.S. gas production, consider that EIA data show the average volume of working gas maintained in storage in 2014 was 2.2 trillion cubic feet, which is roughly 38.7 MTPA of LNG. This is the same volume of gas as the maximum proposed annual output of only three of the four FERC-approved LNG projects under construction on the Gulf Coast.
Where will all that gas come from? The answer is that the demand growth on domestic supplies will have to be met with increased drilling, particularly in the six major U.S. shale gas plays: Barnett, Fayetteville, Woodford, Marcellus, Haynesville and Eagle Ford. It will take a significant quantity of shale gas wells to deliver enough gas to keep these LNG trains operating at full capacity.
To better quantify the impact of LNG exports on the market, a study was conducted to estimate the number of horizontal shale gas wells needed to continuously supply one U.S. LNG train. Shale gas basins were studied to estimate both the number of wells needed to supply a train initially, and the number and frequency of future wells that would have to be drilled to maintain that train at full capacity. Infrastructure and rig counts, decline trends, economics, and drilling times were included in the analysis.
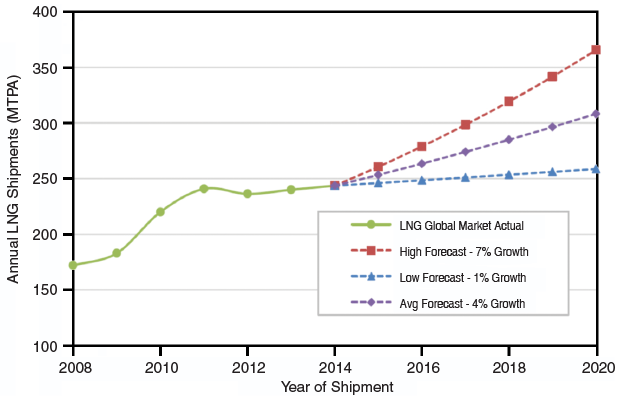
FIGURE 1
Global LNG Actual and Forecasted Shipments (2008-20)
Shale Gas And LNG Exports
As shown in Figure 1, 244 MTPA (12.6 Tcf, or 32 Bcf/d) of LNG were shipped around the globe in 2014, representing about 9 Bcf/d growth compared with 2009. The figure also shows alternative forecasts of LNG shipments through 2020, based on high-, average- and low-growth cases.
The amount of LNG shipped per year has been flat since 2011. And although depressed oil prices (LNG pricing is based on oil in global trading) and decreased gas demand projections for some regions of the world further slowed LNG growth in 2015, LNG cargos are expected to increase dramatically going forward.
The United States is unique in that natural gas is traded on a spot price basis. This can make a Btu or cubic feet of gas significantly cheaper than in other parts of the world, particularly when the price of oil is relatively high. The United States has other distinct LNG exporting advantages, namely the existence of vast shale plays located relatively close to LNG ports and connected by comprehensive transportation and storage infrastructure.
The study found that a typical proposed U.S. LNG train shipping 4.5 MTPA would require an input of 636 million cubic feet a day. Some LNG export facilities can service six or more trains, including Cheniere Energy’s six-train Sabine Pass plant in Cameron Parish, La. Supplying six fully loaded trains each with a 4.5 MTPA output would be equivalent to a pipeline stream servicing a constant 3.8 Bcf daily or 1.4 Tcf annually.
While the majority of the many proposed lower-48 export projects still are seeking permitting approval, U.S. LNG exports have become reality, with the first of the six planned liquefaction trains at Sabine Pass–the first of the five FERC-approved terminals to enter service–loading its inaugural cargo (3 Bcf equivalent of LNG) on the Asia Vision tanker in late February for delivery to Brazil.
How will growing volumes of U.S. LNG exports impact the six major shale gas basins in coming years? The total daily gas production rates from the basins are varied, with the Marcellus the most prolific and the Woodford having the lowest gas output of the six. But reaching current output levels in each of these plays required significant well counts and many rigs to drill vast numbers of laterals.
It must be noted that drilling in gas shale plays has been declining with depressed gas prices, falling from more 900 rigs in early 2011 to an average of about 330 in 2014. However, plummeting oil and gas drilling activity throughout 2015 in all basins left gas rig counts at their lowest levels in decades, with only about 100 rigs active in late February.
In the Barnett, which had recorded gas rig counts numbering in the 60s five years ago, only one rig was drilling for gas in late February. In the Eagle Ford, six rigs were drilling for gas in late February compared with 95 in late 2011. Even in the Marcellus, where rig counts topped 140 five years ago, fewer than 30 rigs were running as February came to a close.
It remains to be seen how dramatically the drilling slowdown will impact production in these basins, but it will have a negative net effect. Depending on how long the downturn lasts, it potentially could have an impact on the level of drilling response needed to supply U.S. LNG terminals.
Rig And Well Counts
To gauge the impact of LNG exports on the six shale gas basins, a comparison was made to demonstrate how many new drills it would take in each basin to start and maintain a single 4.5 MTPA LNG train representing the production equivalent of a constant stream of 636 MMcf/d. The analysis assumed that all production would be obtained from new drilling, and that a significant number of new drills would be required to start the train at full capacity, with a smaller number of wells then needed to maintain production delivered to the train.
Gas shale basin-specific decline curves and estimated ultimate recoveries were utilized to determine the number of wells needed to supply an LNG train. Both are key variables that impact how many wells need to be drilled initially and over time to supply an LNG train.
FIGURE 2
Average Daily Gas Rate per Well by Basin
Based on Arps Declne Curve Forecast
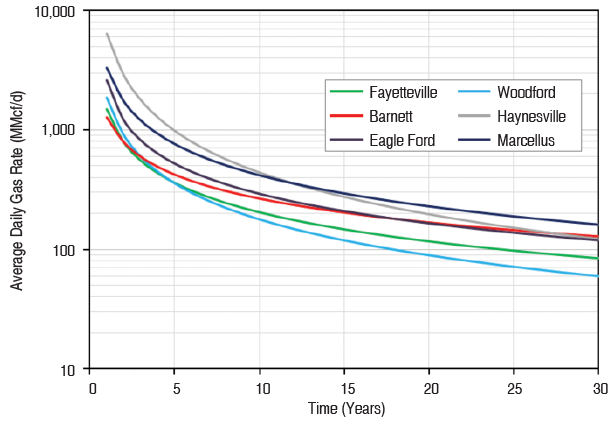
The Haynesville has the highest well EUR, followed by the Marcellus, Eagle Ford, Barnett, Fayetteville and Woodford. The Haynesville also has the steepest production decline, but the Eagle Ford has a fairly steep decline as well (Figure 2). The Barnett and Marcellus have the most gradual decline production trends.
The assumed drilling times for all six plays averaged 15.5 days (about two wells per month), but ranged between 6.8 days for the Fayetteville and 30.4 for the Haynesville. Well counts were obtained using yearly average production rates for each basin. The analysis focused on core areas with the highest EURs within each play, so the estimates for actual well counts are likely to be conservative.
The results show that the Haynesville requires the least number of wells to supply a single LNG train for 30 years, at 1,118 laterals. However, the play’s relatively long drill times mean that it still would require nine rigs for startup and three rigs after nine years to maintain production.
The Fayetteville requires significantly more wells than the Haynesville (3,279), but utilizes roughly the same rig count to supply a single LNG train, given its considerably faster drilling times.
The Barnett and Woodford are a bit more rig- and well-intensive, requiring 15 and 14 rigs at startup, reducing to two and four rigs, respectively, after 12 years. The Barnett rigs would have to drill 2,815 horizontals, while the Fayetteville would need 3,383 laterals over 30 years to supply an average LNG train.
The Eagle Ford is not quite as rig-intensive, starting up with 11 rigs and then declining to four after eight years to drill 2,294 laterals. The Marcellus may be the second most efficient play, requiring nine rigs at startup, three rigs after four years, and two rigs after 14 years to drill 1,572 horizontal wells.
Substantial Volume
To attain a reasonable estimate of potential LNG export volumes, only the five U.S. projects that had completed all of the permitting processes and were under construction as of mid-2015 were considered. Furthermore, the analysis used the permitted volumes approved by FERC, rather than total capacity.
The four Gulf Coast facilities (Sabine Pass, Corpus Christi, Freeport and Cameron) have a combined FERC-approved capacity of 8.36 Bcf/d (59.17 MTPA), while Cove Point has an approved capacity of 820 MMcf/d (5.25 MTPA).
The total U.S. FERC-permitted LNG production of 64.42 MTPA is a little more than 25 percent of global LNG cargos shipped in 2014. It also represents 11 percent of current total domestic natural gas production, which is a substantial, but not insurmountable, volume.
To better understand how gas export capacity may impact each shale basin, the plays were delineated into regions, with production from the Barnett, Eagle Ford, Fayetteville, Haynesville and Woodford delegated to Gulf Coast facilities, and Marcellus production delegated to the lone East Coast plant.
TABLE 1
Current and Future Production to Supply
FERC-Approved Gulf Coast LNG Plants
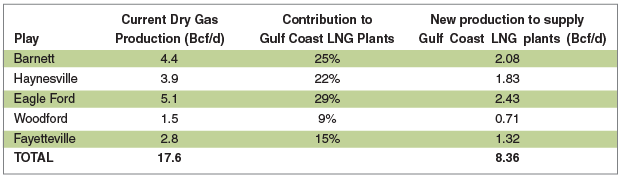
The impact of Gulf Coast LNG exports on regional shale plays was analyzed based on a weighted average to get the contribution percentage of the 8.36 Bcf/d of gas production needed to maintain full LNG export capacity of all Gulf Coast trains. Table 1 shows each play’s contribution.
Assuming that the production to supply Gulf Coast trains would be incremental to existing production, and sharing the load between plays on the basis of their production proportions, a total of 144 rigs would be required to facilitate starting LNG exports across all five plays–roughly 100 more rigs than were working in these basins at the end of 2015.
Supplying The Load
Based on recent gas production by Gulf Coast shale basins, a weighted average analysis was performed to determine the total amount of gas needed to supply the FERC-approved Gulf Coast LNG export volume of 8.36 Bcf/d, with each gas shale basins taking on a load equivalent to its weighted average based on production when summed with the other four shale plays in the South-Central United States.
Considering each basin individually, the Barnett is tasked with supplying a significant portion of the load, at nearly 25 percent of Gulf Coast LNG output. This would require 46 rigs to drill 1,652 laterals in the first year. Even after 10 years, eight rigs would have to drill 260 wells annually. The Haynesville would have to deliver less gas than the Barnett, but 25 rigs would still be required at startup to drill 296 wells. Ten years later, eight rigs would be needed to drill 101 wells to cover demand from Gulf Coast LNG facilities.
The Eagle Ford would be the largest gas supplier in this model, with 40 rigs at startup drilling 939 laterals. After 10 years, a dozen rigs would be required to drill 271 wells to maintain supply. In this model, the Woodford supplies the least amount of gas to Gulf Coast terminals, with only 16 rigs drilling 431 wells during the first year and five rigs drilling 116 wells during year 10.
The Fayetteville is the last basin utilized in the Gulf Coast LNG supply model. It would require 17 rigs to drill 906 wells during the first year of LNG shipments, dropping to four to drill 205 horizontals after 10 years.
Improvements in drilling efficiencies may lower the number of rigs required in the modeling forecast, and productivity improvements could reduce the number of wells needed. On the other hand, if more new drills produce a multiphase mix of oil, gas and condensate as opposed to only dry gas, incrementally more wells and rigs may be needed.
If all the LNG trains were to come on line at the same time, it would create a spike in drilling rig demand. However, with the phased startup of the permitted Gulf Coast plants over four years, a minimum of 30-50 rigs working continuously should be able to keep up with demand. This may be impacted by U.S. gas storage and demand levels.
TABLE 2
Plays Ranked by Well Cost per EUR
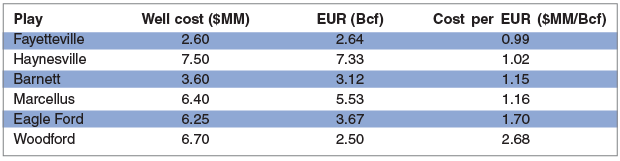
To predict future drilling hot spots, the study looked at the ratio of EUR versus well cost for the plays, admittedly ignoring other factors that may influence drilling decisions. The Fayetteville yields the greatest EURs for the lowest well cost, followed by the Haynesville, Barnett, Eagle Ford and Woodford (Table 2).
Assuming that the Marcellus would supply 100 percent of the 820 MMcf/d of input gas for Cove Point, 12 rigs would be required to drill 253 horizontals during the first year of exports, but after eight years, only three rigs could maintain production. Analyzing well cost per EUR shows the Marcellus is fairly cost competitive with shale plays fueling Gulf Coast LNG facilities, ranking about the same as the Barnett and ahead of both the Eagle Ford and Woodford.
With up to 3,400 shale wells needed to supply a single LNG train, the total well count necessary to supply the LNG plants already under construction and beginning to enter service would be at least 38,000 over 30 years, if shale plays exclusively were to supply all the demand. For perspective, that would represent more than twice the number of producing wells in the nation’s oldest and most developed gas shale play–the Barnett–and nearly 14 times the number of wells drilled in the Haynesville since its discovery in 2007.
The best news for the industry is that those LNG supply wells will be needed above and beyond the wells required to service domestic natural gas consumption, which has grown by 5 Tcf annually over the past decade and which EIA forecasts will continue expanding gradually in coming decades.

Jason D. Baihly is refracturing integrated project manager at Schlumberger. He leads all aspects of refracturing, including candidate recognition, treatment design, risk mitigation, engineering, economic analysis, production forecasting, real-time diagnostics, and post-treatment production modeling. He joined the company in 2003 as a production/stimulation engineer, and subsequently served as subsurface manager, multistage stimulation manager, and unconventional resources team lead in the Marcellus, Woodford, Haynesville, Bakken, Eagle Ford and other shale plays. He holds a B.S. in civil engineering from the South Dakota School of Mines & Technology and an M.S. in management in oil and gas from Heriot-Watt University.

Richard Clayton is a senior production engineer at Schlumberger in Houston. Since joining the company in 2007, he has worked in asset evaluation and operational roles on assets co-managed by Schlumberger’s production management group in Europe, South America and various U.S. basins. Clayton is currently engaged in the co-development of an Eagle Ford Shale asset. He holds a master’s in mechanical and electrical engineering from the University of Reading and an M.S. in management sciences from the University of Waterloo.

Garrett Lindsay is a senior production engineer with Schlumberger’s integrated production services group in Houston. He has eight years of industry experience, focused primarily on unconventional plays, including production and completion evaluations, integrated reservoir studies, refracturing, and refrac well candidate selection. He holds a B.S. in petroleum engineering from Texas A&M University.
For other great articles about exploration, drilling, completions and production, subscribe to The American Oil & Gas Reporter and bookmark www.aogr.com.