


Emerging Technology
Method Detects Proppant in Far Field
By Matt Czapski, Keith Lynch, Terry Palisch, Wadhah Al-Tailji, Lewis Bartel and Chad Cannan
HOUSTON–Maximizing production and hydrocarbon recovery in horizontal resource plays requires understanding which portions of the reservoir are adequately stimulated and contributing production, and which portions are not. The starting point for making these evaluations is accurately detecting the location of the proppant pumped during hydraulic fracturing treatments in both the near- and far-field areas of the reservoir.
In addition to traditional fracture mapping technologies, knowledge of near- and far-field proppant distribution is necessary to overcome single-digit ultimate recovery factors in low-permeability, unconventional plays. While near-wellbore detection can determine whether all perforation clusters received proppant and can assess the impact of proppant overflush, proppant detection depends on the depth of investigation of the logging tools. In most cases, that limits the radius of investigation to 18-24 inches from the wellbore.
Although far-field proppant detection techniques largely have been absent in the industry’s toolbox, the powerful insights that would come from understanding the propped fracture network profile outside the immediate borehole radius have led many to consider far-field proppant detection to be the elusive Holy Grail of fracture diagnostics. Accurately determining far-field proppant placement would impact everything from well and stage spacing to stage design and refracturing candidate selection, and would allow significant optimization of diversion techniques.
To enable these benefits, a novel far-field proppant detection technique has been developed that utilizes electromagnetic (EM) differencing and a specialty detectable proppant. The first field test was conducted in a horizontal Bone Spring well in the Permian Basin, and the preliminary results show the system successfully visualized proppant distribution in the far-field fracture network.
Energized Wellbore
The technology “electrically energizes” the wellbore prior to and after fracturing, using a specialty proppant that possesses EM characteristics sufficiently different from the subsurface medium surrounding it. During the energizing operation, EM responses are recorded by receivers located on the surface or in offset wells in a time (frequency-dependent) series of data collections. Electric current is carried to an energizing point in the wellbore by an insulated cable that contacts the well casing, allowing the casing to become a current line source producing subsurface EM fields (a grounding point on the surface completes a positive-to-negative electric circuit).
The EM fields interact with the fracture containing the specialty proppant to produce secondary electric (e) and magnetic (b) fields, which then are measured to characterize proppant-filled fractures. The EM proppant imaging technique is best described as a stepwise methodology that encompasses acquiring EM data before hydraulic fracturing, treating the well using EM-conductive proppant, processing the recorded data, and then constructing highly-resolved 3-D images of the “differenced” pre- and post-treatment EM wave field propagation/diffusion results using a finite-difference numerical algorithm.
The detection, location and characterization of the conducting proppant depends on several factors, including the net conductivity of the fracture (proppant), fracture volume, fracture height and length, and the conductivity of the surrounding earth. Conventional sand, resin-coated sand and ceramic proppants typically exhibit very poor EM properties, so an integral part of developing the far-field detection technique was designing a cost-effective proppant with high-EM contrast properties that could provide adequate fracture flow conductivity.
After significant material research, a ceramic proppant was developed that features an electrically conductive coating. This approach ensured both adequate flow conductivity and proppant strength, while avoiding the need to develop a completely new substrate. The primary research work centered on coating material selection and the optimal process for coating the ceramic proppant grains.
In addition to being electrically conductive, the coating had to be durable and maintain its adhesion to proppant grains throughout the fracturing process. The coating consists of a proprietary initial coating that promotes adhesion of the outer conductive layer to the low-density ceramic substrate.
The specialty proppant possesses current conductivity, electric permittivity, and magnetic permeability characteristics that can be enhanced in any combination to distinguish proppant from the surrounding geologic formation. The stronger the EM material property contrast between the proppant and subsurface medium, the stronger the scattered EM wavefield recorded in post-fracturing data acquisition.
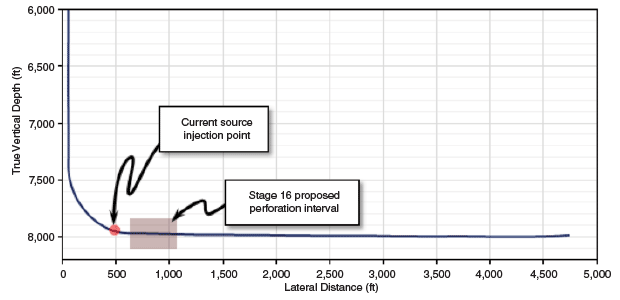
FIGURE 1
Candidate Well Profile with Perforation Interval
And Current Source Injection Point
Delaware Basin Field Test
The horizontal well selected for the field test targeted a Bone Spring sand interval at ±8,000 feet true vertical depth in the Delaware Basin. The completion plan called for multistage hydraulic fracturing using 16 plug-and-perf stages, with detectable 20/40-mesh proppant pumped in stage 16 (the final stage). It was hoped that placing detectable proppant in the last stage closest to the heel of the wellbore would allow the EM source tool to be placed as close as possible to perforations without requiring tractoring. Figure 1 shows the positioning of the current source injection point relative to the perforation interval for stage 16. Tool deployment was accomplished using a single-conductor e-line cable.
An earth model was constructed of the stratigraphic column using resistivity data from an electric open-hole log of a pilot hole in the area. Forward modeling of the resistivity profile from formation depth to surface was used to design the surface receiver array, including the optimum number and positioning of sensors. Each receiver station consisted of two horizontal electric field dipoles orthogonal to each other, with one of the dipoles oriented in the same direction as the wellbore’s longitudinal axis.
Based on a balance of availability, cost and forward modeling, a total of 20 receiver stations were designed. In addition to measuring e-field signals, the design team also was interested in capturing magnetic field signals, since a signal response in the b-field was predicted to be higher by one of the models. Therefore, two of the 20 stations also incorporated horizontal magnetic coil sensors (oriented orthogonally) to capture the b-field response.
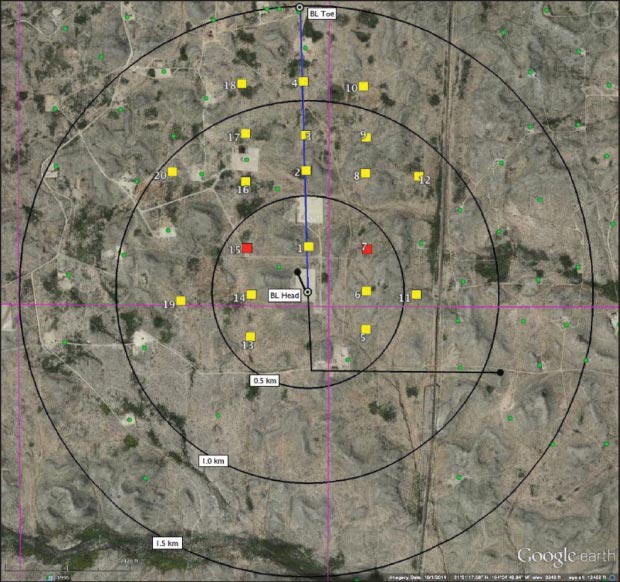
Figure 2 shows the sensor array design. The yellow squares indicate e-field dipole receiver stations, and red squares indicate a combination of e-field dipole pairs and b-field sensor pairs. Black dots are the location of negative return electrodes (grounding points) and green dots are offset wells (both active and inactive). The purple lines show section boundaries, while the blue line connects the surface well coordinates with total depth coordinates. The black “rings” represent 0.5-kilometer contour radii from the wellhead.
FIGURE 2
Sensor Array Design at Delaware Basin Well Site
EM Measurements
In an effort to maximize the current transmitted to the source tool, experiments were conducted with two grounding-point locations: one at the edge of the well pad, and the other one kilometer from the well site. EM noise impact on nearby sensor stations also was evaluated. The analysis predicted that more than 10 amps of current would be transmitted to the current source tool at depth, given expected e-line cable resistance.
Several additional transmission aspects were important, including the duration of the transmission, the transmission waveform/character, and the number (and timing) of the measurements taken. The final determination of each of these issues entailed balancing the technical merits with the associated time and cost, and eventually led to the final recommendation of four measurements (Figure 3).
FIGURE 3
Proposed EM Measurement Sequence and Timeline
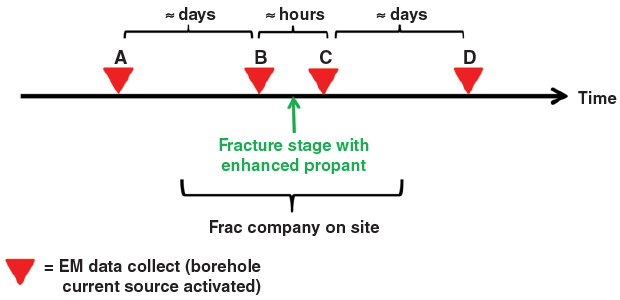
The first measurement (A) was to be performed after the geophysical company had deployed the receiver stations and transmission equipment, but before mobilizing any hydraulic fracturing equipment. Without the noise clutter caused by fracturing operations, this measurement potentially could be compared to the fourth measurement (D) to difference the detectable proppant.
Measurement B was designed to occur immediately prior to placing the detectable proppant in the stage 16 plug-and-perf operation and serve as the base-line response to be differenced from measurement C, which was to be performed immediately after completing stage 16. The response of measurement B would include any geophysical response generated by the plug-and-perf operations on the first 15 stages, as well as ambient noise generated from fracturing.
To minimize ambient noise, all unnecessary equipment was shut down and treating iron was disconnected during both measurements B and C. The goal was to ensure a similar ambient noise environment for both measurements and minimize noise effects on differenced signal processing, so that changes between the measurements would be attributable to the detectable proppant.
Measurement D would be obtained after the frac fleet left location to serve as a companion to measurement A for differencing the signal responses. Moreover, lab experiments suggested that the electrical conductivity of the detectable proppant would increase as stress on the proppant increased, leading to a stronger signal to surface.
Since the reservoir consisted of very low-permeability rock, the design team expected the fractures would remain open for several days. Accordingly, measurement D was planned for a time after the fractures had closed. In reality, however, fracture analysis during treatment indicated closure was occurring in less than one hour. This, along with the fact that the fracturing equipment would not be off location until after the successive stimulation of three more wells on the pad, led the team to change measurement D to occur only 14 hours after acquiring measurement C.
Operational Results
Stage 16 was designed to utilize 410,000 pounds of 20/40-mesh proppant, with the first 182,000 pounds consisting of uncoated white sand and the detectable proppant accounting for the remaining 228,000 pounds. The treatment went well, with no adverse effects seen on the fracture fluid system.
However, the conveyor belt “sanded off” with only about half of the detectable proppant pumped. The decision was made to flush the proppant to the perforations, fix the problem, and then attempt to place the rest of the detectable proppant. This was accomplished with all 228,000 pounds of detectable proppant placed. It was during this short shutdown in the middle of the stage that pressure decline analysis showed a much higher-than-anticipated formation leak-off rate and indicated fracture closure would happen in hours rather than days (shortening the time between measurements C and D).
From an operational viewpoint, the field test was remarkably successful. High current was transmitted into the bottom of the well while conducting the plug-and-perf fracturing treatment, and all operations were carried out in a safe and environmentally sound manner. Measurement A provided several positive results and observations. A cursory look at the signals being received by the receiver arrays indicated an e-field signal was being carried to surface, and the waveform was very similar to the input transmission. In addition, while the EM signals were extremely small, they matched the forward modeling expectations very well.
FIGURE 4
Locations of Perforation Clusters and Current Source
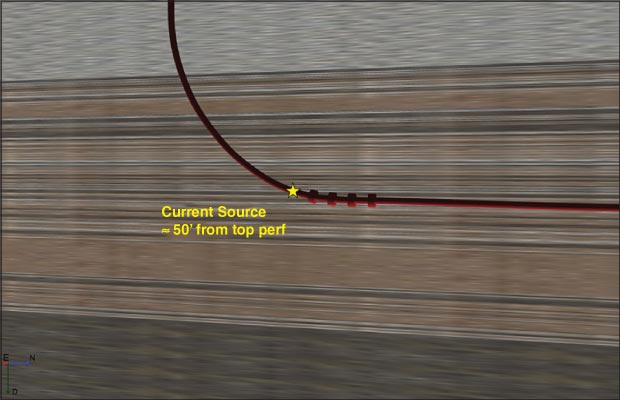
FIGURE 5
Offset View of Highest-Intensity EM Response
For Proppant Differenced Data (10-Meter Spacing)
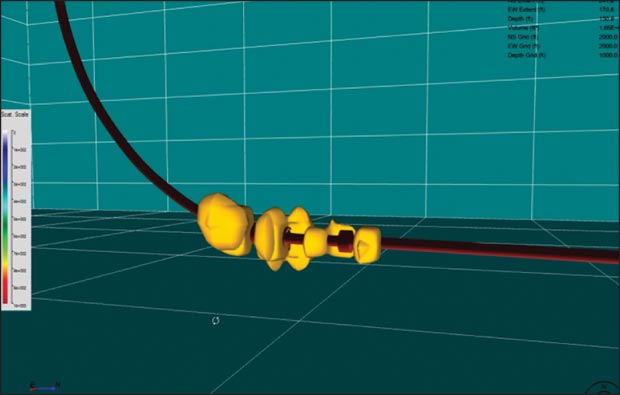
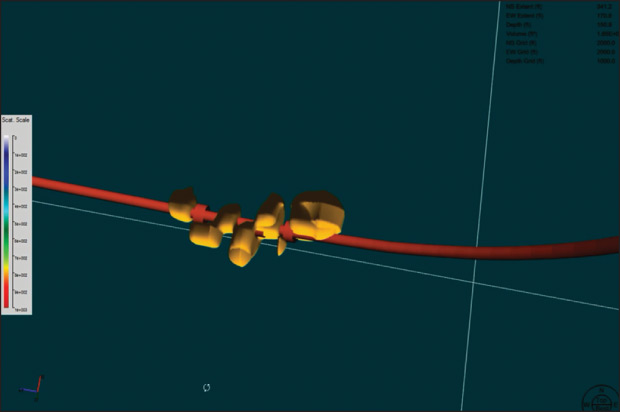
FIGURE 6
Overhead View of Highest-Intensity EM Response
For Proppant Differenced Data (10-Meter Spacing)
The final step was removing the noise, differencing the data, and inverting the results for visualization. While noise suppression processing continues to be worked, several preliminary inversions have been performed on the data from each receiver using basic filter techniques.
Most of the preliminary analysis and inversion work has been completed on the “C-minus-B” differenced data, representing the two measurements taken immediately before and after placing detectable proppant in stage 16. This inversion shows promising results. Using a cut-off representing the distinct change from background response to relatively high signal strength shows a symmetrical length, height and width of propped rock.
Preliminary Analysis
Figure 4 shows the location of the perforation clusters and the current source. The perforation clusters are 60 feet apart, with the current source located 50 feet up hole from the top set of perforations. Figure 5 is a slightly offset view of the outside of the highest-intensity EM response for the proppant differenced data on 10-meter grid blocks from the preliminary analysis, and Figure 6 is an overhead view of the same image (note that the original analysis was performed on 25-meter grid spacing, but has since been reprocessed on 10-meter spacing).
The maximum extent of the measurements is approximately 350 feet long (down the lateral), 150 feet high and 175 feet wide. If one was to sum the volume contained within the propped reservoir volume, it would yield approximately 2 million cubic feet. Of course, this likely is not the full extent of the propped volume, but only the measurable volume (i.e., above the noise level) with minimal denoising or signal processing enhancement techniques.
When viewing the two figures together, several observations can be made. First, proppant was detected both above and below the stages, with proppant found up hole from the top perforation cluster and down hole from the bottom perforation cluster.
Second, there appear to be two planar fractures that cut through the middle two perforation clusters. Also, in the area of the first (up hole) perforation cluster, detectable proppant was found on only one side of the wellbore.
Finally, it is worth reminding that the first »180,000 pounds of proppant pumped in the stage was not detectable (standard 20/40-mesh white sand), and there was a significant volume of clean fluid pumped in the middle of the detectible proppant portion of the treatment, so conclusions about the final overall geometry of the fractures must be made carefully.
The B-minus-A differenced dataset (stages containing only standard, non-electrically conductive proppant) showed no appreciable changes in the e-field, effectively eliminating the possibility that the C-minus-B response was a false-positive. Additionally, while the fracture probably was already primarily closed when measurement C was taken, a quick look at the D measurement suggests that the electrical conductivity of the detectable proppant was marginally stronger during the final measurement, in line with laboratory experiments that suggested signal strength would increase with stress on the proppant.
As additional development work and field testing continue to refine and prove the far-field proppant location method using EM differencing with detectable proppant, the promising results of the initial application in the Permian Basin demonstrate the technology’s potential to revolutionize the effectiveness of fracture treatment designs and optimize field development efforts in the future.
Editor’s Note: For more comprehensive information on the far-field proppant detection method or the Permian Basin field test, see SPE 179161, a technical paper presented at the Society of Petroleum Engineers 2016 Hydraulic Fracturing Technology Conference, held Feb. 9-11 in The Woodlands, Tx.
MATT CZAPSKI is a senior completion engineer at ConocoPhillips, responsible for completion design and development strategies for stacked pay targets in the Delaware Basin. He joined ConocoPhillips as a completion engineer in 2011, after starting his career as a field engineer at Frac Tech Services. Czapski holds a B.S. in engineering from Texas A&M University.
KEITH LYNCH is global completion chief at ConocoPhillips in Houston. With more than three decades of oil and gas industry experience, Lynch joined the company in 2002 after serving 17 years at ARCO Oil & Gas Company, including as an engineer and drilling and completion adviser. He holds a B.S. in petroleum engineering from the University of Wyoming.
TERRY PALISCH is director of petroleum engineering at CARBO Ceramics Inc., where he has served since 2004. He began his career in production and petroleum engineering positions at ARCO Oil & Gas. Palisch holds a B.S. in petroleum engineering from the University of Missouri-Rolla.
WADHAH AL-TAILJI is technical manager at StrataGen. He joined the company as a staff engineer in 2010 and served as senior reservoir and completion leader for the Eagle Ford Shale before assuming his current assignment. Al-Tailji previously served at BJ Services and Caltrans. He holds a B.S. and an M.S. in petroleum engineering from New Mexico Institute of Mining & Technology.
LEWIS BARTEL is a consultant to Carbo Ceramics. After beginning his career as an assistant professor of physics at Colorado State University, he served for 44 years at Sandia National Laboratories. At Sandia, Bartel led research efforts related to solid-state physics and geophysics, including electromagnetic methods and developing reverse-time migration methodology. He holds a B.S. in engineering physics from the University of Kansas and a Ph.D. in physics from Iowa State University.
CHAD CANNAN is vice president of research and development at CARBO Ceramics. He joined the company in 1999 and has held a number of positions, including technical services/development engineer, project manager, director of global engineering, and director of international operations. Prior to joining CARBO, Cannan was an officer in the U.S. Air Force.
For other great articles about exploration, drilling, completions and production, subscribe to The American Oil & Gas Reporter and bookmark www.aogr.com.