


Method Generates High-Resolution Shale Play Models
By Mark C. Robinson and Lisa E. Remington
AUSTIN, TX.–All geoscientists operate with a paradigm or working hypothesis on the nature of the subsurface in their project areas. Having a working model is imperative for predicting the nature and presence of oil and gas reservoirs. The concept of this stratigraphic framework would allow professionals to incorporate it into their own interpretations and use it to further apply their understanding of where to drill or how best to exploit oil and gas reserves.
This model potentially would include virtually all oil and gas basins in North America, and allow users to focus on unconventional resource plays such as the Eagle Ford Shale in South Texas, the Bakken Shale in the Williston Basin, the Niobrara in the Denver-Julesburg Basin, the Wolfberry/Wolfbone play in the Permian Basin, or the Barnett Shale in the Fort Worth Basin.
A new approach has been developed to use interpreted, digitized well log data and sequence stratigraphy to build high-resolution subsurface models. The high-density interpretations are generated from the well log data according to allostratigraphic methodology.
Allostratigraphy is a methodology defined by the North American Stratigraphic Code that uses bounding discontinuities to subdivide the sedimentary section into mappable units. Bounding discontinuities include unconformities, disconformities, discontinuities and omission surfaces. The bounding surfaces may relate back to sequence stratigraphic boundaries, such as marine flooding surfaces.
It is important in high-resolution subsurface modeling to understand the difference between allostratigraphy and lithostratigraphy. Lithostratigraphy maps sedimentary rocks solely on the basis of their lithology, and does not necessarily consider that these rocks may have accumulated over different periods (diachronous lithostratigraphic units). Lithostratigraphy often ignores significant breaks in the sedimentary section, including those caused by unconformities, omission surfaces, ravinement surfaces and flooding surfaces.
Allostratigraphy maps rock units on the basis of the timing of their accumulation. Allostratigraphy (sequence stratigraphy) uses a framework based on surfaces of erosion and nondeposition (sequence boundaries), and flooding (transgressive surfaces and/or maximum flooding surfaces) that can be recognized in 2-D and 3-D seismic, well log data and outcrops.
FIGURE 1
Lithostratigraphic (Top) versus
Allostratigraphic (Bottom) Interpretation
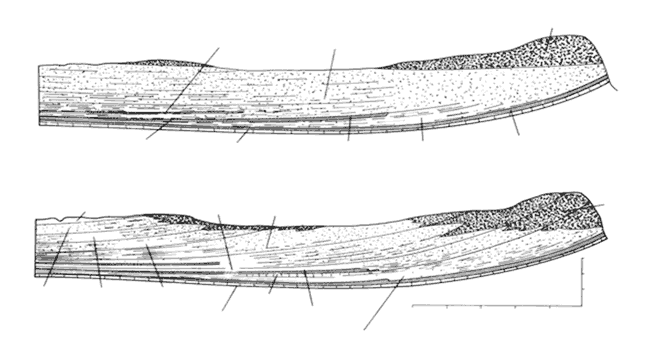
More Accurate Interpretation
Figure 1 shows the stratigraphic interpretation that results from a conventional lithostratigraphic approach (top) in comparison with an allostratigraphic interpretation approach (bottom). Although the subsurface rocks are the same, the allostratigraphic interpretation more truly represents the genetic significance, timing and relationships among the various depositional units.
In developing an allostratigraphic interpretation, it is necessary to define a set of allomembers to be used as stratigraphic surfaces. The types of data that can be useful in the allomember definition process may include:
- Well logs;
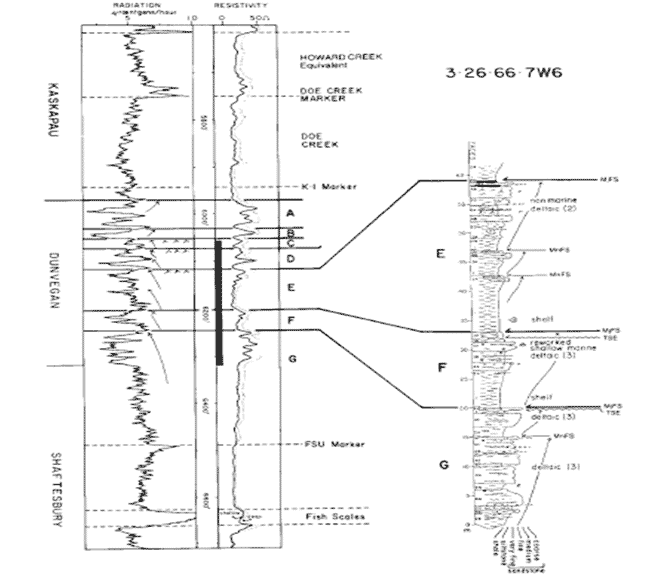
FIGURE 2
Well Log Curves Used to Define Allomembers and Their Sequence Stratigraphic Significance
- Core descriptions;
- Outcrop analysis;
- Paleontology;
- Sample logs/cuttings;
- Geochemistry; and
- Petrophysics.
Ideally, allomembers should be regionally correlative and have genetic significance.
Figure 2 illustrates how allomembers are defined from regionally correlative log responses and how they can be tied to a sequence stratigraphic framework. In this case, detailed core analysis was used to provide the necessary geologic facies information required to confidently assign the allomembers to the appropriate system tracts.
FIGURE 3
Traditional Well Log Display of Four Wells
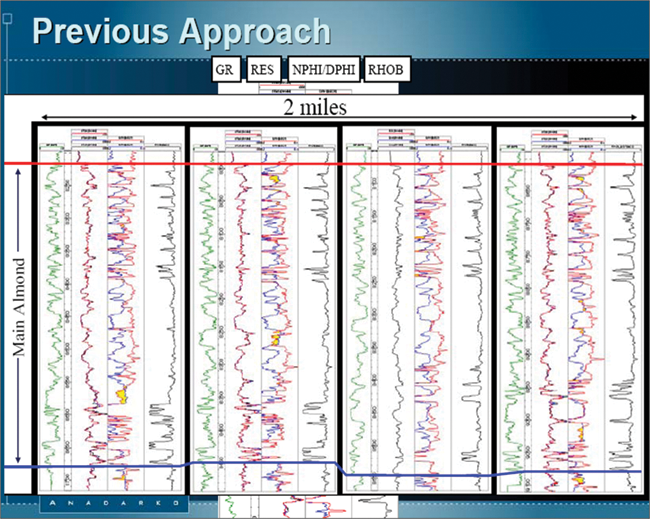
High-Density Interpretation
Traditional well log displays, as shown in Figure 3, have been used for years by geologists as a means to correlate subsurface depositional units. This method is still in use today by a large majority of working geologists. Although it is now more common to see scanned well logs being manipulated on a computer screen rather than the shuffling of paper logs on a drafting table, the process between the two is essentially the same. The high-density well log display is a relatively new and patented method that facilitates visualizing stratigraphic relationships present in the well logs.
FIGURE 4
High-Density Cross Section
(Lower Wilcox, Webb County, Tx.)
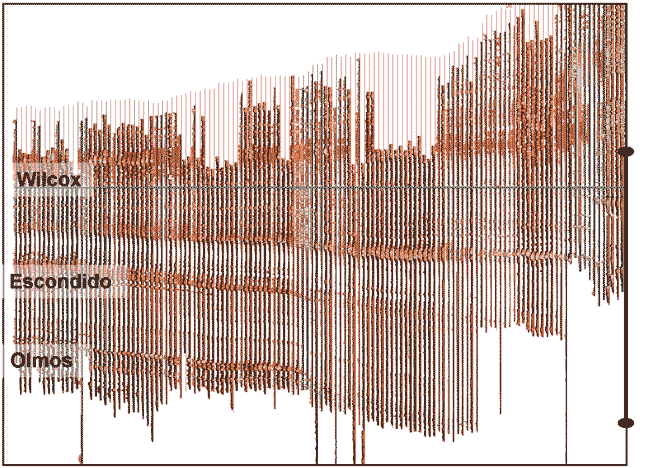
The high-density well log display in Figure 4 is composed of gamma ray, spontaneous potential and deep resistivity logs. In this case, the display shows a high-density cross section of the Lower Wilcox formation from Webb County, Tx. The wells are equally spaced over a distance of 65 miles. Facies shading has been applied to the gamma ray and spontaneous potential curves to emphasize the presence of sand. Many regionally significant depositional patterns can be discerned easily in this display. It would be virtually impossible to use paper or scanned well logs to create this kind of cross-sectional display, let alone try to visualize the stratigraphic relationships.
By carefully correlating key allostratigraphic surfaces in a basin and understanding their relationships to identified sequence boundaries, the sequence stratigraphic model for a basin can be developed. Major first- and second-order sequence boundaries frequently correspond to major flooding surfaces, unconformities and named formation boundaries. The third- and fourth-order sequence boundaries are mapped where they can be identified in well logs.
FIGURE 5
Example of Framework Correlations
Matching Interpreted Seismic Data
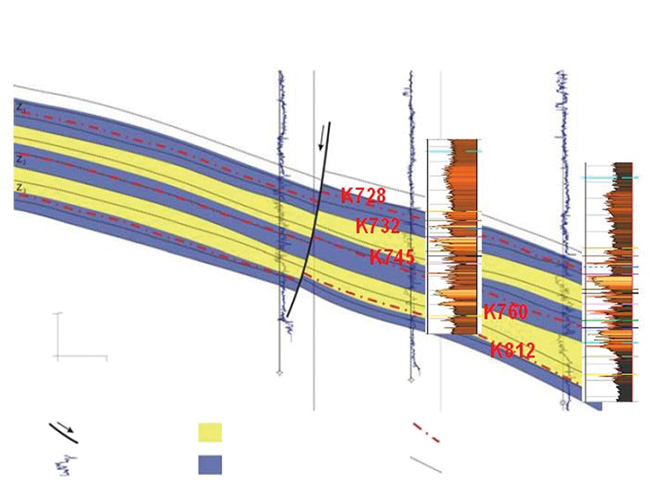
Figure 5 details how these framework interpretations generate regionally significant correlations over a large area that can be integrated with seismic data or used independently to understand local geology in a regional context, as well as to easily visualize productive facies, their lateral extent, and potentially identify analogs.
Structure Maps
Based on the interpreted results of thousands of well logs, it is possible to create highly accurate and very detailed structure maps of the subsurface. Because these basinwide correlations focus on flooding surfaces and sequence boundaries, the structure maps can tie back to 3-D and 2-D seismic data and be used to better control the time/depth relationships.
Structure maps are generated for each correlated surface in a basin or trend. Many areas potentially could have 10 to 20 structure maps detailing the unique characteristics associated with each depositional layer. Because of the correlation methods and data density, the presence of even relatively minor faults frequently can be seen by their effect on the structure maps.
However, perhaps the most remarkable and valuable derivation from these basinwide correlations are the gross isopach maps of the intervals between the interpreted surfaces. Gross isopach maps can be extremely valuable tools in defining the paleo-structure in a basin. They have the ability to identify a thicker region that may indicate a zone of subsidence, allowing for greater accumulation of sediments. This ability is largely a function of the large-scale correlations representing sequence boundaries, and therefore, is more likely to capture the significant depositional packages.
Taking the vertical difference between two adjacent surfaces in each interpreted well creates the gross interval isopach maps. Gross isopach maps then are created for each interval of the interpretation. Additionally, isopachs are created by multiple intervals. These combined isopachs are necessary to visualize larger deposition systems.
Because this stratigraphic framework is dynamic and is derived from interpreting an ongoing and ever-increasing collection of digitized well logs, it becomes immediately possible to calculate and map petrophysical properties for each interpreted interval.
Common well log derived property maps such as feet of gamma ray above or below a certain cutoff point provides insight into the distribution of a sand, limestone or organic shale in a basin. The value of this information is even greater when interpreters can flip through a series of layers and observe how the depositional thickness may migrate over time.
More advanced petrophysical properties, or even geochemical measurements, can be associated with an interpreted framework interval. The trend of these properties can be mapped and followed through each succeeding depositional sequence.
Integrating Production Data
The ability to match interval data with well completion and production information is an important aspect of any interpretation. Ideally, all well completions would be matched to known production intervals and reservoir boundaries that are consistent throughout the entire basin or trend.
With the ability to match completions to a consistent set of intervals, it becomes possible to relate the interpreted framework-derived property maps to known production trends. This functionality, in turn, is extremely useful in generating “opportunity maps” for each potentially productive interval.
FIGURE 6
Framework Interpretation Integrated with
Published Production Data from the Haynesville/Bossier Zones
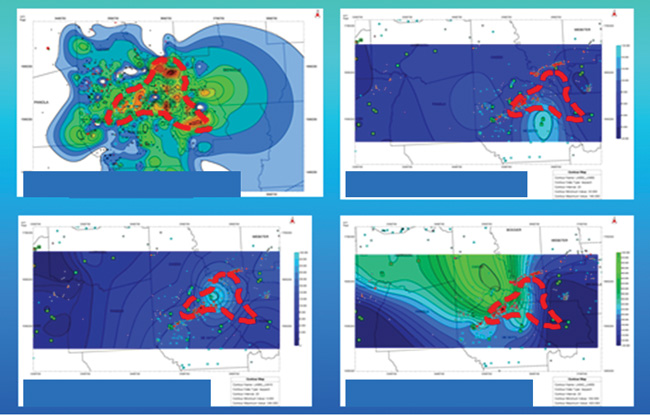
Figure 6 provides an example of the types of visualizations that can be created using data and information from the framework interpretation. This figure combines data derived from integrating framework interpretation and published production data from the Haynesville/Bossier zones in East Texas and northern Louisiana. Peak production is mapped and defined by the area in red, which is superimposed over a series of gross isopach maps of the Lower and Upper Haynesville, and Lower Bossier zones.
A comprehensive geological model for each of the primary oil and gas basins and trends can be created by applying a patented process that utilizes high-density digital well log displays. This framework interpretation potentially can generate a large and expanding array of reservoir characterization tools, including structure maps, isopach maps, various petrophysical property maps and high-density well log displays.
Integrated with available production and completion data, the concept of a nationwide stratigraphic interpreted framework would provide an invaluable tool for identifying and validating opportunity trends, and would lead to a better understanding of the relationship between geology and known production.

MARK C. ROBINSON is director of geological and geophysical products for DrillingInfo Inc. in Austin, Tx. He began his career with Unocal in 1982 and subsequently served at Oxy, Pennzoil and Schlumberger in California, Texas and various international locations. Over the past 10 years, Robinson has developed high-density digital well log interpretation methods for defining sequence stratigraphic models of oil and gas producing basins. He holds a B.S. and an M.S. in geology from the University of California, Los Angeles, and the University of Texas-Permian Basin, and has continued his studies at the University of Houston.

LISA E. REMINGTON is a geologist at DrillingInfo Inc., developing detailed sequence stratigraphic studies throughout North America. She joined DrillingInfo as a research analyst for the energy strategies partners group in January 2009. She previously worked as a processing geophysicist for Digicon Inc., and served 15 years in several capacities before working for several years at the Bureau of Economic Geology at the University of Texas at Austin. Her experience includes working as a research scientist associate and public information geologist, database manager for the Bureau of Economic Geology’s international energy programs, database coordinator within the IT department, and as a database coordinator for the administrative department. Remington holds a B.A. in geology from the University of Texas at Austin.
For other great articles about exploration, drilling, completions and production, subscribe to The American Oil & Gas Reporter and bookmark www.aogr.com.