


Microproppants Boost Frac Efficiency
By Carl T. Montgomery and William E. Strobel
TULSA–It is commonly acknowledged within the industry that the stress cage or hoop stress left around a horizontal well after it is drilled can cause severe complexity in the geometry of hydraulic fractures created during subsequent stimulation operations. If the intent is to create a transverse fracture, then the fracture will reorient normal to the wellbore, which will cause a chokepoint or kink to form as the fracture reorients.
The severity of this “kink” is a function of the delta between the two horizontal stresses, and is called tortuosity. It can cause severe placement problems associated with excess treating pressures and near wellbore premature screen-outs. In addition, if the kink persists, it can limit the production of the well because of low near-wellbore fracture conductivity and a convergent flow excess pressure drop.
The general paradigm for the design of hydraulic fractures is to underflush the treatment to ensure that proppant is left in the near-wellbore fracture to prevent the fracture from pinching off and restricting flow. Many slot flow studies have been completed that show the forming of a “dune” when a low-viscosity frac fluid is used to place proppant. A dune has a large void area near the wellbore, where the velocity of the fluid exiting the perforation is high enough to sweep the proppant away from the near-wellbore region.
Recent downhole video photos show that when fracturing treatments were intentionally overflushed, the fractures were wide open even though no proppant was seen. The current theory is that the strong force of proppant erosion during the treatment etched enough rock material from the fracture face to prevent it from sealing back up after fracture closure. The shale revolution has delivered hundreds of thousands of wells using the overflushing technique and post-production data shows that overflushed wells are linked to stronger well performance.
Microproppant Case Study
A major operator recently completed a test to determine whether a ceramic microproppant would improve the completion efficiency of the company’s frac treatments. The study consisted of a four-well study in which 18 of a total of 87 stages in two wells were treated with the microproppant. One of the microproppant wells used a 10 clusters-per-stage perforation design, where each cluster received three 0.42-inch entry hole diameter, 25-gram charges for a total of 30 perforations and treated with 420,000 pounds of 100-mesh sand. In addition to the 100-mesh sand, nine of the stages in this well included 10,604 pounds of microproppant pumped at concentrations of 0.25 and 0.50 pounds/gallon in the pad.
The second microproppant well used 14-clusters per stage with the same perforation design and was treated with 588,000 lbs of 100-mesh sand. The stages that included the microproppant were treated with 14,750 lbs of microproppant pumped at concentrations of 0.25 and 0.5 lbs/gal in the pad. After cleanup, an ultrasonic imaging tool was run to evaluate which stages had a more consistent perforation uniformity.
FIGURE 1
Stages 12 and 13 of the 10-Cluster Design
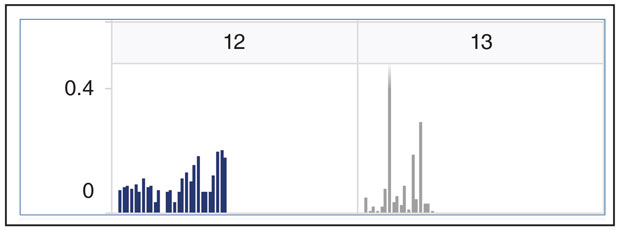
Figure 1 shows the results for two adjacent stages (stages 12 and 13). The vertical axis represents the eroded area of the perforation. The initial perforation size was 0.42 inch, which is the “0” point on the vertical axis. The “0.4” point on the vertical axis represents an eroded area of 0.4 square inch above the baseline of 0.42 inch. Stage 12 is a microproppant stage and each vertical blue line represents one perforation. This stage was a 10-cluster design with three perforations for each cluster, for a total of 30 perforations. If one counts the blue lines, 28 of the 30 perforations (or 98%) received proppant. On stage 13, which was also perforated with 30 perforations, 17 of the 30 perforations (57%) received proppant. Stage 13 also shows that perforation No. 7 was a “runaway” perforation that took a large portion of the total treatment.
FIGURE 2
Statistical Analysis of Proppant Placement Effectiveness (Microproppant versus Non-Microproppant Stages)
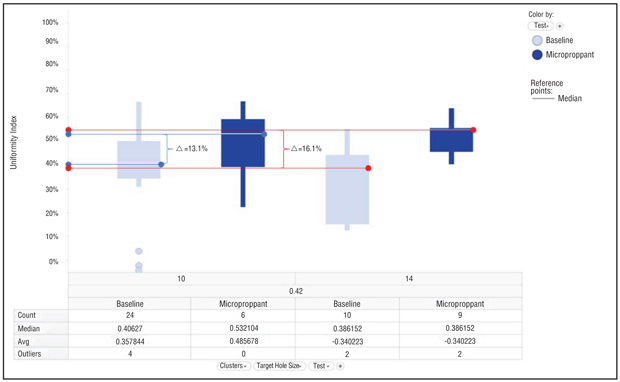
Figure 2 shows a statical analysis composite of all the stages. The light blue boxes represent the nonmicroproppant baseline stages while the dark blue boxes represent the microproppant stages. The white line running through the boxes is the median value for all of the tests. The results indicate that the median value for the number of perforations that received proppant increased by 13.1% in the 10-cluster well and 16.1% in the 14-cluster well. In general, the completion efficiency of the stages treated with the ceramic microproppant was increased by 15% to an overall competition effectiveness of 54%.
Perforation Erosion
The expected impingement velocity of proppant entering the fracture is in the range of 50-90 mph. Using the 10-cluster case and the pump rate shown in Figure 3 (10 clusters, three perforations/cluster, 48% efficiency, 60 bpm = 4 bpm/perf = 7,000 feet/second), the particle velocity as it exits the perforation is about 80 mph. The ability of proppant to increase perforation hole size by eroding steel is well known. In the case of microproppant, it is believed that the microproppant probably does not affect the perforation geometry, but because it abrades the near-wellbore rock, it improves the distribution of the following frac treatment. In this case, the 100-mesh in the following stages abraded the perforation.
The mass of microproppant and sand is close (2.5 grams/cubic centimeter versus 2.65 gm/cm3) but the microproppant is so small (0.032 millimeters) compared with even 100-mesh sand (0.149 mm) that the momentum of the microproppant particle as it turns the corner through the perforation is not sufficient to impact the edge of the perforation. The difference in momentum between the microproppant particle and 100-mesh particle at 80 mph is a factor of about 100.
The inertial forces placed on the microproppant as it turns the corner are focused against the cement and rock in the first few feet of the near-wellbore area before the velocity of the fluid stream drops to the much lower velocity that the fluid stream experiences in the fracture. The distance or geometry of this eroded channel is not known, but it is likely to be on the order of a few feet, and since it is an open channel, it will have infinite conductivity.
FIGURE 3
Stage 12 Treating Plot Showing Microproppant-Induced Pressure Reduction
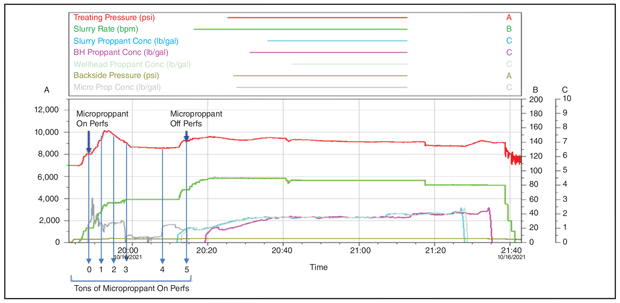
Figure 3 shows a treating plot from Stage 12 of the 10-cluster design in which 10,604 lbs of microproppant were pumped. The gray line denotes the bottom-hole concentration of microproppant, the red line is the surface treating pressure, the green line is the pump rate. If the pump rate is held constant, a decrease in treating pressure is an indication that any near-wellbore restriction is being removed. It appears that most of the pressure reduction caused by the microproppant occurs very quickly. It is difficult to determine the initial response because the pump rate is being increased, but after about eight minutes, the rate is held constant and the effect of the microproppant can be seen clearly. After 6,000 lbs of microproppant, no additional pressure improvement can be seen.
There are several benefits from a reduction in treating pressure. In addition to opening more perforations and eroding or abrading out any near-wellbore rock, the reduction in pressure allows the pump rate to be increased. If the pump rate is increased, then there is less time for the treating fluid to leak off, which improves fluid efficiency. This means that the treatment will contact more rock with the same amount of fluid, which again will improve treatment effectiveness. If the pump rate is not increased, then the lower treating pressure will result in a lower horsepower requirement, translating to treatment cost savings.
FIGURE 4
Comparison of Two Micropropped Wells versus Two Adjacent Wells without Microproppant
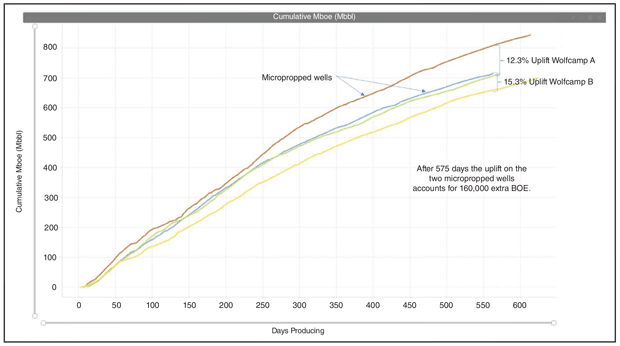
There are several examples of the dramatic production improvement provided by using a microproppant. Figure 4 is from a recent test in the Delaware Basin’s Wolfcamp formation in West Texas. At an oil price of only $50 a barrel, the extra value provided by the microproppant is $8 million.
In addition to the dramatic improvement in production, enhanced completion effectiveness represents an increase in capital efficiency. For example, the average capital expense for a 40-stage hydraulically fractured horizontal well in the United States is $6 million-$8 million. A completion efficiency of 40% represents a $900,000-$3.2 million overcapitalization cost. In addition to improving the effectiveness of the treatment, a 15% improvement in completion efficiency achieved by using microproppant represents a $900,000-$1.2 million improvement in capital efficiency.

CARL T. MONTGOMERY is a senior engineer at Tulsa-based NSI Technologies LLC. As a pioneer in completion techniques for unconventional wells, Montgomery specializes in all areas of stimulation, cementing, sand management, conformance control, perforating and formation damage. A former Society of Petroleum Engineers’ distinguished lecturer, Montgomery has been recognized with the SPE Engineer of the Year Award for drilling and completions, the ConocoPhillips Lifetime Achievement Award, and membership in the Legends of Hydraulic Fracturing group. He holds a B.S. in biochemistry from Colorado State University and an M.S. in biochemistry from Ball State University.

WILLIAM E. STROBEL is president of Zeeospheres Ceramics LLC in Lockport, La., which manufactures microproppant. He has served as chief executive officer or president of several technology and public companies, including a Fortune 500 company. During his career, Strobel has identified, negotiated and integrated six acquisitions. He has substantial experience in finance, manufacturing, sales, marketing, product development and business planning. Strobel holds a B.B.A. from the University of Texas at Austin and an MBA from California State University at Fullerton, and he is a graduate of the Executive Development Program at Wharton School of Business.
For other great articles about exploration, drilling, completions and production, subscribe to The American Oil & Gas Reporter and bookmark www.aogr.com.