


Marcellus/Utica Activity
Perforating Approach Optimizes Proppant Distribution, Improves Well Performance
By Matt Fry and Adam Altieri
CANONSBURG, PA.–Reduced stage spacing has been demonstrated to improve well performance, but it also adds additional stages to a well, thereby increasing completion cost. The mechanics of why reduced stage spacing improves well performance are unclear, but observations from distributed acoustic sensing may shed light on one potential mechanism: a tendency for heel-ward bias in the treatment of a stage, where dominant clusters in the heel of a stage take the majority of the treatment, independent of the number of perforation clusters or cluster spacing.
FIGURE 1A
Decreasing Period of Sine Wave
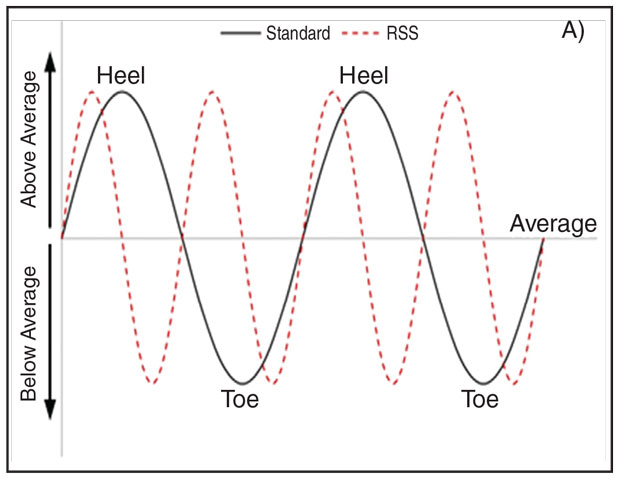
FIGURE 1B
Decreasing Amplitude of Sine Wave
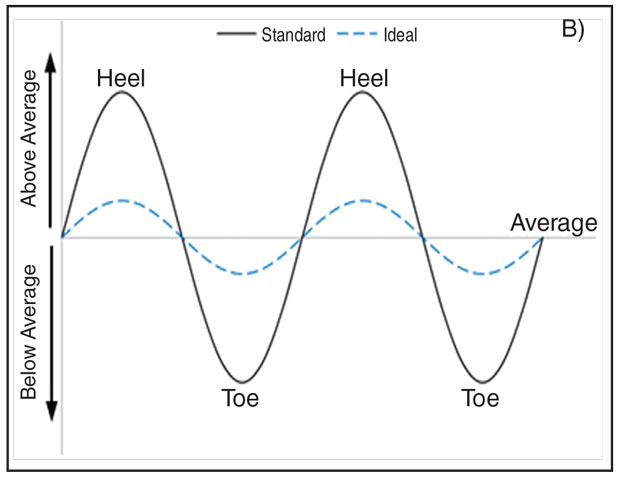
This results in proppant distribution along the length of a well mimicking a sine wave, where higher sand loading is associated with the dominant clusters in the stage’s heel, and lower corresponding to the understimulated toe clusters. Reduced stage spacing increases the uniformity of proppant distribution along the length of a lateral by effectively decreasing the period of the sine wave, thereby compressing the over- and understimulated intervals (Figure 1A). However, a more straightforward way of distributing proppant uniformly is to decrease the amplitude of the sine wave (Figure 1B).
Rockdale Marcellus LLC conducted a study to demonstrate how a perforating scheme using variable shot cluster (VSC) and limited entry (LE) techniques can accomplish this by mitigating heel-ward bias in an attempt to provide the same production uplift as reduced stage spacing. The study’s objective was to generate more uniform fracture half-lengths by preventing uncontrolled half-length growth associated with dominant heel-ward clusters taking the majority of the treatment, thereby ensuring that all perforations were treated and achieved uniform proppant distribution.
Effective Flow Area
A downhole camera was utilized on multiple wells to inspect perforations for evidence of erosion and perform a semi-quantitative ranking of the amount of proppant passing through each perforation. Multiple VSC perforating schemes were observed to help ascertain which variables controlled the distribution of proppant along the length of a stage. Results demonstrate that effective flow area (EFA) is the controlling factor determining which perforations accept fluid and proppant.
In nearly all stages, perforation efficiency is 100% until such a point is reached where perforations no longer accept significant volumes of proppant. Limiting the number of perforations to the treatable EFA is required to ensure all perforations in a stage are treated, and an arithmetic model is constructed for calculating an appropriate VSC perforating scheme to promote uniform proppant distribution among each cluster.
A cost-effective and tangible method is presented to evaluate uniformity of proppant distribution. Uniform cluster treatment and proppant distribution potentially may replace less direct and costly practices such as RSS and diverters for improving well production, and offers the added benefit of potentially limiting outsized fracture half-length growth associated with dominant clusters. This study was performed in the Marcellus Shale, but generally applies to all unconventional plays that utilize plug-and-perf slickwater hydraulic fracturing treatments.
The LE technique restricts the number of perforations while utilizing a sufficient injection rate to restrict perforation capacity, thereby diverting treatment to a greater portion of the perforated interval. Although developed for conventional wells to compensate for variations in bottom-hole fracture pressure, the concept applies equally to an unconventional stage where heel clusters preferentially take treatment to the detriment of toe clusters. VSC builds on the concept of LE by restricting fluid flow even further, utilizing fewer perforations in zones that preferentially take treatment (heel clusters) and more perforations in the understimulated toe clusters.
TABLE 1
Perforating Schemes Tested
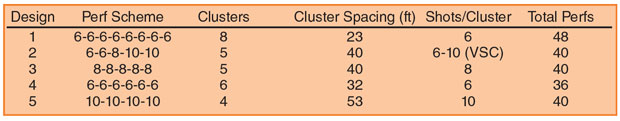
The downhole camera was used to inspect perforations for visible signs of erosion associated with slurry exiting the perforation. A semiquantitative ranking scheme was established to characterize the amount of erosion and place each perforation in one of three categories: major erosion, minor erosion or no erosion. Five perforating schemes were tested–four geometric shot cluster (GSC) schemes (where an equal number of perforations was used in each cluster) and one VSC scheme–with variations in the number of clusters, cluster spacing, perforations per cluster and perforations per stage (Table 1). All stages used 0.43-inch entry-hole diameter perforations, 200-foot stage lengths, and 15% 100-mesh and 85% 40/70-mesh proppant.
24-Stage Well Results
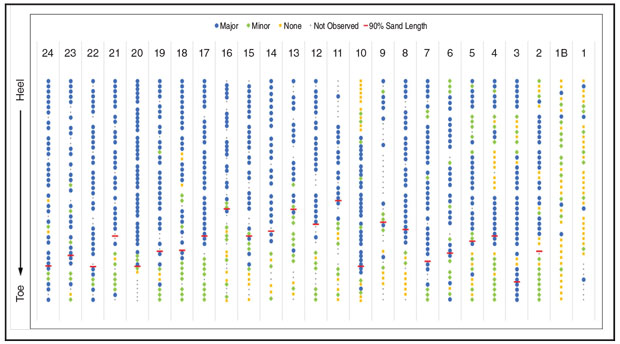
Figure 2 shows the results of all 24 stages in one Marcellus well. Consistent heel-ward bias is seen in nearly all stages, independent of the perforating scheme, number of clusters or cluster spacing. It also is evident that the toe cluster(s) were not treated effectively, as evidenced by the absence (or limited amount) of perforation erosion in the toe cluster(s).
FIGURE 2
Semiquantitative Ranking of Perforation Erosion
(Heel Stages at Top; Toe Stages at Bottom)
In order to create a quantitative metric to compare the impact of the perforating scheme used in each stage, the following assumptions were made regarding proppant volumes exiting each category of perforation: Major erosion perforations accepted both 100- and 40/70-mesh sand, minor erosion perforations accepted only 100-mesh, and no erosion perforations accepted no sand. Applying these assumptions consistently made it possible to develop a representative metric for comparing the stimulated portion of each stage: the 90% sand length.
The 90% sand length was calculated by summing the cumulative volume of sand each perforation accepted (total respective proppant volume divided by number of perforations accepting each respective mesh size) until 90% of the total volume of proppant pumped in each stage was reached. Then the distance of the coinciding perforation from the heel-most perforation was determined based on the perforating scheme, resulting in a length figure. Based on this metric, the perforating scheme utilized had no impact. Even though the stage lengths were all 200 feet (plug to plug), the top and bottom perforations both were offset 20 feet from the respective plugs, so the maximum achievable length was 160 feet.
Geochemical water tracers also were employed. In general, no correlation was seen between the stimulated interval of each stage as defined via the 90% sand length and the relative volume of tracer recovered, with one notable exception: stage 10, one of the few exceptions to the persistent heel-ward bias seen throughout all stages and perforating schemes.
In addition, the 90% sand length for stage 11 was the lowest recorded in any of the 24 stages. The heel of stage 10 and the toe of stage 11 seem to represent a contiguous understimulated interval in the well, and the relative tracer contributions returned from these stages is small when compared with stages 9 and 12 above and below. We have no explanation for this, other than the tracer results seem to corroborate that something out of the ordinary occurred in stages 10 and 11.
Controlling Factor
In order to determine the influence of geomechanical properties on perforation erosion, the stratigraphic position of each perforation was output from the geosteering interpretation of the lateral. The results show that for a given stratigraphic position, all possible categories of perforation erosion occur. Since geomechanical properties are primarily a function of stratigraphic position, the geomechanical properties associated with the position of a given perforation appear to have no impact on the amount of proppant that perforation accepts.
FIGURE 3
Number of Stages with Given Number of Major Erosion Perforations
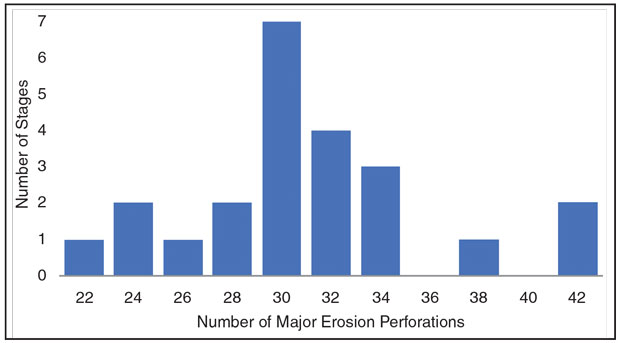
However, one factor controlling proppant distribution that stands out is EFA, or the combined area of all perforations. Figure 3 shows a relatively normal distribution with respect to the number of major erosion perforations seen in each stage. We suspect that this is not a product of the number of perforations, but simply a function of the EFA. Other factors may impact this result as well, such as formation properties, casing string diameter (5.5-inch in this example), treating rate, and more. But the near-normal distribution inspires confidence that, for this specific set of parameters, we can treat 30 perforations effectively. We have not attempted to repeat this evaluation for a different set of conditions, but have no reason to suspect that a similar approach cannot be repeated elsewhere (albeit, with a potentially different resulting EFA).
After addressing the number of perforations that can be treated effectively, the next step is to determine how to distribute those perforations in a stage to promote uniform proppant distribution. This requires a VSC scheme and a conceptual model to guide its design. The granularity of the semiquantitative ranking of perforation erosion obscured an observation that was made during the ranking process: Major erosion perforations in cluster 1 (heel-most cluster) are always more eroded than major erosion perforations in cluster 2, which in turn, are more eroded than major erosion perforations in cluster 3, and so forth. Based on visual observations, it appears that perforation erosion (hence, the volume of proppant exiting each perforation) tapers gradually at first, then rolls over toward the stage’s toe.
A quadratic conceptual model of proppant distribution was used to generate three VSC perforating schemes using four, six, or eight clusters. The conceptual model assumes the heel-most perforation takes the most sand, and proppant volume decreases to zero at the 30th perforation. In calculating the appropriate designs, the area under the curve was integrated and divided by the desired number of clusters. Then, the number of perforations per cluster was iterated to achieve as close to an equal area as possible, equivalent to equal distribution of proppant per cluster.
FIGURE 4
Simulated Proppant Distribution using GSC and VSC Perforating
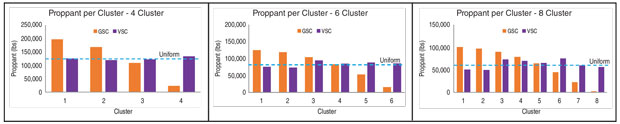
Based on this conceptual model, the impact of using a VSC perforating scheme as opposed to a GSC perforating scheme for four-, six-, and eight-cluster stages with 500,000 pounds of proppant is shown in Figure 4. Heel-ward bias is prevalent in the modeled GSC perforating schemes, and the toe cluster(s) are understimulated. As modeled, the VSC perforating scheme mitigates heel-ward bias and promotes effective treatment of the toe cluster(s). Even with VSC, the results are not perfectly uniform, but proppant distribution is still much more uniform with the use of VSC than simulated in the GSC designs.
Modified Perforating Scheme
Building on the previous results, the perforating scheme was modified in a subsequent Marcellus well and the camera evaluation of perforation erosion was repeated. Although prior results indicated that only 30 perforations could be treated effectively, there were concerns that decreasing the number of perforations too dramatically would result in being rate-limited (pressuring out before achieving the desired treating rate of 100-110 bbl/minute). Consequently, an incremental step was taken to utilize a five-cluster, 34-perforation, 3-4-6-10-11 VSC perforating scheme.
The semiquantitative ranking was repeated, and the toe clusters in all observed stages (four total) contained major erosion perforations. In addition, the 90% sand length was calculated as before and increased from an average of 125 feet in the previous evaluation to 160 feet (i.e., the entire stage). No issues were experienced in regard to being rate-limited with 34 perforations.
The camera analysis has not been repeated, but Rockdale continued to get more aggressive with LE designs on subsequent wells, utilizing as few as 27 perforations (where we were rate-limited). Based on our observations, it is possible to be more aggressive in the LE design in the heel of the lateral than in the toe, where measured depth elevates pipe friction. We are having success breaking the lateral into thirds and utilizing different VSC designs for each segment consisting of 34 perforations in the toe third of the lateral, 30 perforations in the middle third, and 27 perforations in the heel third of the lateral.
Unfortunately, it is not yet possible to verify the production impact of these perforating scheme changes. Rockdale is still delineating its field, and production across it varies. Compounding this is the fact that we are actively optimizing other elements of our completion design, such as sand loading. The combination of these factors means we do not have a representative apples-to-apples comparison to evaluate the production impact of the perforating scheme changes. However, there have been encouraging results mitigating frac hits with more aggressive LE designs.
One well utilized a five-cluster VSC perforating scheme, averaging 38 perforations on 21 stages adjacent to a producing well pad. Of the total water volume pumped in those 21 stages, 2.7% was recovered as increased water production on a well 1,000 feet away, and 0.3% was recovered as increased water production on a well 2,000 feet away, for a total of 3.0% water recovery in offset producing laterals.
Another well used an eight-cluster VSC perforating scheme with an average of 30 perforations on 48 adjacent stages. In this case, 2.3% of the total water volume pumped was recovered from a well 1,000 feet away and no increased water production was seen in a well 2,000 feet away. On a normalized basis, this represents a 23% reduction in water recovered in offset producing wells, and the impact radius decreased from 2,000 to 1,000 feet. We attribute this to longer fracture half-lengths in the five-cluster well, where four of the five clusters were taking the majority of the treatment, as opposed to the treatment being evenly distributed in the eight-cluster well.
Editor’s Note: The authors acknowledge Sean Wainwright, Rockdale Energy’s vice president of operations, and Eric Reigle, Rockdale’s chief operations officer, for their contributions to the Marcellus Shale project.
MATT FRY is geologic superviser at Rockdale Marcellus LLC. He has more than 10 years of experience in operations and technical advising. Fry holds a B.S. in geology from Youngstown State University and an M.S. in geology from Northern Arizona University.
ADAM ALTIERI has eight years of engineering experience in upstream energy operations, specializing in the Marcellus and Utica shales. Most recently, Altieri served as a completions engineer II for Noble Energy, where he was responsible for performing economic analyses of completion projects, and designing and overseeing the completions of 120 wells in Pennsylvania and West Virginia. Prior to Noble Energy, Altieri served as a completions engineer for EOG Resources. He holds a B.S in mechanical engineering from Pennsylvania State University.
For other great articles about exploration, drilling, completions and production, subscribe to The American Oil & Gas Reporter and bookmark www.aogr.com.