


Study Assesses ‘Generational Effects’
By Kimberly Ayers, Henry Jacot and Alivia Ayers
PITTSBURGH–In the Appalachian Basin and other horizontal resource plays, the generational effects of parent and child wells are becoming a primary concern to operators as they increasingly shift focus to full-field development using multiwell pads. The issues surrounding generational effects include child well spacing and stimulation designs, protecting parent wells from frac hits, parent well recompletion/refracturing, depletion of stimulated reservoir volumes, and re-orientation of stress profiles.
To examine the relationship between parent and child wells, a study was conducted on a 10-well pad in Southwestern Pennsylvania to analyze detailed pressure and temperature data recorded by a bottom-hole memory gauge in a parent Marcellus Shale well during hydraulic fracturing operations of offset child wells completed in both the Marcellus and Burket shales. The analysis also included hydraulic fracture modeling to mitigate communication between parent and child wells and rate transient analysis (RTA) to understand the depletion of the producing zones.
In this case, the parent well had been producing only for a short time prior to being shut in to complete the child wells. Once child well stimulation operations were completed, the bottom-hole gauge data from the parent well were examined to identify the general magnitude and timing of frac hits in relation to the rock matrix, completion design parameters and completion sequence. Logistic regression testing also was performed on individual parameters to determine key influencers of frac hits.
The results of the study concluded that more than 75 percent of the frac stages in the Marcellus child wells had communicated with the parent well, with the most frac hits attributed to the nearest child well.
The operator drilled 10 horizontal wells on the pad with approximately 8,000-foot lateral lengths in the same azimuth: five wells in the Marcellus Shale and five in the Burket Shale overlying the Marcellus (in this area, the distance between the Burket and Marcellus is 250 feet). The wells were drilled in a stacked pattern with 600-foot spacing. All 10 wells were drilled under similar parameters with similar lateral lengths and identical casing programs.
Because of a variety of factors, the operator chose to complete and produce only one well–the center Marcellus well, the P3-M–in the initial phase of development and temporarily leave the remaining nine wells drilled but uncompleted. After nine months on line, during which it produced 600 million cubic feet of gas and 8,200 barrels of condensate, the P3-M was shut in for a second phase of completion operations.
Phase Two Operations
The first step in phase two was conducting flowing material balance, linear flow analysis and reservoir simulation on the parent well to understand pressure depletion related to its brief production history. A calculated sand face pressure match was achieved and the resulting simulation showed minimal reservoir pressure depletion, given its short time on production and nanodarcy permeability. The minimal reduction in reservoir pressure was not expected to have a major impact on fracture growth and communication.
Based on RTA results and other operational considerations, the operator chose to complete five additional wells during phase two: three of the Marcellus (C1-M, C4-M and C5-M) and two of the Burket (C11-B and C15-B) DUCs. Figure 1 shows the P-3M parent well in red, the five child wells completed in phase two in green, and the four wells left as DUCs in grey.
FIGURE 1
Cross-Sectional View of Wellbores with Parent Well (Red), Child Wells (Green) and DUCs (Gray)
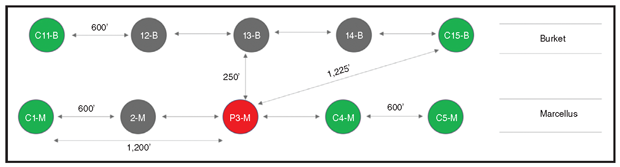
The two Burket wells are located farthest away from the parent, and the C4-M Marcellus well is closest to the parent. Because of its proximity to P3-M’s slightly pressure-depleted area, it was determined that the C4-M would have a smaller stimulation design with reduced fluid and proppant volumes to lessen the potential impact on the nearby parent well.
The operator removed the tubing, loaded the P3-M parent wellbore with produced water and installed the bottom-hole pressure gauge beneath a retrievable bridge plug. The bottom-hole gauge recorded pressure data at a one-second interval. The P3-M was shut in for 21 days prior to starting the first frac stage on the first of the five child well completions. As expected, pressure buildup was recorded on the parent well during the shut-in period.
Three-dimensional hydraulic fracture modeling was performed to estimate the fracture dimensions for the P3-M. The parent well was completed with an “engineered” design where perforations were selected based on cased hole log data acquired with the XMAC™ acoustic tool from Baker Hughes, a GE Company. Stage 11 was modeled and consisted of approximately 8,000 barrels of slickwater and 474,000 pounds of sand. The stage length was 236 feet with five clusters per stage. The designed injection rate was 90 barrels a minute.
To more accurately model the fracture growth, “stress shadowing” was included in the model from Stage 10. The modeling results show unequal fracture growth because of stress shadowing and interference between fractures in the same stage. The cluster closest to the toe took the least amount of fluid, while the cluster closest to the heel took the most fluid.
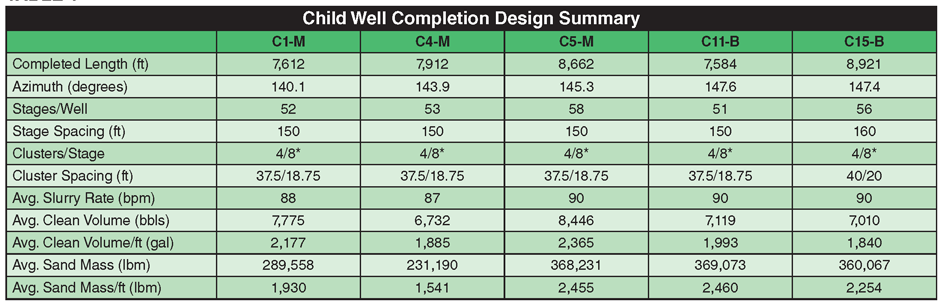
Given the 3-D hydraulic fracture modeling results, the completion design team focused on the distance from the parent well and the target formation as primary drivers of interwell interactions, with total injected volume, injection rate, and fluid viscosity among the critical variables expected to influence interwell fracture interaction. Table 1 shows a summary of the phase two plug-and-perf completion design for the child wells.
TABLE 1
Temperature And Pressure Data
Continuous completion operations lasted for 63 days, beginning in late December 2017 and ending in February 2018. The child wells were completed in a zipper frac style, and 92 percent of the stages placed all planned proppant or more. The Burket wells had the largest sand placement volumes and the C4-M had the smallest (by design). Completions were initiated on the C4-M well first, in hopes that the increased pressure of the closest child well would shield the P3-M parent from frac hits from the C1-M and C5-M. The C15-B and C11-B Burket wells were completed last with the objective of keeping the fractures in zone and continuing to grow upward and away from P3-M.
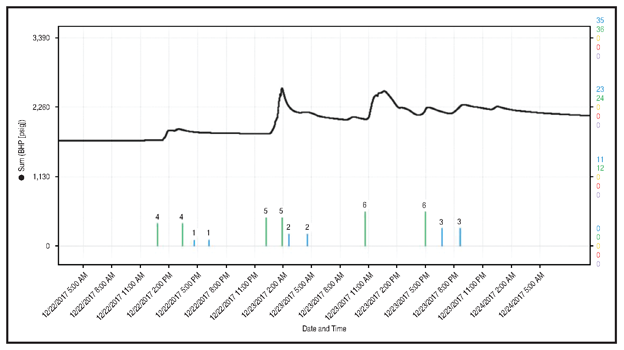
Once the phase two completion activities were finished, the bottom-hole gauge in P3-M was removed and the data were retrieved. The one-second data shown in Figure 2 indicates that both pressure (green) and temperature (red) events were very common throughout the entirety of the child well completions activities.
FIGURE 2
Bottom-Hole Gauge Pressure (Green) And Temperature (Red) Data versus Time
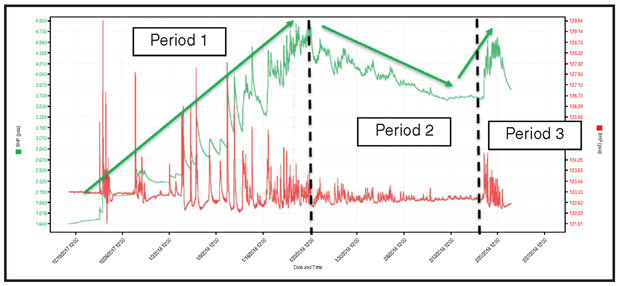
When examined in depth, it was confirmed that every temperature spike corresponded with a pressure spike, as expected. There were three distinct periods in the pressure data. The first period lasted more than 35 days and was characterized by a trend of increasing pressure. The second period was defined by continued pressure pulses while the pressure base line generally decreased. The third period was characterized by a second intense pressure increase near the end of completion operations.
Following this general evaluation, each individual stage was examined in detail, as shown in Figure 3A, to identify whether pressure and/or temperature increases corresponded with stage timing of the child wells. Based on the data examined, the majority of the fracture-driven interactions appear to have been fracture-to-fracture intersections. In general, the major pressure increases during periods one and three correlated to the frac stages of the C4-M, which would be logically consistent, since it was closest to P3-M.
FIGURE 3A
Gauge Pressure and Frac Stage versus Time
This was clearly evident during period three when the C4-M was the only Marcellus well completed. Additionally, period two (thought to be small frac hits or general pressure support of the entire system) corresponded to the frac stages of the Burket wells.
Understanding Frac Hits
The magnitude of each frac hit also was described qualitatively. In some cases, multiple frac hits were identified within a single stage, but never exceeded the number of clusters per stage. It was theorized that multiple pressure pulses during a single stage corresponded to fractures created from unique clusters interacting with the parent well. However, to confirm this conclusion, it was necessary to examine the individual stage pump schedules to confirm that operations held consistent rate and pressure, and that the measured pressure pulses were not related to changes in operational activities.
Overall, this step was very tedious and time consuming. In the future, the development of an automated tool to more accurately and efficiently identify frac hits is highly recommended. Further research into the quantification of the magnitude of the interaction in needed, because the assignment of a base line pressure presents some difficulty.
During the analysis it was noticed that some of the interactions could be interpreted as “pressure support” or stress shadowing of the system, and not a direct frac hit on the parent well. These mainly occurred during the C15-B and C11-B Burket well treatments, but also were observed during the C5-M frac. As shown in Figure 3B, “direct hits” (fracture-to-fracture intersections) have a more distinct peak in the pressure plot. It appears that when the pressure signature has more of a “wave” shape, a fracture is not directly connecting to the parent well, but that the entire reservoir system is experiencing a pressure increase, thereby slowing leak-off and the gradual return of pressure to the expected base line.
FIGURE 3B
Zoomed View of Stage Start/Finish and Pressure versus Time (Pressure Pulses Correspond with Individual Frac Stages)
The temperature gauge data indicated that the fluid within the parent well generally cooled with time, which was anticipated considering that the frac fluid’s temperature was near freezing during the wintertime completion operations. What was not expected were large temperature increases followed by immediate cooling, but these temperature spikes can be explained by the compression of the gas within the parent wellbore.
Looking at the frac hit data, of a total of 269 stages pumped during the completion of the five wells, 131 resulted in frac hits on the parent well. Of the 162 stages pumped in the three Marcellus wells, 122 (75 percent) resulted in frac hits. Even though the fluid volume of the C4-M was reduced because of its proximity to the P3-M, 94 percent of the stages communicated with the parent well. In contrast, only nine (8 percent) of the 107 Burket stages in C15-B and C11-B interacted with the parent well.
The primary factors in predicting frac hits on these wells were the formations in which the wells were landed and well spacing. One would expect that the geologic characteristics and features of the target zone (i.e., faults, fractures, mineralogy, etc.) and total fluid volume also would play a major role in controlling fracture interactions. Unfortunately, geologic information in the study area was limited.
Pilot log information suggested the reservoir quality was roughly consistent across the area. Seismic data were not available, but based on regional geologic mapping and the XMAC log data, major fault systems are not thought to exist in the immediate area surrounding the pad (if seismic and microseismic data had been available, a more thorough investigation could have been conducted to review the intersection of major/minor fault systems or natural fractures with individual stages, allowing specific natural fracture system communications to be identified).
Statistical Analysis
After identifying the frac hits, the collected data were further investigated to identify completion parameters that could have influenced whether a frac stage connected with the parent well. The parameters available and examined during the study ranged from the order of completion operations to frac fluid chemical components and volumes, proppant size and type, proppant loading, stage lengths, treatment pressures, perforation diameter, cluster spacing, and pump rates.
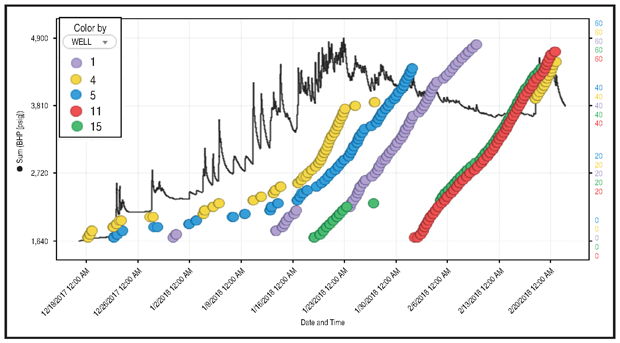
Figure 4 clearly illustrates that distance from the parent well was a primary indicator of fracture interactions. C4-M, located only 600 feet from P3-M, had the highest percentage of stages interacting with the parent well. Interestingly, C1-M and C5-M are located the same distance from P3-M, yet the number of interactions from C5-M were much higher than from C1-M (78 versus 53 percent, respectively).
FIGURE 4
Well Spacing versus Frac Hits
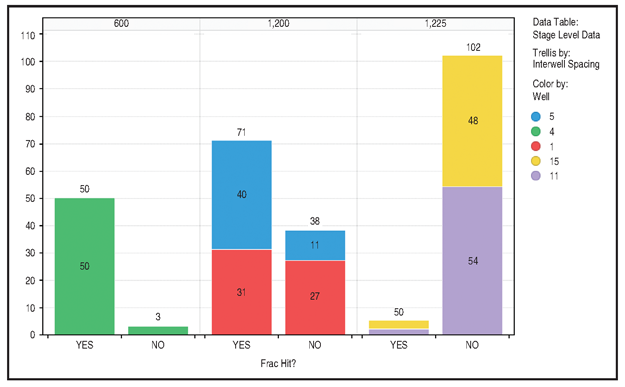
Part of this disparity may be a matter of timing; the C-5M zipper frac began prior to the C-1M’s zipper frac, so stress shadowing could have caused C1-M fractures to orient away from the parent well. In addition, many of the interactions from the C5-M were not direct. It is suspected that fracture-to-fracture interaction occurred between the C4-M and C5-M, which then transferred some of the energy to the P3-M.
As expected, given the complexity of fracturing, there were no single, clear frac hit indicators using simple statistical analysis of the data. Advanced statistical testing was necessary, primarily utilizing nominal logistic regression techniques. As opposed to multiple linear regression, nominal logistic regression predicts the likelihood of a “yes/no” result as opposed to a numerical result. The quantification of the magnitude of each individual frac hit adds depth to the investigation and allows the use of multiple linear regression testing.
TABLE 2
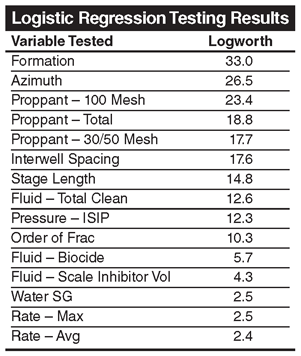
The goal of logistic regression is to find the best fitting model to describe the relationship between the dependent variable (response variable) and independent (predictor or explanatory) variables. For this study, nominal logistic regression quantified and predicted the likelihood of a yes/no result by testing each independent variable to determine its level of significance (p-value) in relation to frac hits.
To better quantify and scale the p-value for graphing, a “logworth” value was assigned. Any logworth value above 2.0 was considered to be statistically significant. Table 2 shows the independent variables from the study with p-values less than 0.01, meaning that these variables were very likely significant. A larger logworth value does not necessarily imply that one independent variable is more significant than another, but from these independent variables, the analysis revealed that the most accurate in their predictive tests were formation, azimuth, 100-mesh proppant, total proppant, 30/50-proppant and interwell spacing.
FIGURE 5
Parent Well Gas (Red), Condensate (Green) and Water (Blue) Production Rates versus Time
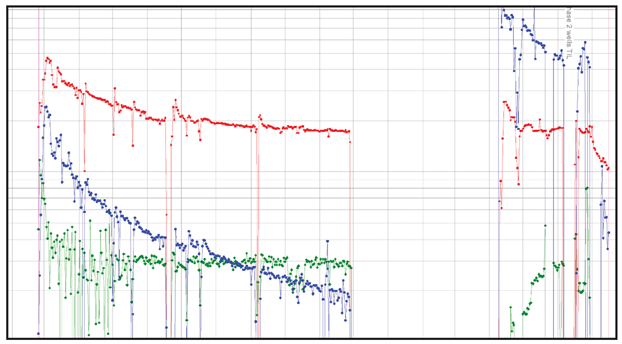
After phase two completion operations were finished, the P3-M parent well was returned to production while the five child wells remained shut in for an additional two months. Initially, the P3-M’s water rate increased while the condensate rate decreased because of liquid loading from the child well fracs (Figure 5). The gas rate showed an initial increase compared with its average prior to completing the child wells, likely from pressure buildup within the wellbore. However, gas rates on the parent well decreased to below the previously established decline profile once the child wells began producing.
The child wells have not been in production long enough to examine the stimulation effectiveness with RTA or identify the presence or effect of long-term fracture-to-fracture interactions. Based on the RTA results and successfully executed stimulations, we expect the Marcellus child wells to perform as if the parent well had not been produced and the two Burket wells to exhibit the characteristics of stand-alone wells without any evidence of reservoir depletion.
Editor’s Note: Multiple software programs were utilized in the parent/child well study, including the TIBCO Spotfire® data analytics and visualization solution; ARIES® petroleum economics and reserves software from Landmark, a Halliburton business line; JMP® statistical software; the IHS Markit Harmony™ engineering and reserves evaluation platform; and Barree & Associates’ GOHFER® geomechanical fracture simulator. For more detailed information on the analysis and results, see SPE 191785, a technical paper presented at the 2018 Society of Petroleum Engineers/American Association of Petroleum Geologists Eastern Regional Meeting, held October 7-11 in Pittsburgh.

KIMBERLY AYERS is founder and senior reservoir engineering consultant at Ayers Petroleum Consulting LLC in Washington, Pa., where she applies advanced evaluation techniques to both conventional and unconventional Appalachian Basin properties. Ayers previously served in reservoir and petroleum engineering roles at LOLA Energy, Inflection Energy, Tenaska Resources, Northeast Natural Energy, and Larch Oil & Gas. She holds a B.A. in chemistry and a B.S. in mathematics from West Virginia Wesleyan College, and an M.S. in petroleum and natural gas engineering from West Virginia University.

HENRY JACOT is president of HFrac Consulting Services LLC in Canton, Oh. With more than 30 years of experience in well completion and stimulation, he previously served as manager of completion technology in Chevron’s North America business unit, vice president of completion technology at Atlas Energy and technical manager at Meyer & Associates Inc. Jacot holds a B.A. in business administration from Texas Christian University.

ALIVIA AYERS is an engineering technician at Ayers Petroleum Consulting LLC. She studied industrial engineering and statistics at West Virginia University.
For other great articles about exploration, drilling, completions and production, subscribe to The American Oil & Gas Reporter and bookmark www.aogr.com.