


Study Optimizes Eagle Ford Completion
By Kennedy Chukwuemeka Nwabuoku
HOUSTON–A major challenge to efficiently completing a horizontal well in shale plays is determining the optimal stage spacing and number of perforation clusters per stage to effectively drain the reservoir.
Because the Eagle Ford Shale play in South Texas is still in its development infancy compared with other North American shale plays, it is lacking scientific studies that address these key lateral coverage questions. In developing the Eagle Ford, industry practices have been based largely on available capital or best estimations. Even though the Eagle Ford has different formation characteristics and mineralogy content, the tendency on initial wells was to apply the same drilling and completion designs used in more established shale plays.
El Paso Corporation undertook a project to study stage spacing and numbers of perforation clusters per stage in four of its first Eagle Ford horizontal wells in an effort to optimize completion design and improve reservoir performance. The wells were completed with typical 4,000-foot lateral lengths with four to six perforation clusters and 300,000-350,000 pounds of proppant per stage, with a total of 14-16 stages.
Radioactive tracers (antimony, scandium and iridium) were used to tag the proppant, chemical tracers marked the stage frac fluid, and flow-through composite bridge plugs isolated the treated zones. After stimulating all the zones, the plugs were drilled out and a spectral gamma ray tool was run in the hole with coiled tubing to log the lateral.
Tracer log results from the first well in the study showed that most of the perforated zones were treated, with the exception of the toe stage, which showed little or no stimulation. A close observation of the tracer log output indicated that the treated lateral area (the area with tracer signature) was less than half of the entire lateral length. A linear count of the exact lateral length covered by the tracer mark compared with the entire lateral length revealed less than 36 percent coverage.
After drilling the first well, changes were made to the completion methodology to improve the stimulated lateral coverage and reservoir performance (the well productivity index). These changes resulted in obtaining 100 percent improvement in stimulated lateral coverage, with a corresponding positive impact on productivity index.
Understanding The Reservoir
FIGURE 1
Eagle Ford Dry Gas,
Condensate and Oil Windows
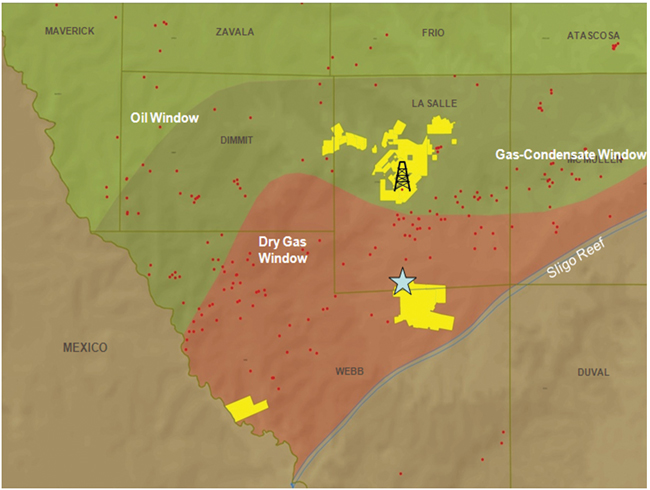
The hydrocarbons produced from the Eagle Ford formation range from predominant dry gas in the south (Duval County), to condensate-rich liquid (La Salle County), to predominant oil (Zavala and Frio counties). Figure 1 shows the general areas where the reservoir produces oil (green), high liquids (dark green) and predominately dry gas (brown). Moreover, some parts of the play are overpressured, and the basic structural characteristics of the shale vary significantly across the play. For example, gross height ranges from 20 to 500 feet in thickness, and depth varies from 2,500 to 14,000 feet. The variability makes understanding the local reservoir critical to successfully developing and stimulating the Eagle Ford.
The first exploratory Eagle Ford wells were drilled in the dry gas window in LaSalle County in late 2008. The early completion designs emulated Barnett-style water frac stimulation treatments and had varying degrees of success. Determining what spacing to apply and how many perforation clusters to use per stage are issues that many operators have struggled with. With Eagle Ford wells costing $8 million-$10 million, it is important to achieve efficient lateral coverage without spacing fractures too close together. Hydraulic fracturing is the largest single completion cost component, and spacing determines how many fracs will be placed in a given lateral length (the denser the spacing, the higher the cost).
The effectiveness of the fracture network created depends on multiple factors. Given the same fracture design (job size, rate, fluid type, etc.), the major variables are spacing between composite bridge plugs, the number of perforation clusters per stage, and the space between the clusters. Considering the ultralow permeabilities of shale formations, the amount of hydrocarbons drained from the reservoir are proportional to the stimulated rock volume (SRV), making placing multiple, closely-spaced fractures critical to establishing commercial production.
On the other hand, spacing multiple fracs too closely can be counterproductive, since the stress field generated between competing fractures can impact the propagation of adjacent fractures within the same stage, resulting in less-than-optimal fracture geometry and SRV, reducing production and recovery.
In Situ Stress Field
The in situ stress field has a major influence on hydraulic fracture creation, impacting fracture initiation, propagation, orientation and geometry. Creating a hydraulic fracture also alters the stress field in the surrounding area. The stress field induced from multiple fractures will influence the propagation of neighboring fractures within the same stage and adjacent stages to varying degrees.
Stress concentration occurs between fractures. The created fracture alters both the in situ minimum horizontal and the maximum horizontal stress, and studies show the stress increase is greater for minimum horizontal stress than for maximum horizontal stress. The width of the center and subcenter fractures are influenced strongly by fracture spacing (perforation cluster spacing), while the width of the edge fractures are relatively insensitive to fracture spacing.
For multistage fracturing treatments, the stress concentration resulting from the previous fractured stage may have a significant effect on the initiation and propagation of fractures in the subsequent stage when cluster spacing is too close. However, this effect may be negligible by the time the next stage is ready for fracturing, since the stress concentration created during fracturing dissipates with time (until fracture closure). In ultralow-permeability shale formations, it is not uncommon for stress dissipation to take longer between stages.
The need for adequate lateral coverage in horizontal shale completions has been well documented. In some instances, additional sets of perforations have been added between existing perforations a few years after the original completion and then refractured, with well production exceeding the rates after the initial completion.
An example is Bakken Shale refracs. In one case, the original completion design used fewer perforated clusters in an attempt to divert treatment along the lateral, but post-frac tracer logs revealed long intervals of unpropped sections near the well bore. To increase contact with the reservoir, additional perforation clusters were added between existing clusters and the well was fracture treated again (using a similar job size as the original frac treatment). A post-frac tracer log revealed more lateral coverage with higher production after refracturing than what had been achieved with the initial frac. This highlights the importance of adequate lateral coverage in effectively draining a shale reservoir.
Increasing perforation clusters in one stage can lead to the resulting fractures competing for space (width), while having too few clusters in one stage results in inadequate drainage of the reservoir. This necessitates finding an optimal spacing per 1,000 feet of lateral and number of perforation clusters per stage to adequately drain the reservoir and ensure the resulting fractures have enough width.
Eagle Ford Case Studies
To determine the optimal spacing and number of perforation clusters in the Eagle Ford, El Paso’s study analyzed four of its horizontal wells: the first two it drilled in the dry gas window and the first two it drilled in the oil window. The Briscoe Nunley GU No. 1H was the company’s first Eagle Ford completion. It is located in the dry gas window, where the formation produces mainly gas without condensate.
FIGURE 2A
Open-Hole Data In Vertical Pilot Hole
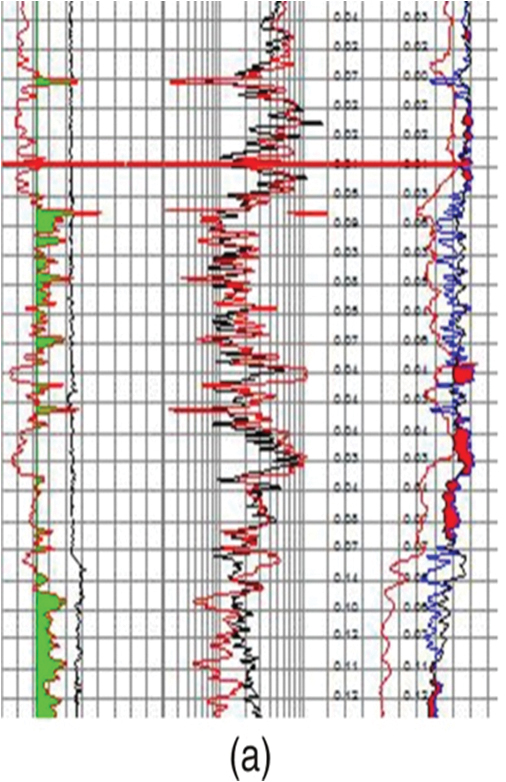
To adequately understand the formation and reservoir characteristics, core sample analysis with X-ray diffraction was conducted. A cased-hole pulsed neutron log (PNL) was run on electronic coil consisting of a natural gamma-spectrum log for shale and clay type identification, and an inelastic and capture spectrum log with which a mineralogy model was built by determining the volume fraction of clay, sand and carbonate.
The PNL log was converted using the cased-hole interpretation (CHI) model to pseudo open-hole data (density, neutron and resistivity), which simplified future well-to-well comparisons. The resulting synthetic data, together with the PNL data, were analyzed in the petrophysical shale log model to determine the brittleness factor of the shale along the lateral. Formation brittleness and ductility influence fracture initiation and propagation (hence stimulated rock volume and coverage in the lateral section of the formation), since fractures in more brittle areas tend to initiate and propagate easily compared with those in ductile sections.
FIGURE 2B
CHI Model Pseudo
Open-Hole Data in Lateral
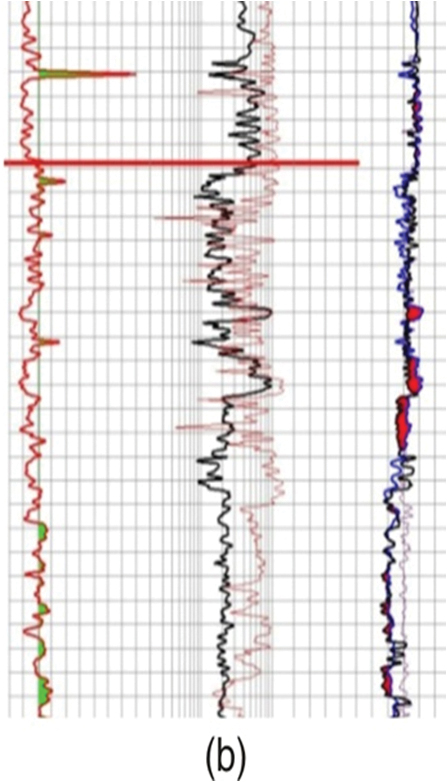
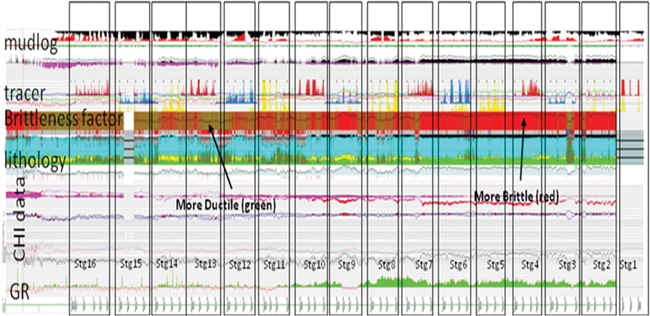
The data retrieved from the PNL log were then calibrated with the open-hole log data from the vertical pilot hole. Figure 2B shows that the CHI-modeled pseudo open-hole data correlate well with that of the vertical pilot shown in Figure 2A. The shale log model was used to calculate the rock brittleness factor to grade the shale reservoir into potential completion intervals. Figure 3, displays the CHI model of PNL shale log analysis in the lateral well bore. The more ductile rock is indicated by a green color spectrum in the brittleness factor track, while the more brittle rock is colored in red.
FIGURE 3
CHI Model of PNL Shale
Log Analysis in Lateral
Completion Design
The lateral length of the Briscoe Nunley well is 4,000 feet (16,643 feet measured depth and 12,513 feet total vertical depth). The well was completed with 250-foot spacing between plugs, four perforation clusters (three feet with six shots per foot), and 50 feet between perforation clusters. The lateral section was divided evenly up to a total of 16 stages.
The vertical pilot hole was drilled, logged and evaluated to determine where to drill the lateral. The well bore configuration used 4.5-inch, 15.1-pound/foot casing. The job was designed with a series of three 100-mesh sweeps using 10-pound linear gel followed by linear pad and main proppant stages ranging from 0.25 to 2.0 pounds. The plug-and-perf completion method was used to isolate the stages.
Each stage consisted of 350,000 pounds of total proppant (50,000 pounds of 100-mesh and 300,000 pounds of 40/70-mesh resin-coated sand) staged from 0.5 to 3.0 pounds/gallon with 12,800 barrels of a “hybrid” system with 3 percent potassium chloride (KCl) treated water. The average surface treating pressure was 12,000 psi at 80 bbl/minute.
The pump schedule was designed to accommodate the complexity of the frac system in the near-well-bore region. The hybrid design schedule included 30,000 gallons of prepad, which created fracture geometry ahead of three sets of 100-mesh sweeps pumped with 5.0-centipoise linear gel fluid, a 15,000-gallon main frac linear pad, and the 40/70 resin-coated proppant. Proppant was staged from 0.5 to 2.0 pounds/gallon, and at the 1.25 pounds/gallon stage, the fluid was cross-linked with a borate cross-linker and cross-linked gel was used to transport the heavier proppant-laden fluids and create frac width for the tail end of the treatment.
Frac design was finalized on location, the stimulation treatment was performed, and both chemical and radioactive tracers were run as part of the post-frac diagnostics to evaluate the treatment. During each stage, a different chemical tracer was added to the proppant and frac fluid. Proppant was traced with alternating isotopes, and fluid was traced with a fluid tracer. Water samples were collected during flow back, and production logs were run in the lateral about six weeks after the well was completed.
FIGURE 4
Radioactive Tracer Log
(Briscoe Nunley GU No. 1)
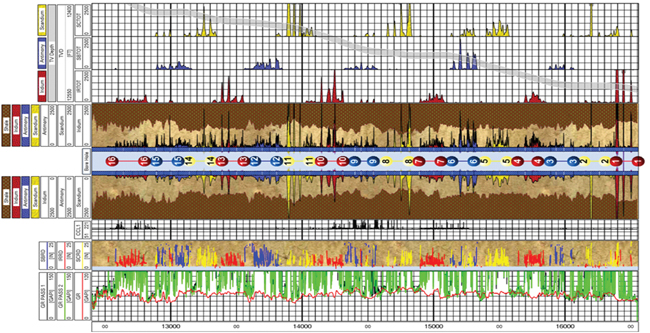
The radioactive tracer log (Figure 4) shows that all 16 fracs had communication with the formation. It also appears that the majority, if not all, of the perforation clusters had communication between the well bore and the reservoir. However, the log also reveals a large interval of unpropped section near the well bore. The section of the lateral without tracer signature (unpropped) was counted, and only 32 percent of the lateral section was propped based on the tracer signature. Also, the tracer signatures near the well bore were not distinct, which may be a result of low proppant concentration in this area.
Nunley Traylor No. 1H
The Nunley Traylor No. 1H was El Paso’s second well drilled in its Eagle Ford acreage. It is located about one mile from the Briscoe Nunley No. 1, again in an area where the Eagle Ford produces mainly gas without condensate. Both wells share identical petrophysical properties.
The lateral length of the Nunley Traylor well is 4,000 feet (16,838 feet MD and 12,500 feet TVD). The well was completed with 279 feet of spacing between plugs, six perforation clusters (three feet with six shots per foot), and 37 feet between clusters. The lateral section was divided evenly into 14 stages. The job was designed with a series of three 100-mesh sweeps with 10-pound linear gel, followed by a linear pad and main proppant stages ranging from 0.25 to 4.0 pounds. The well was designed with 14 stages, with the plug-and-perf method used to isolate stages.
Each stage again consisted of 50,000 pounds of 100-mesh sand and 300,000 pounds of 40/70-mesh resin-coated sand staged between 0.5 and 4.0 pounds/gallon and 12,800 pounds of a hybrid system with 3 percent KCl treated water. Proppants and frac fluids were traced again. Average surface treating pressure was 10,200 psi at 80 barrels/minute.
FIGURE 5
Radioactive Tracer Log
(Nunley Traylor No. 1)
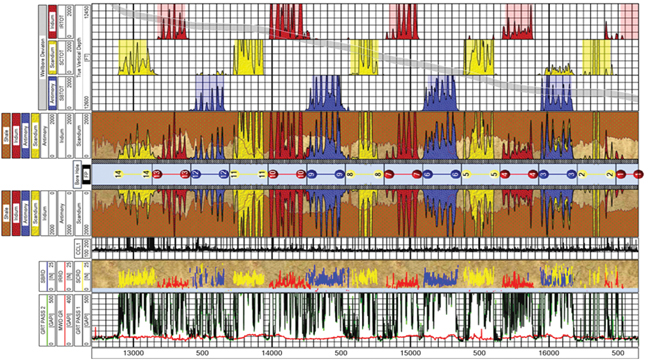
The radioactive tracer log (Figure 5) showed that all 14 stages had communication with the formation. It also appears that the majority, if not all, of the perforation clusters had communication between the well bore and the reservoir. Furthermore, the log showed more coverage in the lateral than was seen in the Briscoe Nunley. In fact, 69 percent of the lateral section was propped, which was more than twice the section propped in the Briscoe Nunley GU No. 1. The tracer signature also was more distinct. Overall, the coverage was much better in the Nunley Traylor well.
A production index comparison of both wells after 30 days of production shows the Briscoe Nunley and Nunley Traylor wells had the same PI (0.13 cfd/psi2), despite the fact the Briscoe Nunley had two more stages and pumped 700,000 pounds more proppant. The cost of the two extra stages in the Briscoe Nunley GU No. 1 was $487,450.
Lateral communication with the well bore increased by more than 100 percent by increasing the perforation clusters from four to six. A more defined tracer indication also was noticed on the log by increasing proppant concentration to four pounds of proppant added (ppa) on most of the stages and to five ppa in the last stage, even though the well was overflushed. The increase in proppant concentration at the tail end of the job was still very effective in establishing a larger open pathway (propped width) to the formation.
A zero-time plot of the production profile between the Briscoe Nunley GU No. 1 (4,000-foot lateral with 16 stages spaced 250 feet apart and 50 feet between clusters using four clusters and a maximum 2 ppa proppant concentration) and the Nunley Traylor No. 1 (4,000-foot lateral with 14 stages spaced 279 feet apart and 27 feet between clusters using six clusters and a maximum proppant concentration of 4 ppa) shows little to no difference, despite the fact the Nunley Traylor well was flowing at a more restricted rate. The choke size for the Nunley Traylor was 24⁄64, while the Briscoe Nunley was flowed on a 38⁄64 choke.
From day 12, when the Nunley Traylor well came on line, the production was higher than the Briscoe well. This trend continued for another 40 days, at which point the choke was opened up to 46⁄64 on the Briscoe Nunley well, causing its production to jump above the Nunley Traylor. The Briscoe Nunley remained slightly higher for another 60 days until day 120, but from there on, production from both wells was exactly the same.
Hixon No. 1H
The Hixon No. 1H was El Paso’s first well completed in the Eagle Ford’s liquid-rich condensate window. The net pay thickness in the Hixon area is 180-220 feet. The lateral length is 4,000 feet (14,161 feet MD and 9,950 feet TVD). The well was completed with 285 feet of spacing between plugs with four perforation clusters (three feet with six shots per foot) and 65 feet between clusters. The lateral section was divided into 14 stages.
The job consisted of only one sweep stage with 10 pounds of linear gel, followed by a linear pad and the main proppant stages ranging from 0.25 to 4.0 ppa. The plug-and-perf method was used for isolation. Each stage consisted of 300,000 pounds of proppant (80,000 pounds of 100-mesh sand and 220,000 pounds of 40/70 resin-coated sand) staged from 0.5 to 4.0 ppa with 7,500 barrels of a hybrid system with 2 percent KCl substitute treated water. The proppant and fluid were traced with alternating isotopes and a fluid tracer. The average surface treating pressure was 9,400 psi at 80 bbl/min.
Knowing that the Hixon well was in a liquid-rich condensate area and that multiphase flow would require greater conductivity to adequately drain the reservoir, the pump schedule was designed with a more aggressive proppant ramp to help generate conductivity.
FIGURE 6
Radioactive Tracer Log (Hixon No. 1)
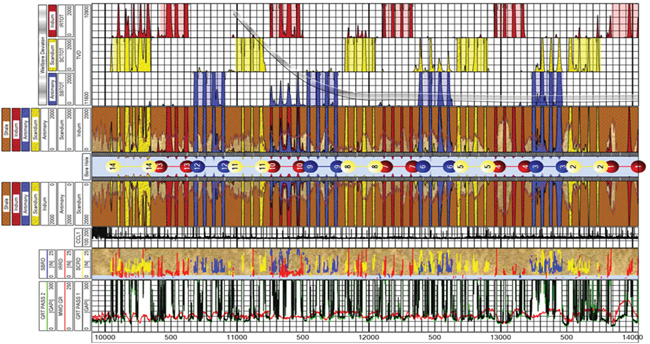
The post-frac log indicated that all 14 stages had communication with the formation. The majority, if not all, of the perforation clusters had communication between the well bore and the formation. However, a count of the interval of propped section near the well bore, as indicated by the tracer signature, revealed that only 37 percent of the lateral section was propped. It also should be noted that the tracer signature was quite distinct compared with the Briscoe Nunley (Figure 6).
Hixon No. 4H
The Hixon No. 4H was El Paso’s second well completed in the liquid-rich condensate window and is located 1.5 miles from the Hixon No. 1H. The lateral length is 4,950 feet (15,033 feet MD and 9,950 feet TVD). The well was completed with 275 feet of spacing between plugs, six perforation clusters (three feet with six shots per foot) and 37 feet between perforation clusters. The lateral section was divided evenly into 18 stages.
The per-stage job design was the same as the Hixon No. 1, except that the maximum proppant concentration reached 5 ppa for most of the stages and larger 30/50-mesh proppant was pumped on stages 1, 2, 7 and 13, where a report from Horizontal Solutions International, a geonavigation/geosteering consulting and reporting services provider, showed faults going through these sections of the lateral. All 18 stages were pumped to completion.
FIGURE 7
Radioactive Tracer Log (Hixon No. 4H)
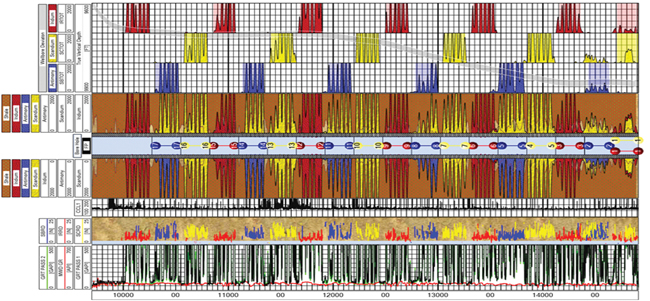
After logging the well post-frac, the tracer log (Figure 7) showed that all 18 stages were in communication with the formation. The tracer also showed more coverage in the lateral than was seen in the Hixon No. 1H. The interval of propped section near the well bore, as indicated by tracer signature, showed that 67 percent of the lateral section was propped, similar to the results obtained in the Nunley Traylor well. In addition, the tracer signatures were quite distinct (it is worth noting that the propped width indicated by tracer signatures is larger in the Hixon No. 1H than in either the Hixon No. 4 or Nunley Traylor No. 1).
From the tracer logs, it is evident that the Hixon No. 1H has more spaces between the propped sections compared with the Hixon No. 4H, and consequently, less SRV near the well bore. The propped width also is pronounced compared with the propped width of the Hixon No. 4H well. Propped width in the No. 4H well is strongly influenced by spacing, since there seems to be competition for space among the individual fractures compared with the No. 1H. The spacing in the Hixon No. 1H seems to allow for creating larger individual fracture widths.
After six months of data collation, the Hixon No. 4H (4,900-foot lateral with 18 stages spaced 275 feet apart and 37 feet between clusters using six perforation clusters and 5 ppa maximum proppant concentration) had yielded 38 percent more production than the Hixon No. 1H (4,000-foot lateral with 14 stages spaced 285 feet apart and 65 feet between clusters using four perforation clusters and 4 ppa maximum proppant concentration).
FIGURE 8
Production from Bakken Shale Wells
with Different Stage Spacing
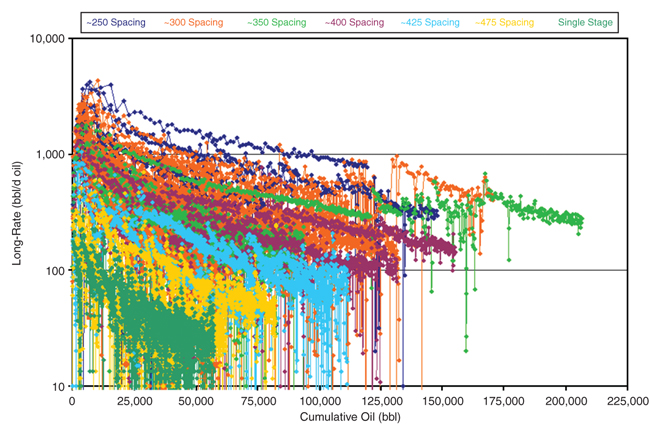
Figure 8 shows cumulative production results from multiple wells with varied spacing in the Bakken Shale play. In this case, it is evident that wells with 250-300 feet of spacing perform better than wells with greater spacing. The four wells in the Eagle Ford study indicate that wells with 270-280 feet of spacing perform better than wells with more than 280 feet of spacing between stages.
Main Conclusions
The main conclusions that can be drawn from the analysis of the four Eagle Ford Shale horizontal wells include:
- Too much space between perforation clusters (greater than 40 feet) results in less than 40 percent of propped section near the well bore.
- Reducing space between perforation clusters to within 35 feet doubles the percentage of the propped section near the well bore.
- Placing 3.5 stages per 1,000 feet of lateral seems to give the best results.
- Final proppant concentrations of less than 3 ppa do not give adequate propped width near the well bore (this is even more critical since all plug-and-perf completion methods overflush after each stage, which means the actual final proppant concentration near the well bore may be significantly less than the final pumped proppant concentration).
- Given the choice between propped width and stimulated rock volume/coverage, SRV seems to be more critical than width near the well bore (this is not surprising, considering the nano-Darcy nature of shale permeability and the fact that any area of the formation not fractured or propped does not contribute to production).
- Significant cost savings can be realized by placing the optimal number of stages necessary to adequately drain the reservoir.

Kennedy Chukwuemeka Nwabuoku is lead engineer for El Paso Corporation’s Wolfcamp program in West Texas. He joined El Paso three and a half years ago, starting the company’s Eagle Ford Shale campaign in the third quarter of 2009. Nwabuoku developed and designed the production/completion program for El Paso’s entire Eagle Ford Shale program. He began his career with Schlumberger in 1998 and held various positions in his 10 years of service at the company, including geomarket technical engineer and account manager in Russia for five years, and operations manager for West Africa (Gabon, Cameroon and Nigeria) stimulation vessels providing gravel pack, stimulation pack and matrix stimulation services. Before joining El Paso, Nwabuoku consulted for TNK-BP, reviewing and optimizing fracture stimulation applications in all of its fields in Russia. He also reviewed the company’s electrical submersible pump program and run life extension.
For other great articles about exploration, drilling, completions and production, subscribe to The American Oil & Gas Reporter and bookmark www.aogr.com.