


Time-Lapse Geochemistry Extracts Valuable Insights From Produced Waters
By Peter Jones, Drew Dressler, Tyler Conner and Josh O’Brien
OKLAHOMA CITY–In the Powder River Basin Niobrara and Turner tight oil play, Devon Energy is employing a novel approach to understand multi-horizon fluid flow from produced water volumes using time-lapse geochemistry (TLG). Isotopic and standard water chemistry analyses identify formation water produced from different horizons, facilitate “unmixing” produced waters to determine the relative allocation of each contributing zone, assess total fluid flow, and delineate performance differences between wells.
Furthermore, integrated produced water TLG with oil TLG data shed new insights on key factors that impact well productivity, such as frac height and stimulated rock volume (SRV), changes in the contributing rock volume (CRV) over time, reservoir drainage behavior, and vertical connectivity between multiple zones with stacked-well development patterns.
The composition of produced water from unconventional wells varies greatly in terms of ion chemistries and isotopic characteristics, but typically is dominated by formation water, even though the overall volume of stimulation makeup water may be high in early well life. The fact that most makeup waters are relatively fresh, with low total dissolved solids, results in a relative abundance of dissolved ions as a reflection of the original formation water chemistry.
Unlike water produced in conventional formations, where there is significant matrix porosity or fractures to contain mobile water, the fluids in tight reservoirs are relatively immobile with a dominant component of capillary-bound water. In considering dramatic differences observed in the chemistry of adjacent formations, it was hypothesized that solute transport and water movement in these tight layers had been much more limited. This would be analogous to the case of some unconventional hydrocarbon accumulations, where limited migration occurs, with hydrocarbons generated within or immediately adjacent to the reservoir.
In assessing differences in formation water, the two primary factors involved are the origins of water and the salinity. For the purpose of this study, formation water was divided into three categories:
- Connate water associated with the original deposition of the sediments that has undergone limited migration (original TDS ~35,000 mg/l);
- Meteoric water that entered the subsurface through infiltration of surface waters; and
- Migrated water that experienced substantial fluid flow during its evolution as a result of basin evolution, dewatering or hydrocarbon generation.
Two of the most important factors affecting the salinity and chemistry of formation water are depth and temperature. Whether it is dissolution processes, rock/water reactions or mineral diagenesis, the rate and extent of these processes ultimately are controlled by temperature, and to a lesser degree, pressure.
For most unconventional reservoirs, formation water often has experienced only limited fluid flow or has not had significant fluid flow after hydrocarbon charging. In such cases, variations in water chemistry in adjacent formations may reflect lithology differences and the corresponding rock/mineral/water reactions that have occurred. The ability to identify formation water from different horizons is enhanced by ion ratios constructed to exploit known water/mineral interactions, providing insight into the genetic origin of formation water and any alterations that have occurred over time.
Ion ratios can be constructed considering differences that relate to the source of the solutes and the alteration of the chemistry by rock/water reactions, which inherently are affected by depth and temperature. The genetic origin and alteration tool (GOAT) was created to facilitate the discrimination of chemistry differences in formation water from different zones. GOAT uses a radar plot with axes composed of ratios that highlight the common changes accompanying water diagenesis. The tool allows customization of the radar plot using a variable number of parameters.
Characteristic Chemistries
Figure 1 is a GOAT radar plot customized for the Powder River Basin study area. The lines represent four samples from the baseline and time-lapse series that represent the characteristic water chemistry for the respective horizons. The red line is the Middle Turner, the blue dashed line is the Upper Turner, the green line is the Niobrara Shale/Marl, and the orange dashed line is the Niobrara B Chalk reservoirs.
FIGURE 1
Powder River Basin Study Area Radar Plot
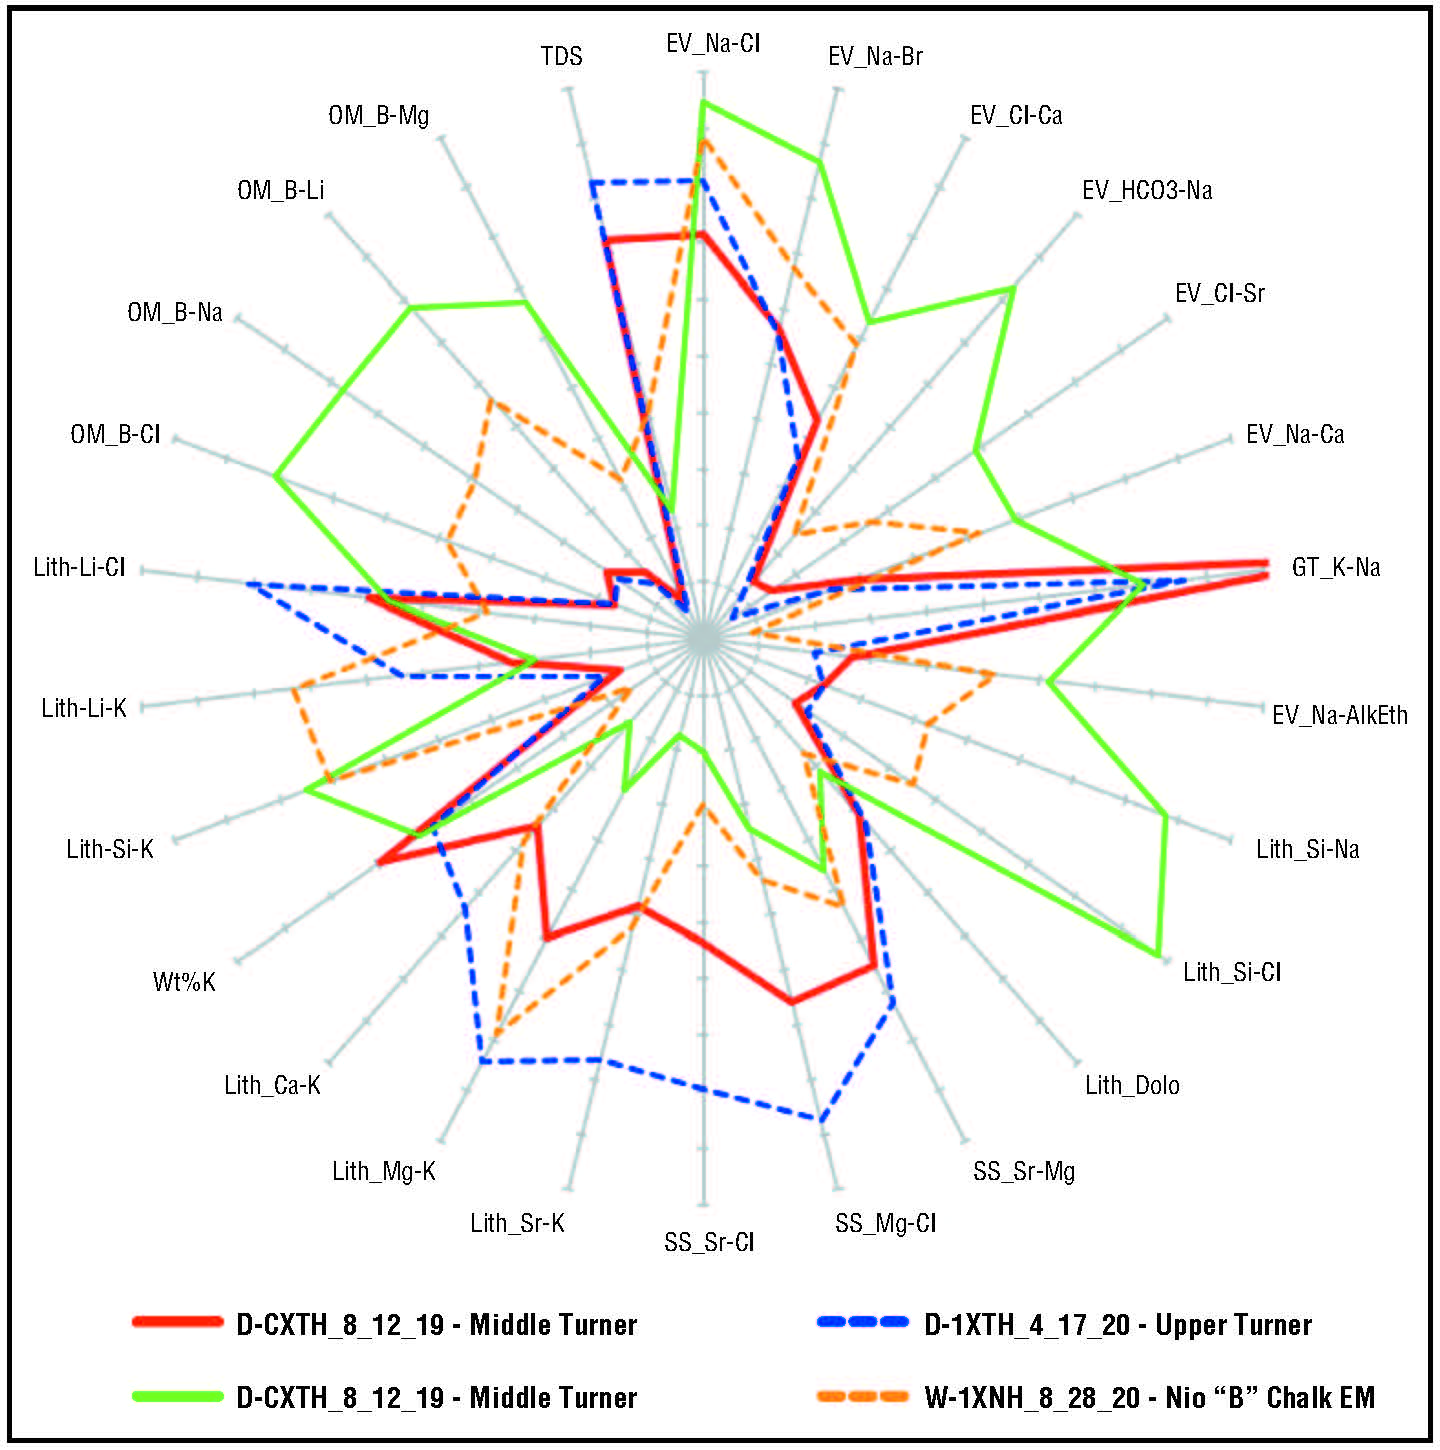
On each axis is one of the parameters used, with the position organized into categories: water evolution (EV), geothermometers (GT), lithology (Lith), salinity source (SS) and organic matter related (OM). Multiple factors can impact the value of each parameter. For example, any parameter for water evolution also is influenced by lithology parameters, which in turn, are influenced by temperature and maturity, etc. Some trial and error is necessary to develop radar plots for each area, to constrain plots to parameters constructed with available data, and to determine useful scale ranges for comparing water chemistries of contacted reservoir intervals.
Water evolution parameters are located in the northeast quadrant of the plot, and primarily are affected by the general transition from Na-Cl (sodium chloride)-type water to Na-Ca-Cl, and ultimately, to Ca-Na-Cl. Consequently, various ratios decrease because of increasing calcium or decreasing sodium. Also included is bicarbonate, which decreases rapidly with depth and temperature.
The Niobrara water sample plots with the highest values for the ratios categorized for water evolution. This often is observed for formations with high shale or very fine-grained siliciclastic sediments. In the Niobrara Shale/Marl, it is notable that TDS at the upper left are much lower, and typically do not exceed 25,000 mg/l. Therefore, the present-day formation is fresher than the marine water in which these sediments were deposited (~35,000 mg/l). This suggests that the Niobrara’s low-permeability prevented significant transport of salinity.
The “freshening” of tight shale units corresponding to increasing depth, temperature and thermal maturity is observed commonly in the Eagle Ford, Wolfcamp, Woodford and other shales. Generally, this is attributed to smectite-illite conversion, which produces abundant water, combined with the inability to transport solutes because of low permeability.
The parameters in the southeast and southwest quadrants of the radar plots primarily relate to lithology and salinity source (SS). The various parameters using silicon are generally higher for tight shaley or siliceous units, while relative silicon is low in waters that have higher TDS and follow a more typical evolutionary path. The SS parameter ratios can show differences related to the composition of evaporites, and depending on minerals present, can have different relative abundances of potassium, calcium, magnesium, strontium and barium.
The parameters located in the northwest quadrant of the radar diagram are formed by different ratios of boron to various other species. In typical unconventional reservoir lithologies, elevated relative boron levels show up in source rocks or hydrocarbon-bearing zones. The level of boron, when related to degradation of organic matter, shows a regular increase with increasing thermal maturity. As a result, these parameters are useful in differentiating fine-grained, organic-rich lithologies from organic-poor siliciclastic lithofacies.
Fluid End-members
Baseline fluid samples from routine water analyses, conducted as part of well production operations, are an essential element of thoroughly classifying of water types and TLG studies. Optimally, this also includes typical frac water samples. Depending on circumstances, samples collected for baseline studies are often mixtures of frac water and formation water from one or more contributing zones. For this reason, it is important to gather as many samples as possible for each zone of interest.
Once a GOAT radar diagram has been customized for an area, it becomes the basis for grouping produced water samples into families characteristic of particular zones or mixtures that result from stimulation and multizone fluid flow. To facilitate this process, the values on each axis are unitized, which allows the calculation of the percent deviation between values and a “similarity” index based on the average deviation for all parameters. Samples with very high similarity values necessarily plot very close to one another and have the same geometric shape, making it easy to visually recognize distinct water types and mixtures.
After samples have been grouped with compositions representative of the various horizons, the most distinct end-member samples usually still have some component of frac makeup water. To use such samples in mixing models, the composition must be restored to values with overall salinity characteristic of formation water.
The relative contribution of frac water versus formation water is assessed through a cross plot of oxygen and hydrogen isotopes. Isotopic results from baseline samples from Turner wells producing for several years in the development area show that more than half of produced water is formation water, even in the earliest flowback samples. There is a large isotopic contrast between the low-TDS surface water used for fracturing and high-TDS subsurface brine, which makes the trends appear very linear and gives the impression that only two water types are mixing.
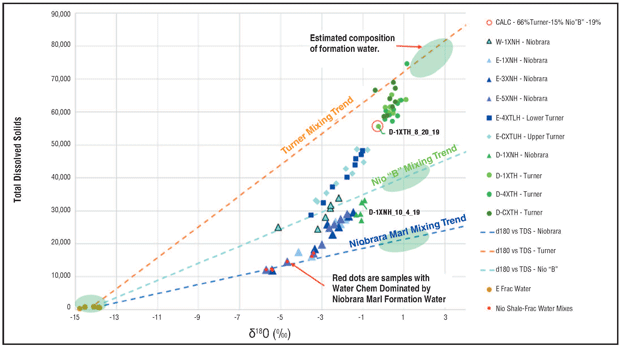
Much greater variation is apparent when analyzing a cross plot of oxygen isotopic composition versus TDS or chloride concentration (Figure 2). In comparison with makeup water (~800 TDS mg/l), Niobrara/Marl formation water has ~20,000-23,000 TDS mg/l, Niobrara B water has ~37,000-43,000 TDS mg/l, and Turner formation water has ~73,000-83,000 TDS mg/l. These values are important inputs for water unmixing and allocation since they determine the relative impact on water chemistry for equal volumes of different water types.
FIGURE 2
Oxygen Isotopic Ratios (δ18O) versus TDS for Time-Lapse Produced Water Samples
Unmixing And Allocation
For this study, unmixing in GOAT utilized five end-member water samples: Niobrara/Marl, Niobrara B, Upper Turner, Middle Turner and frac water. The differences in water chemistry for the formation water end-members are shown in Figure 1. The Middle Turner (red line) is distinguished from the Upper Turner (blue dashed line) by higher lithium and lower potassium, and from the Niobrara by higher relative strontium, magnesium, calcium and lithium. The Niobrara Shale/Marl (green line) has low relative calcium, magnesium and strontium and high silicon, potassium and boron. The Niobrara B (orange dashed line) has higher relative water evolution parameters than the Turner because of lower calcium and higher sodium and boron.
However, the most extraordinary feature of the Niobrara B water type is exceptionally low potassium. Such low potassium likely involves the consumption of potassium by smectite-illite transformation and the presence of several regional bentonite layers, most notably volcanic ash beds below the Niobrara B base.
Unmixing of water samples is accomplished utilizing each end-member as components that vary in the volume percentage they represent in an actual water sample. The application uses the estimated values for total salinity to normalize the relative abundance of the various ions for each sample so that the impact of each end-member sample is correctly weighted in calculated modeled water composition.
Figure 3 shows the output graphic solution for a water sample from the D-1XNH Niobrara B well. The volume percent estimated for each end-member is provided in the legend, as well as in the table below the radar plot. Also included in the table are the input values used for the estimated salinity of the formation water, the salinity of the water modeled and the salinity of the modeled solution.
FIGURE 3
Graphic Respresentation of Water Unmixing
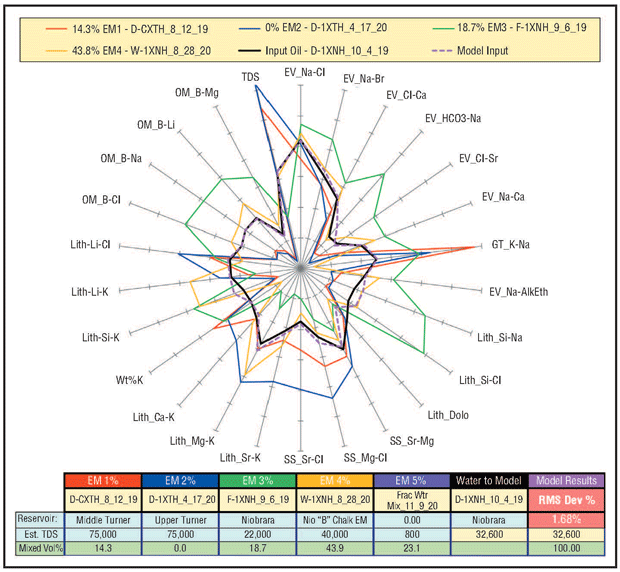
The end-member samples are the same as shown in Figure 1 and are represented by the red, blue, green and orange lines. The sample being modeled in the radar plot is represented by the black line and the magenta dashed line is the modeled solution that minimizes error. Observations include:
- The modeled water sample does not match any of the end-member samples;
- The sample to model falls within an envelope formed by the end-member with the highest value and the end-members with the lowest value for each axis; and
- The modeled solution closely follows the pattern for the sample that is being modeled (black) and error is low.
The results are consistent with a mixture from Turner, Niobrara Shale/Marl, Niobrara B and frac water. The sample, in Figure 2, also plots in the region where the composition of samples are typically mixtures of several sources, and since the quantity of Turner water used in the modeled solution is significant (~15%), it is a good indication that the stimulated rock volume extends to the Turner.
Multiwell Projects
The oil and water TLG study used a large set of water samples (350+) that were collected at varying stages of well production. TLG with water and oil allocation has been carried out to assess fluid flow at several multiwell development projects in the study area, including both single-zone and stacked-well development patterns.
As shown in Figure 3, TLG analyses resolved water mixtures of four contributing zones (Niobrara, Niobrara B, Upper Turner and Middle Turner), as well as the proportion of frac water. Oil time-lapse TLG can recognize Niobrara A Marl, Niobrara B Chalk, Niobrara C resistive, Upper Turner and Middle Turner components. The results show that the composition of produced fluids can be resolved with relatively few fluid end-members.
In a multizone stacked development plan, variations in fluid composition are explained by frac height and the potential contributing zones that are present within the SRV. To be an economic target, these zones need to have the development of matrix porosity over a contiguous zone of sufficient thickness, while between these zones, reservoir quality is typically much lower, corresponding to much less moveable fluid. Although the composition may vary significantly within lower-quality zones, they ultimately will not contribute significantly to produced fluids.
In contrast, within target zones that exhibit contiguous (mappable) matrix porosity, both oil and water diagenesis will be subject to similar fluid migration history, charging, maturity and fluid diagenesis. In better-quality reservoirs with higher productivity, all the factors that affect fluid diagenesis-whether for oil or water-lead to more homogenous fluids.
These factors seem to explain why mixing models of produced fluids generally are solvable using relatively few end-member components. Stated another way, for produced fluid composition, the potential target zones within the SRV are dominant, and within these zones, the moveable fluids are much more homogenous and lack fine vertical distinctions.
Figure 4 shows water and oil unmixing results for TLG studies of three wells. In the first two wells (D-1XNH and D-1XTH), early oil samples were destroyed during shipment and the green inverted triangles mark the time on the water allocation summary chart where the first oil sample analysis was available. For D-1XNH, the quantity of water had decreased greatly and was not sampled after Oct. 16, 2019, as shown by the blue inverted triangle on the oil allocation summary.
FIGURE 4
Water and Oil Allocation TLG Summary Charts
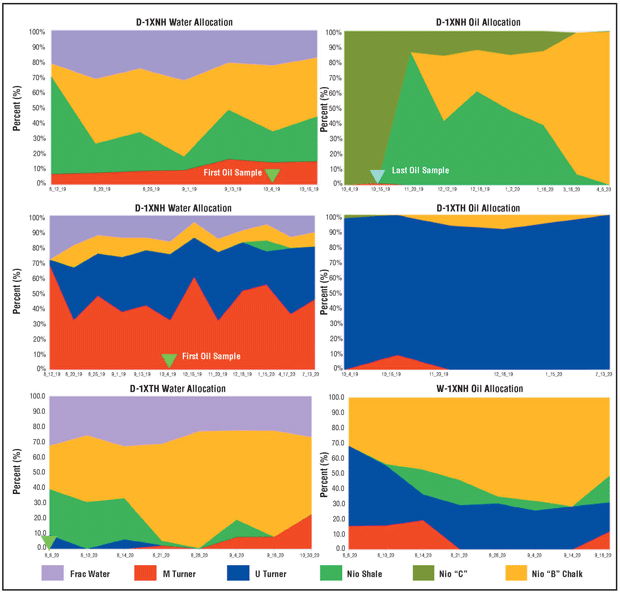
The green-filled area of the water allocation summary corresponding to the Niobrara Shale composition is probably representative of both Niobrara A and C formation waters. In the oil allocation summary chart, however, the Niobrara C composition is represented by the olive-green filled area and the green-filled area corresponds to the Niobrara A composition.
In general, results show that similar observations regarding fluid flow and the contribution of different zones are provided from oil and water TLG analysis. However, there can be significant differences based on the type of reservoirs involved, water-to-oil ratios, relative permeabilities, etc. In the end, the results from the oil and water TLG complement each other and provide a more thorough understanding of reservoir behavior.
During early flowback, these results provide evidence of frac height by understanding which zones contribute as part of the SRV. Monitoring the changes in fluid composition over time provides information regarding variations in the contributing rock volume and reservoir drainage, which can be used as input for future development planning and stimulation designs.
Well Results
The produced water for each well was dominated by the composition of formation water (more than 70% of flowback water by volume), and the quantity of frac water produced from the Niobrara wells was higher as a percentage than from Turner wells. For the D-1XNH Niobrara B, both oil and water time-lapse results indicate that the contributing rock volume is dominated by the target zone. For this well, only the last two water samples overlap with the first two oil samples, so the last sample from the oil time-series is six months later than the last water sample.
Having analyses from early oil samples would have been particularly interesting to compare with water samples, as water unmixing indicates a small volume of Turner water may be present in the produced water. In addition, later water samples may have shown a composition that is representative of only Niobrara B and makeup waters.
For the D-1XTH Upper Turner well, both oil and water allocation show the SRV extending from the Niobrara B to the Middle Turner. Again, because of the loss of early oil samples, there is more data for water allocation, but because Turner wells generally produce greater water volumes, the last sample dates for oil and water are the same.
As far as the fluid volumes, the stories for oil and water are somewhat different because oil composition clearly is dominated by the Upper Turner, while water composition is dominated by the Middle Turner with substantial Upper Turner contribution. This relates to the actual performance of these two reservoir intervals, where the Middle Turner has a higher water saturation and accompanying water-to-oil ratio, suggesting fluid communication between the Upper and Middle Turner was maintained during the sampled period.
The bottom oil and water summary charts in Figure 4 are from the W-1XNH Niobrara B well. The results from oil and water TLG show consistent behavior over time, with the produced fluids dominated by the Niobrara B target zone. In addition, the oil and water composition indicates communication was maintained with the Turner formation as part of the CRV.
Editor’s Note: For additional information on the Powder River Basin TLG study, see URTeC 5993, a technical paper presented at the 2021 Unconventional Resources Technology Conference, held July 26-28 in Houston. The co-authors acknowledge the technical contributions of Trevor Klaassen and Sean Bingham, and thank Devon Energy’s production, field and technical services staff for collecting and handling samples to obtain the high-quality results.

PETER JONES is on contract as a geochemist with Devon Energy’s integrated geoscience team, focused on the Powder River, Williston, Delaware Basin, South Texas, and Mid-Continent regions. Jones served for 23 years as a research geochemist at Saudi Aramco, where he developed innovative applications of reservoir rock pyrolysis. He also previously worked as a senior geochemical adviser for EOG Resources, and a geologist for Union Pacific Resources and Mustang Production Co. Jones holds an M.S. in geology from the University of Oklahoma.

DREW DRESSLER is a senior geologist in Devon Energy’s Rockies business unit. Prior to joining Devon in 2015, he worked at QEP Resources, where he had responsibilities for various assets spanning Utah, Colorado, Wyoming and North Dakota. Dressler is treasurer on the boards of the Oklahoma Geological Society and the Society of Petroleum Engineers. He holds a B.S. and an M.S. in geology from Oklahoma State University, and an MBA from Auburn University.

TYLER CONNER is a senior reservoir engineer in Devon Energy’s Rockies business unit. Conner previously worked in simulation and asset engineering roles for Devon in the Eagle Ford and Delaware Basin. He has extensive experience with technical projects, including numerical simulation, fluid sampling and PVT analysis, and rate transient analysis. Conner holds a B.S. and a M.S. in chemical engineering from the University of Utah.

JOSH O'BRIEN is a senior geologist at Devon Energy, where he works with the Delaware Basin subsurface team. He joined the company in 2017. With experience in the Powder River, Anadarko, and Delaware basins, O’Brien’s expertise includes core and facies description, process sedimentology, stratigraphy, data integration and reservoir characterization. He holds a B.S. in geology from Juniata College and a Ph.D. in geology from Iowa State University.
For other great articles about exploration, drilling, completions and production, subscribe to The American Oil & Gas Reporter and bookmark www.aogr.com.