


Tools Trace Contamination Pathways
By Richard R. Railsback
PLANO, TX.– Although hydraulic fracturing typically occurs in reservoirs located at depths thousands of feet below beneficial-use aquifers in the shallow subsurface, questions have been raised about potential impacts on groundwater supplies. Therefore, one of the oil and gas industry’s essential tasks is to figure out how and where gas, oil, and water migrate in the subsurface and around wellbores.
Numerous investigative tools are available for scientifically resolving the issue of whether an oil or gas well is responsible for contaminating a water well. Operators can utilize these tools to educate the public and landowners, promote and defend drilling programs, and defend against unfounded litigation.
None of these technologies is new (and many have been in common use for several decades), although they may not be familiar to the layman and to environmental consultants who have no specific background in oil and gas drilling and production. Every investigation will be unique, and the tools may be utilized in any sequence or combination that satisfies the operator’s needs and objectives.
The following list is loosely organized from simplest to most complex, and from least to most expensive methods:
- Proximity;
- Timing of the impact;
- Other potential sources of contamination;
- Oil/gas well records (casing, cementing, fracture, and completion information);
- Pressure data from the gas and/or water well;
- Data on fracture geometry;
- Natural gas and/or condensate composition;
- Water composition;
- Seismic data;
- Cement bond, noise, temperature and gamma ray logs;
- Radioactive tracers;
- Pressure interference tests; and
- Installing monitoring wells between the oil/gas well and the affected water well.
Proximity And Timing
Obviously, the closer a producing well is to a water well, the greater the likelihood of potential impact. Conversely, at some distance, depending on subsurface conditions and geometry, the likelihood of impact becomes improbable or even impossible.
The radius of producing wells’ influence has been the subject of extensive research and discussion within the oil and gas industry since its inception. What well spacing effectively drains a petroleum reservoir? More recently, the environmental industry has been concerned with questions about contaminants potentially migrating into water supply wells and other sensitive receptors. How far and fast can contaminants be expected to travel in the subsurface? Hard and fast answers have been elusive to both industries.
A well’s radius of influence depends on geology: porosity, permeability, pressure gradients, and special geologic conditions (faults, fractures, karstification, etc.). Based on case histories and observations of well behavior in both the oil and gas and environmental industries, some generally accepted empirical rules of thumb become apparent:
- Impacts are physically probable within 1,000 feet of a contamination source, if contaminants are introduced into the aquifer.
- Impacts are physically possible within 5,000 feet of a contamination source.
- Impacts are physically possible, but geologic conditions must be very favorable, within 10,000 feet of a contamination source.
- Impacts are not possible, lacking unusual geologic conditions, beyond 10,000 feet from a contamination source.
The next consideration is when the water well was impacted, relative to drilling and completing the oil and gas well. Installing a water well represents a single point in time (drilling and completion takes a couple days, at most). However, drilling and completing a gas well may occur over several months, beginning with spudding the well; followed by setting surface, vertical and horizontal casing; perforating and fracturing the well; flow back of frac water; and ultimately, oil and gas production. There are many scenarios for timing water well impact, relative to installing the gas well.
FIGURE 1
Sequence of Events Timeline
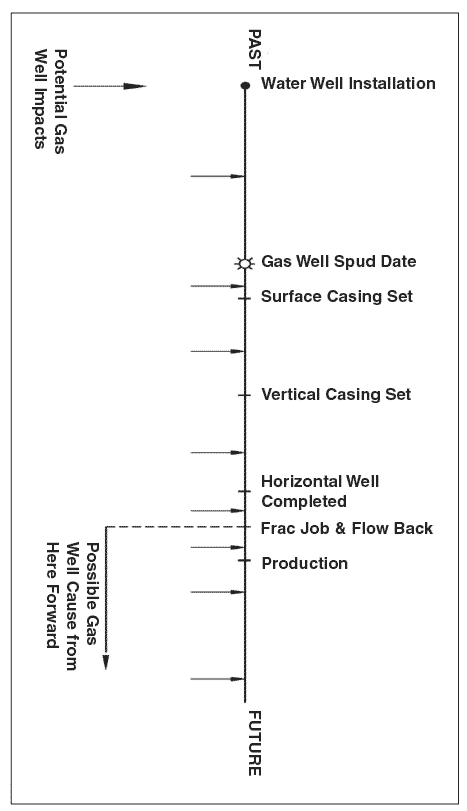
Figure 1 shows a timeline representing this sequence of events and different possibilities for the timing of the impact on a water well. The salient point is that water well impacts reported prior to fracturing the gas well cannot possibly be valid (with the exception of impacts caused solely by drilling fluids). Prior to fracturing, the oil and gas reservoir was not capable of producing hydrocarbons, and therefore could not possibly have contaminated an aquifer.
Other Contaminants
Are there other viable contamination sources (naturally occurring methane in the groundwater; organics in the well casing, pump and/or storage tank; underground and aboveground storage tanks; pipelines; septic systems; landfills; animal waste; etc.)?
Organic sources can generate nuisance amounts of methane in well water. Numerous potential sources also may exist for other contaminants. The marker laboratory analytes are total petroleum hydrocarbons (TPH); benzene, toluene, ethyl benzene and xylenes (BTEX); volatile organic compounds (VOCs), and polycyclic aromatic hydrocarbons (PAH). These analytes are primary constituents in crude oil and condensate, as well as in gasoline, diesel and other fuels.
FIGURE 2
Potential Contamination Sources
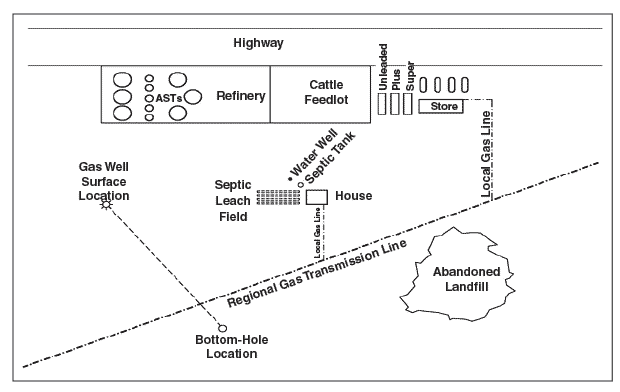
Figure 2 shows a hypothetical case with a number of potential contamination sources located in close proximity to the impacted water well. All the potential sources shown are shallow; i.e., within 50 feet of the surface. Significant beneficial use aquifers typically are located at least several hundred feet below the surface.
Physically transporting contaminants from these shallow sources into the deeper aquifers is often a problem because of impermeable layers of rock in the subsurface and/or the presence of a shallow, unconfined aquifer. The shallow aquifer limits the penetration of light, nonaqueous-phase liquids–which include the great majority of oil field and fuel contaminants–because these liquids will float on the water in the shallow aquifer.
Therefore, while multiple contamination sources may be located in close proximity to the impacted water well, a close examination of the subsurface hydrogeology often will eliminate these as potential contributors.
Records And Pressure Data
Detailed records (casing, cementing, fracture and completion information) are collected on every oil and gas well. Much of this is publicly available, and the remainder can be obtained from the operator. Can it be demonstrated that the well was drilled and completed properly and in accordance with all applicable regulatory guidelines? The answer, almost always, is yes.
The operator files these reports with a regulatory entity. This detailed well information is always useful in constructing a case that tracks the origin and pathway of potential cross contamination. Interpreting data from all the sources listed in this article depends on a detailed knowledge of the well configuration, and the location and size of the frac treatments applied to it.
Pressure gauges can be placed on all casing strings that are tied in to the wellhead xmas tree. Typically, a well will have pressure gauges only on the bradenhead and the tubing. Significantly elevated pressures on any of the casing strings (other than the tubing) may be indicative of a cement job breakdown and subsurface migration of gas and fluids in the annulus of the wellbore.
Many states require (or are considering requiring) operators to report significantly elevated pressure on the bradenhead and the subsequent investigation to determine the cause, as well as necessary corrective actions. For example, Texas rules state, “Any well showing pressure on the bradenhead, or leaking gas, oil, or geothermal resource between the surface and the production or oil string, shall be tested in the following manner. The well shall be killed and pump pressure applied through the tubing head. Should the pressure gauge on the bradenhead reflect the applied pressure, the casing shall be condemned and a new production or oil string shall be run and cemented. This method shall be used when the origin of pressure cannot be determined otherwise.”
Significant gas migration from deeper horizons into the shallow aquifer and the water well inevitably will result in elevated pressures (water levels) in the shallow aquifer and in the water well. Obviously, if the water level in the well was several hundred feet below the surface prior to drilling the gas well, and suddenly the water level is near the surface, the shallow aquifer has been pressured up by an external source.
Detailed documentation of water level changes in the water well can be very useful in these investigations. Unfortunately, these data are not often available.
Fracture Geometry
The operator will record detailed engineering data during frac treatments and also may record microseismic data. Pressures and flow volumes are recorded in detail during fracture treatment, and these data can be utilized to develop qualitative and quantitative information on the geometry and effectiveness of the frac job on each interval treated.
FIGURE 3
Microseismic Cross Section
Of Marcellus Shale
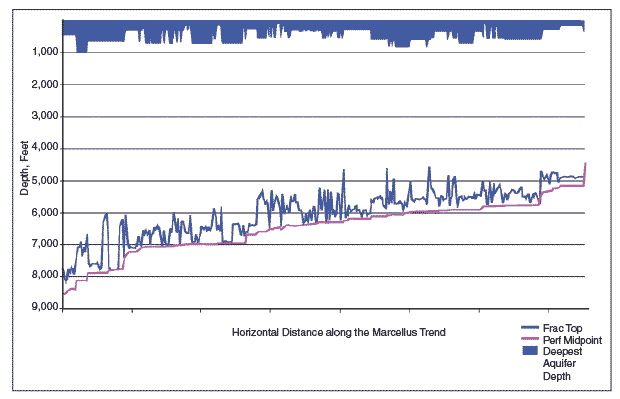
Figure 3 presents microseismic data from the Marcellus Shale. Depths to Marcellus productive zones vary across the trend from approximately 5,000 to more than 8,000 feet. The tops of the fractures, as recorded in the microseismic data, usually extend a few hundred feet above the perforations, and never extend more than 2,000 feet above the perforations.
The shaded area at the top of Figure 3 shows the depth to the deepest aquifer. The uppermost line at depth shows the top of fractures created during fracture treatment. At a minimum, approximately 3,500 feet separate the aquifer and the fractures.
A properly designed and performed frac job will not affect aquifers located several thousand feet above the fractured zone. Blaming the frac job for contaminating an aquifer is not scientifically defensible. Lacking very unusual geologic conditions (faults and/or natural fractures that extend from the producing horizon to the shallow aquifer), the only viable pathway from the deep reservoir to the shallow aquifer is the wellbore and the well’s annulus, which is cemented during drilling and completion.
Gas, Fluid Composition
A general differentiation between microbial gas (generated at shallow depths by the activity of micro-organisms) and thermal gas (generated at deeper depths by heat) can be achieved by analyzing the gas’s carbon and hydrogen isotopic composition.
FIGURE 4
Carbon Dioxide versus Nitrogen Content
In Barnett Shale
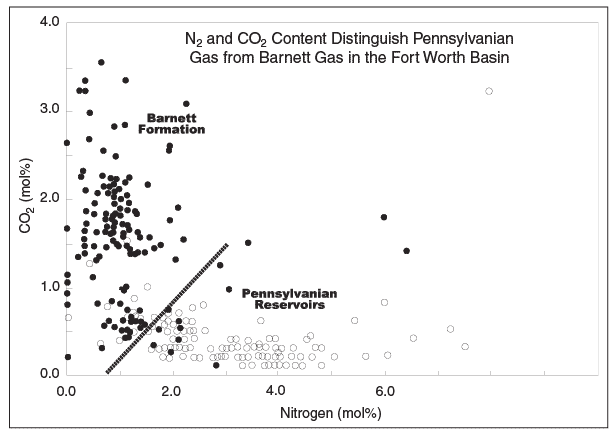
Nitrogen and carbon dioxide content also have been utilized to differentiate between deep and shallow natural gas sources. Figure 4 is an example of this analysis for the Barnett Shale and the shallower Pennsylvanian reservoirs in the Fort Worth Basin. Overlap in the data is present in this example, but the overall trends are apparent.
In this case, the operator demonstrated successfully that the natural gas in the shallow water wells might have originated from shallower Pennsylvanian rocks, which were adjacent to the aquifer in the subsurface, and not from the deeper Barnett Shale.
The presence of higher chained (heavier) hydrocarbon gases (ethane, propane, butane and heavier) is generally not consistent with microbially generated gas, which typically is 95 percent or more methane. Therefore, as a general rule, the presence of significant amounts (greater than 5 percent) of heavier gases is strongly suggestive of a deeper, thermogenic source.
TPH, BTEX, VOCs, and PAH are constituents of natural condensates and crude oils, and are utilized widely within the environmental industry as marker compounds typically watched for in soil and groundwater investigations. TPH typically is reported as concentrations in the gasoline, diesel and oil ranges. TPH also can be fractionated further into specific aliphatic and aromatic hydrocarbon ranges.
Any specific condensate or crude oil will have a definitive chemical fingerprint. This fingerprint may be matched with that of the hydrocarbons present in the free phase or dissolved phase in water. Care must be taken to account for weathering and other changes in hydrocarbon composition over time.
TPH, BTEX, VOCs, PAH, and methane and other hydrocarbon gases can be present in a dissolved phase in water. These hydrocarbon contaminants are not normally present in significant concentrations in water-well water. By definition, beneficial use aquifers and water wells do not contain significant concentrations of these hydrocarbons.
The hydrocarbon fingerprint of the dissolved-phase constituents in the well water also can be matched with the fingerprint of the condensate or crude oil and gas in the oil or gas well. Again, care must be taken to account for weathering and other changes in hydrocarbon composition over time.
Minerals and salts are dissolved in water also. By definition, drinking water typically exhibits a total dissolved solids count of fewer than 500 milligrams per liter and chloride counts of fewer than 250 mg/l. Water from deeper oil and gas reservoirs typically exhibits TDS and chlorides in excess of 20,000 mg/l. Although exceptions do exist, these generalizations are applicable over a wide range of geologic conditions.
Seismic And Log Data
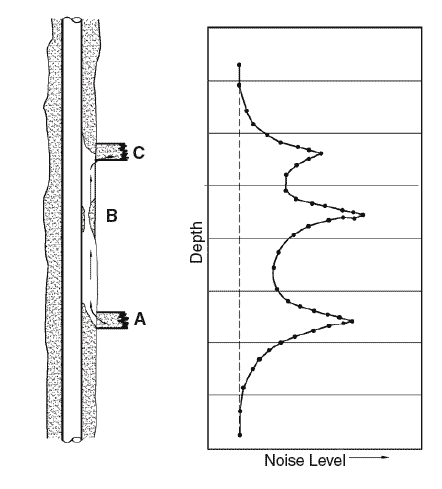
FIGURE 5
Noise Log
Significant accumulations of free natural gas in the shallow subsurface will have a definitive signature (“bright spots” or amplitude anomalies) on seismic data. Defining these accumulations with seismic data may be limited by the physical constraints of the data themselves and the focus of the data acquisition techniques; i.e., thin (less than 30 feet thick) accumulations of gas at shallow depths may not be discernible. Seismic data are available over most producing areas. The timing of acquiring seismic data relative to water well impacts will affect the applicability to any particular investigation.
A cement bond log is obtained with an acoustic (sonic) device that demonstrates cement bonding (or lack thereof) between the casing and the cement, and between the cement and the formation in the annulus of the well. Interpreting cement bond logs can be challenging, and no standard American Petroleum Institute scale exists to measure the effectiveness of a cement bond.
Many states are considering requiring that cement bond logs be run on surface casing for every oil and gas well drilled. Obviously, this would add the expense of the log and the downtime for the drilling rig to well costs. In addition, log interpretation is often ambiguous and the remedy (squeeze jobs where casing is perforated and cement is pumped into the annulus, followed by additional cement bond logs) may be quite expensive and time consuming.
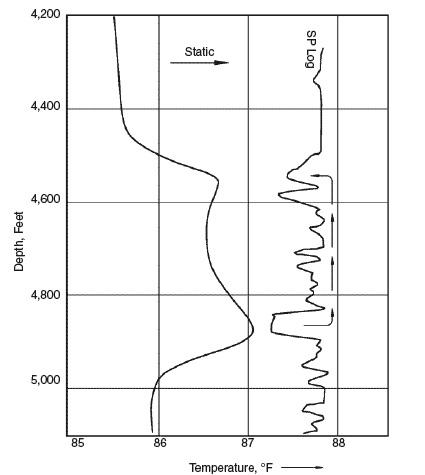
FIGURE 6
Temperature Log
Movement of gas and fluids within a well or behind casing creates noise, which can be logged by an underwater microphone (hydrophone). Figure 5 shows a typical noise log run over an interval where cross flow between zones is occurring through a channel in the annular cement job. The noise log will detect turbulent fluid or gas flow, gas expansion or contraction, and disturbances of gas/liquid interfaces, as well as flow within the wellbore or behind casing.
The migration of gas and fluids within a well or behind casing will cause measurable temperature differentials in the wellbore. Temperature normally increases with depth along a well-defined geothermal gradient. Temperature anomalies are created by fluids or gas entering the wellbore or annulus, or exiting into the formation.
Figure 6 shows a temperature log with two obvious excursions from the geothermal gradient, marking fluid or gas flow from one zone into the other. Temperature logs can be used to identify zones producing or taking fluids, evaluate cement jobs, and evaluate frac jobs. The U.S. Environmental Protection Agency’s underground injection control program approves using temperature logs to demonstrate injection well integrity.
FIGURE 7
Gamma Ray and Neutron Logs
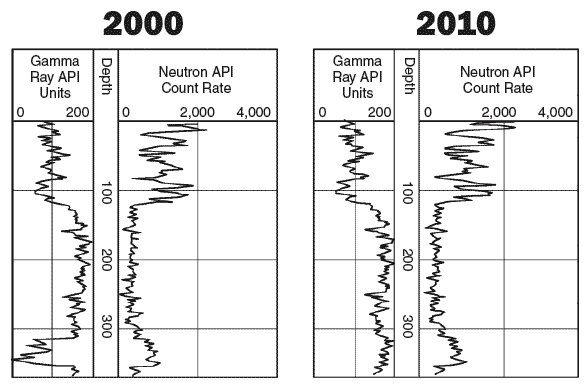
The migration of gas and fluids behind well casing will cause the deposition of salts and other minerals, which have higher than normal radioactivity. A gamma ray log measures natural gamma ray emissions from subsurface formations. Shales exhibit higher gamma ray emissions than sands and limestones because of the presence of clay minerals containing potassium and other radioactive elements.
Figure 7 shows two gamma ray/neutron logs run in the same well in 2000 and in 2010. The sand just below 300 feet displays a much higher gamma ray count in 2010, compared with the log run in 2000. Obviously, fluids have been migrating either into or out of this sand.
Gamma ray logs can be run in a cased hole, and are an inexpensive tool for tracking the potential migration of fluids in the subsurface adjacent to wellbores.
Radioactive Tracers
Radioactive tracers can be introduced into an oil/gas well and then monitored within and adjacent to the wellbore and/or a water well. The tracer is a radioactive isotope that is soluble in gas, oil and water. Iodine, which has a half-life of 8.1 days, typically is utilized for short-duration investigations, but a wide range of other isotopes are available for longer studies.
FIGURE 8
Radioactive Tracer Case Study
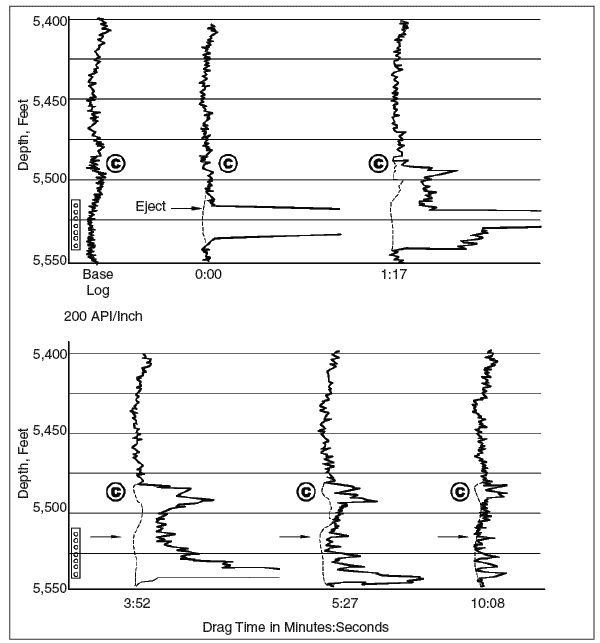
The gamma radiation emitted by the tracer is detected by a conventional gamma ray tool. The gamma radiation penetrates steel, PVC pipe, cement and formation, and 90 percent of the radiation recorded originates within one foot of the detector. Modern tools are capable of injecting the tracer and recording the gamma emissions simultaneously.
Fluid movement, velocity and volume can be monitored effectively within a well, behind casing, and between wells. Certain limitations are imposed by the geometry and physical characteristics of the specific system under study.
Figure 8 shows a case study where a radioactive tracer was injected into perforations between 5,500 and 5,550 feet deep. The gamma ray log is run at discrete time intervals after the tracer is injected. Zone C, just above 5,500 feet, clearly is taking fluid during the injection. After 10 minutes, the gamma emissions from the tracer are moving beyond the detection limits of the tool.
Utilized within the constraints of the specific physical system under study, radioactive tracers can be a powerful tool in resolving these cross contamination issues.
Pressure Interference, Monitoring
For pressure interference testing, a downhole pressure gauge is installed in the water well, and a pressure wave or series of waves is created in the oil/gas producing well by intermittently producing and shutting in the well. If the two wells are connected hydraulically, the pressure wave(s) generated in the oil/gas well will be recorded in the water well.
These types of pressure interference tests have been utilized in the oil and gas industry for decades to determine effective drainage areas and to resolve questions concerning reservoir continuity, proximity to faults, permeability barriers, etc.
This method of investigation is expensive and has rarely been utilized. As more precise data are required for increasingly more expensive environmental investigations and real or potential litigation, the use of pressure interference tests will become more prevalent. Pressure data are black and white (the predicted response is either there or it is not) and provide a definitive answer. The results of properly conducted pressure interference tests are extremely difficult to refute.
Installing and sampling monitoring wells completed in the same aquifer as a water well and located between the oil/gas well and the water well will define any area of contamination and migration pathways. This method of investigation is one of the most expensive and likewise, has rarely been utilized. Again, however, installing monitoring wells likely will become more prevalent, since they are one of the most definitive tools available for determining exact migration pathways to defend against possible litigation.
Editor’s note: The preceding article was adapted from an oral presentation at a joint technical conference sponsored by the Pacific sections of the American Association of Petroleum Geologists, the Society of Exploration Geophysicists, and the Society for Sedimentary Geology at the 2013 Pacific Section AAPG Convention, held April 19-25 in Monterey, Ca.

Richard R. Railsback is a professional geoscientist at CURA Environmental & Emergency Services in Plano, Tx. He has 34 years of professional experience in both oil and gas production and development, and environmental consulting. His oil field experience includes projects tracking the migration of fluids within reservoirs, and within and adjacent to wellbores, and planning and implementing hydraulic fracturing programs. Environmental consulting experience includes performing site assessments and remediation on petroleum hydrocarbon contamination at oil and gas producing, processing, storage and transportation facilities. Railsback holds a B.A. in geology from the University of Texas at Austin, and an M.S. in geology from Texas Tech University.
For other great articles about exploration, drilling, completions and production, subscribe to The American Oil & Gas Reporter and bookmark www.aogr.com.