


Velocity Modeling Method Optimizes Perforating, Staging In Unconventional Reservoirs
By Scott Taylor, Jeremy King, Ben Schaeffer, Todd Hibbitts, Lucas McGreaham and Khaled Ghuneim
HOUSTON–Perforation shots typically are used in conjunction with velocity information derived from sonic well logs to build a velocity model suitable for mapping microseismic events. These models typically assume lateral homogeneity, which may not honor the geologic properties of the medium being modeled. Despite considerable improvements in seismic data quality and imaging algorithms, velocities and earth models remain the key challenges for high-confidence (i.e., low-risk) depth prediction.
The key question is whether more value can be extracted from microseismic surveys across a broad spectrum of wells by simultaneously solving for a geologically meaningful 3-D anisotropic velocity model from both perforation shots and certain microseismic events themselves. More specifically, can elastic rock properties be extracted from microseismic data and be projected onto a high-resolution 3-D reservoir grid to guide reservoir development?
Tomographic inversion is used to generate velocity models, making measurements of seismic waves passing through a material. The character of these measurements is analyzed to make inferences on the material the waves passed through (velocity, density, etc.). The velocity of compressional (p) and shear (s) waves depends on the rheology of the material they travel through (density and elasticity). In short, variations in chemical compositions and thermal structure result in changes in velocity.
The goal is to deliver a petrophsycially meaningful microseismic 3-D velocity model that honors the highest order of anisotropy supported by the data, making it possible to extract additional value from higher-order anisotropy measurements in order to estimate the elastic rock properties that are critical to developing shale assets.
To test the premise and benefits associated with honoring an increasingly more sophisticated level of physics when building velocity models, varying levels of anisotropy were tested through tomography using a microseismic dataset for a horizontal well in the West Texas Wolfcamp trend. The results demonstrate that higher orders of anisotropy have increased perforation accuracy and aided in developing a geologically relevant velocity volume.
Utilizing this anisotropic velocity volume, rock property estimates were extracted from perforation data, adding interpretative value.
Accurate Velocity Modeling
The polarization vector of particle motion plays a fundamental role in processing and interpreting multicomponent borehole microseismic surveys. We propose that a reliable and complete hodogram analysis must consider the relationship between phase, group and polarization angles.
Anisotropic media present an added level of complexity by deviating the polarization vector from its isotropic direction. The presence of anisotropy may cause distortions to both the radiation patterns and reflection coefficients.
Incomplete modeling or appreciation of these interconnected parameters may lead to under- or overcorrected azimuth estimates, and overly simplified and unrealistic velocity models. Further in the workflow, this may bias or obscure valid smaller-amplitude microseismic events, and ultimately may lead to inaccurate and biased estimates of event locations. The net result of these errors can yield a suboptimal map of microseismic events.
Accurate effective velocity modeling also is essential for travel-time computations used for a least-squares minimization of localization. This study contrasts isotropic, fine-layer, effective medium modeling with one- and three-dimensional vertical transverse isotropy (VTI) anisotropic models. Forward modeling is performed by two-point ray tracing following Fomel velocity approximations. For modeling, layers are constructed with an arbitrary spacing, and the inversion is constrained by inequalities that impose smoothness between layers.
The most advanced case that one can attempt to solve highlights the benefits of moving to a fully elastic, arbitrarily anisotropic forward ray-tracing and inversion routine. This technique operates on the 21 independent elements of the stiffness tensor, and consequently permits not only a more accurate result, but sets the table to deliver advanced interpretative results that add significant value.
The general tomography workflow includes anisotropic log upscaling, split shear-wave picking, inputting perforation and events, ray tracing, sensitivity analysis, parameter restrictions, and updating the model/perforations locations.
Wolfcamp Case Study
The case for directly linking location accuracy to velocity model efficacy was demonstrated in the West Texas microseismic project. The lateral of the Wolfcamp “B” horizontal well is »6,000 feet long and follows a general northwest trajectory. It has a nearly horizontal profile. Lateral depth is »9,760 feet total vertical depth. The well was completed with 24 hydraulic fracturing stages.
The workflow generated a single geologically meaningful 3-D VTI velocity model that solved for all recorded perforation shots acquired from the well completion. The microseismic data were recorded over two weeks using two spatially dense, 40-level, three-component borehole geophone arrays in two offset observation wells located on either side (to the east and west) of the heel of the treatment well.
FIGURE 1
Localizations of 56 Imaged Perforation Shots In Isotropic Velocity Model
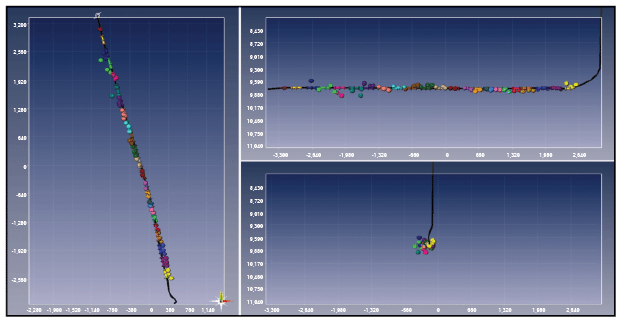
Figure 1 shows the localizations of 56 imaged perforation shots within an isotropic velocity model. There is clear bias at the toe in depth and azimuth. There also is an off-wellbore bias noted in a lineation from stages 9 through 24.
Since the perforation and microseismic signals are processed in the same manner, the average perforation location error is a proxy for the average microseismic location uncertainties. The total perforation errors ranged from a minimum of 22.4 feet to a maximum of 212.0 feet, with an average error of 75.8 feet and a standard deviation of 40.0 feet.
Originally, there was discussion about whether azimuthal anisotropy was the primary issue causing this problem. The total error developed from the initial isotropic model makes the results difficult to interpret, particularly at the toe of the treatment well. The decision was made to conduct further analysis to determine whether the results and the model could be improved by analyzing anisotropy.
This investigation determined that while azimuthal anisotropy could explain the absolute mismatch between two measurements of perforation locations for stages 13 to 24, the error could not be explained fully by azimuthal anisotropy, particularly from stages 3 to 12. So, azimuthal anisotropy played a role in the perforation localization mismatch, but it, alone, did not provide a definitive conclusion as to the root cause of the localization bias. Consequently, we would argue that an orthorhombic anisotropy is the minimum level of velocity model complexity to resolve this bias.
Reducing Localization Error
With such a narrow horizontal subtended angle from the ray paths developed from the aggregation of preformation shots, it was determined that it would be beneficial to leverage the larger vertical aperture and attempt to revise the initial isotropic velocity model. Both 1-D and 3-D elliptically anisotropic VTI models were developed by inverting the measured velocities in a single model from all imaged perforation shots.
Note that as a result of enhanced adaptive signal processing, the total number of imaged perforation shot localizations increased from 56 to 59.
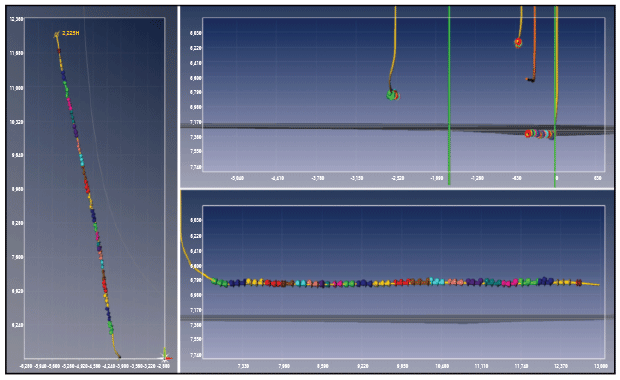
FIGURE 2
Final 1-D (left) and 3-D (Right) VTI Velocity Profiles
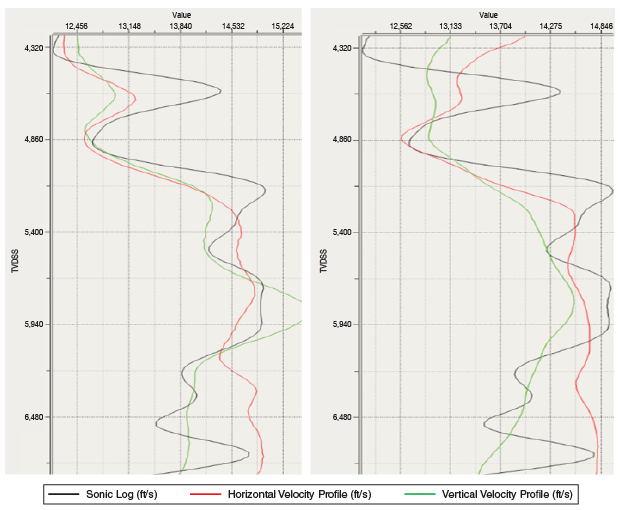
Figure 2 is an example of this effort. It shows the final VTI velocity profiles in depth as an extraction at the x-y location of the treatment well. The curves represent sonic velocity (black), horizontal velocity (green), and vertical velocity (red). The 1-D VTI profile is displayed at left and the 3-D VTI profile is at right.
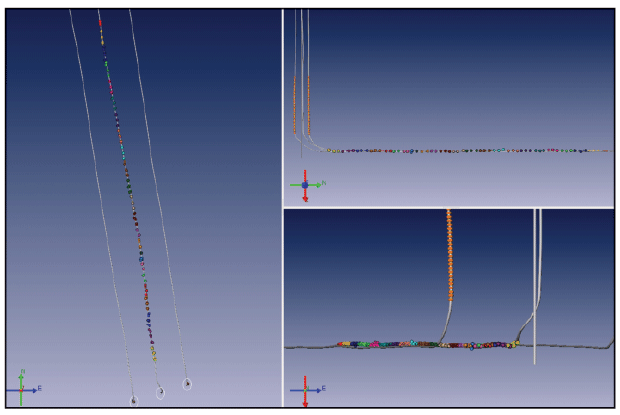
A key quality assurance step in constructing a velocity model for microseismic localization is maintaining consistent flatness of the travel-time corrected move-out for both arrays, and for all recorded perforation shots. Figure 3 shows ray paths and 3-D VTI model move-out corrected gathers of a perforation shot from stage 9 in the midlateral section of the well.
FIGURE 3
Ray Paths and 3-D VTI Model Move-Out
Corrected Gathers of Perforation Shots from Stage 9
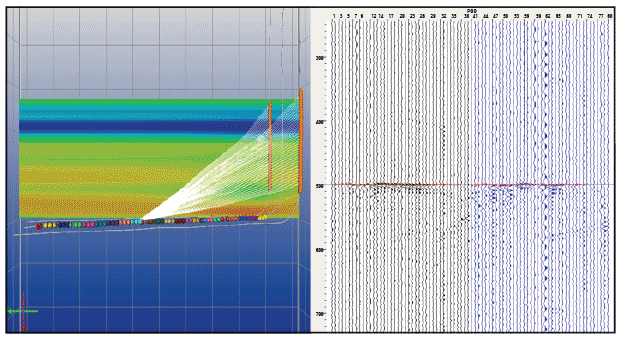
Note the contribution of the two large vertical aperture arrays and the flatness of the perforation shot. The deepest receivers of the left observation well flattened as a result of slight lateral velocity variations. The global root mean square error across both gathers was 0.506 milliseconds.
Implementing a single (unified) 1-D elliptically anisotropic velocity model reduced localization error from a median of »75 to »32 feet, compared with a 1-D isotropic velocity model. Minimizing localization error ultimately provides a more robust platform on which to perform a reliable and competent engineering interpretation. In particular, the toe stages no longer had localization ambiguity and could be interpreted with confidence.
Events were detected using a technique that seeks a parametrically weighted agreement or weighted semblance between the modeled versus observed move-out of compressional and shear waves, respectively. The algorithm can trigger on compressional, and both horizontal and vertical shear-wave modes.
There is noted sensitivity between the number of valid event detections and the minimization of the residual error in a velocity model. This observation was evident in the data. The 1-D anisotropic model permitted the population of valid event detections and localizations to increase from 1,675 to 2,344.
Key Improvements
The key improvements to processing this microseismic dataset with an anisotropic velocity model include:
FIGURE 4A
Perforation Localizations in Isotropic Velocity Model
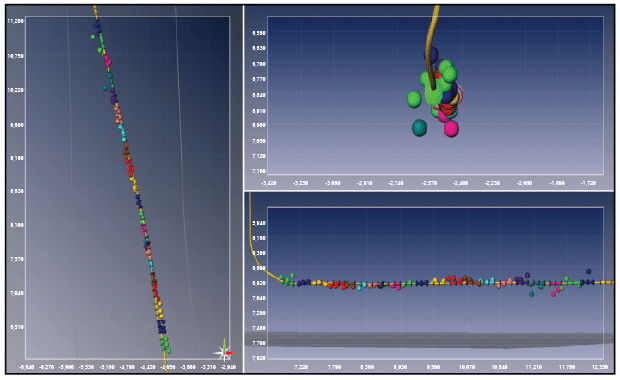
FIGURE 4B
Perforation Localizations in Anisotropic 1-D VTI Velocity Model
- Reduced perforation localization error in all three dimensions;
- Detection of more valid events;
- More robust interpretation of microseismic azimuths by stage;
- More complete and reliable fluid system analysis with better containment;
- More complete and reliable distribution by formation analysis with evidence of less downward growth; and
- Extraction of geologically relevant rock properties from near- and far-field microseismic events.
Figures 4A and 4B show the perforation localizations within the isotropic velocity model and the reprocessed perforation localizations mapped within the anisotropic 1-D VTI velocity model. Figure 5 shows the perforation localizations contrasted again within the anisotropic 3-D VTI velocity model.
Utilizing the 3-D VTI inverted velocity volume, the effective p-wave and s-wave velocities were extracted at each perforation location along the treatment lateral. A computation of vertical Poisson’s ratio at each perforation interval was performed and plotted with respect to measured depth. Sonic data from a nearby vertical well validated the geological relevance of these estimates.
FIGURE 5
Perforation Localizations in
Anisotropic 3-D VTI Velocity Model
Results from studying varying levels of anisotropy through tomography on the microseismic dataset from the West Texas Wolfcamp horizontal well demonstrate that higher orders of anisotropy can increase perforation accuracy and aid in developing a geologically relevant velocity volume.
Three-D anisotropic velocity modeling delivered more confident microseismic results and illustrated the potential for advanced reservoir property analysis. Utilizing the anisotropic velocity volume, directional elastic moduli and key rock property estimates were extracted from perforation data, which added interpretative value.
Subsequent work will extend these estimates volumetrically, including the microseismic events in the near- and far-field. Additional planned work includes building a single 3-D orthorhombic model to simultaneously solve for p-wave, horizontal s-wave and vertical s-wave velocity, and to contrast the results to the 3-D VTI velocity model.
SCOTT TAYLOR is technical account manager at SIGMA3. He joined the company in 2012, and subsequently served as operations manager and global director of microseismic and borehole imaging. Taylor holds degrees in finance and business administration from American University Moscow, Franklin College Switzerland, and Touro College.
JEREMY KING is product manager of near-wellbore imaging at SIGMA3. He joined the company in 2012 as a staff geophysicist and subsequently served as a research geophysicist. King holds degrees in geophysics and physics from the University of Houston and the University of Wyoming.
BEN SCHAEFFER joined SIGMA3 in 2014 as a geophysicist after beginning his career as a geophysical analyst at ESG Solutions. Schaeffer holds a B.S. in geophysics from the University of Alberta.
TODD HIBBITTS is senior geophysicist and microseismic operations lead at SIGMA3. With 20 years of experience, he previously worked as a senior geophysicist or data processing geophysicist at Fusion Petroleum Technologies (acquired by SIGMA3 in 2011), 3-D Geo, Weinman GeoScience, Paradigm, and WesternGeco. Hibbitts holds a B.S. in physics from Texas A&M University-Kingsville.
LUCAS MCGREAHAM is a geologist at SIGMA3. Before joining the company in 2014, he served as a geologist at Columbine Logging Inc., a project geologist at Rock Oil Company, and a landman at Kosco Energy. McGreaham holds a B.S. in geological sciences from Michigan State University.
KHALED GHUNEIM is operations manager at SIGMA3. He joined the company in 2013 as a geophysicist and microseismic team lead. He began his career as a geophysicist at MicroSeismic Inc., and subsequently served in technical and management roles at Gardline Geosciences, Halliburton, Rock Solid Images, and GP & Son LLC. Ghuneim holds a B.S. in geophysics from the University of Houston.
For other great articles about exploration, drilling, completions and production, subscribe to The American Oil & Gas Reporter and bookmark www.aogr.com.