


Wireline Fiber Optics Reveal Key Design Insights For Haynesville Completions
By Mark Weber, Dustin Weatherly, Veronique Mahue and Robert Hull
HOUSTON–Rockcliff Energy is leveraging advanced drilling and completion technologies to continuously improve well performance and optimize its development program across an approximate 158,000 net-acre position prospective for the Haynesville Shale play out of an overall approximate 280,000 net-acre position in East Texas. The objective is to drive the ongoing evolution of hydraulic fracture completions in the Haynesville by leveraging more rigorous engineering to improve treatment designs.
Some of the changes over the last few years have come in the form of increasing lateral lengths and decreasing cluster spacing. In 2021, Rockcliff extended average lateral lengths from 9,000 feet to nearly 10,000 feet, with several laterals exceeding 12,000 feet. A longer lateral means more pay zone contacted per wellbore and fewer rig moves. The downside is often increased heterogeneity along a longer wellbore length and uneven production from heel to toe. If maximizing production along the lateral can be improved, the enhanced profitability from increasing lateral lengths can be enhanced.
For perforation clusters, the question is, how close is too close, and does decreasing cluster spacing to a certain length improve well profitability and add to estimated ultimate recovery, or create potential challenges? Tighter spacing demands more emphasis on uniform fracture geometry to avoid fractures interfering as a result of stress shadows, which can lead to decreasing fracture widths and uneven cluster development impacting offsetting wells.
Stress shadow interference also can cause runaway dominate fractures. One potential design change to battle against dominate fractures is to decrease the perforation density per cluster, creating some level of “limited entry” as well as diverters. Doing so increases the pressure across the perfs, which may help ensure even flow into each cluster during treatment. Finding the right balance of stage and cluster spacing has a lot of potential if optimized for the well, reservoir and current economic environment.
However, quickly finding the ideal lateral length and perf cluster design for the economic conditions requires a diagnostic tool that can tie those design changes back to production in near real time. One such solution is fiber optic sensing, which simultaneously can measure all events happening along the entire wellbore with little interference to the true production flow regime during inflow, while also maintaining high spatial resolution down to the cluster level.
To take its lateral length and perf cluster designs to the next level, Rockliff used wireline-deployed fiber optic cable to monitor the production of a hydraulically fractured horizontal well so that the insights could be applied to the 40+ horizontal wells it completes annually within its large East Texas acreage position. In this area, the Haynesville is located at approximately 11,000 feet true vertical depth, making it a high-temperature (300+ degrees Fahrenheit), predominantly dry gas-producing reservoir.
The well was producing for one month before intervention to install the distributed acoustic sensing (DAS) and distributed temperature sensing (DTS) wireline-deployed fiber optic cable. The temporary fiber optic line was conveyed down hole using a tractor and left in the wellbore over two and a half days.
Production Uplift
The focus of the test was to optimize the completion design by varying the amount and distance between clusters of perforations along a section of the wellbore in an effort to discern their effect on production. Production allocation then was quantified for both individual stages and perforation clusters. Results show that the stages with an increased amount of clusters exhibited greater uniformity and produced 140%-175% more, depending on the choke setting. Additional data and time are needed from full wellbore tests to confirm if incremental production uplift accelerates production or adds to the estimated ultimate recovery.
With fiber optics, simultaneous measurements of acoustic fields (DAS), strain (distributed strain sensing, or DSS), and temperature (DTS) along the horizontal distance of the fiber can be made instantaneously at the speed of light. Fiber traditionally has been placed in the well permanently by clamping and cementing a tubing-encased fiber in place on the outside of the casing. “Engineered” fiber is now able to be placed inside a wireline cable that can be deployed inside the casing to acquire data, and then subsequently retrieved for use on additional wells. Temporary deployment gives an operator more flexibility to diagnose other wells of interest rather than only a few with permanent fiber.
Moreover, improvements in the surface interrogator hardware and enhanced engineered fiber design boost the signal-to-noise level by 20 decibels (100 times) compared with standard single-mode fibers.
Fiber data is a distributed measurement, meaning at every meter along the optical fiber acoustic, strain and temperature data can be acquired. The fiber optic system, which includes the surface fiber optic sensing interrogator unit (laser) and the actual fiber itself, measures those physical properties at multiple sampling locations along the fiber.
For this Haynesville project, the plan was to record at a gauge length (or measuring length of the fiber covering multiple sampling locations) of 10 meters and 2 meters using two single-mode engineered DAS fibers and a DTS fiber in the same wireline cable. However, plans were changed during the job because of equipment availability, so that data was recorded only on a 10-meter (32.8-foot) gauge length DAS fiber with a spatial sampling interval of 0.25 meters. The physical property output (acoustic, strain, temperature) is measured at the gauge-length level, and not at the sampling location level.
Project Setup
A coiled tubing clean out operation was performed before logging the well to increase the chances of reaching the toe without experiencing increased friction caused by solid materials and well tortuosity along the wellbore. A high-temperature tractor was chosen to pull the wireline fiber to the toe. The tractor was ultimately able to pull the wireline fiber to a total depth of 20,700 feet, allowing production to be measured from all but the first six stages of the 99-stage wellbore.
Although the wireline fiber cable with the 2-meter engineered fiber was not available, the 10-meter gauge length fiber provided the benefit of measuring flow from very low producing clusters but could not fully isolate inflow to an individual cluster. The engineered DAS fiber was sampled at 5 kilohertz with a spatial sampling of one meter and the DTS data was recorded at one meter spatial sampling.
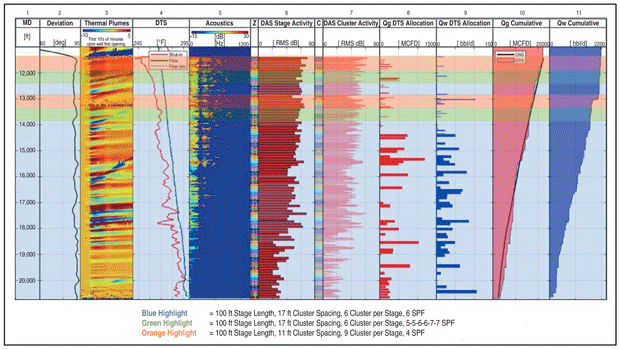
The well had been fracture stimulated using a slickwater fluid system with diverters designed for 10,000 barrels per stage, 160,000 pounds of 100-mesh sand per stage, and 194,000 pounds of 40-70 mesh sand per stage for all 99 stages. The cluster design was identical across stages 1-74, but a variable design was implemented for stages 75-99. Stages 1-74 all contained six clusters at six shots per foot, with an average cluster spacing of 17 feet. The variable design of stages 75-99 included nine clusters per stage (11-foot cluster spacing) with 33% fewer shots per foot and a tapered perf design to promote greater uniformity. Regardless of design, entry-hole diameter and the total amount of shots per stage (36) were kept constant.
Stage 100 was left unfractured to later be used as a baseline measurement for a separate camera project. One of the focuses of the production monitoring test is to investigate if there was a noticeable change in production at the location of the stages with shorter cluster spacing and shot reduction designs.
Production Monitoring Objectives
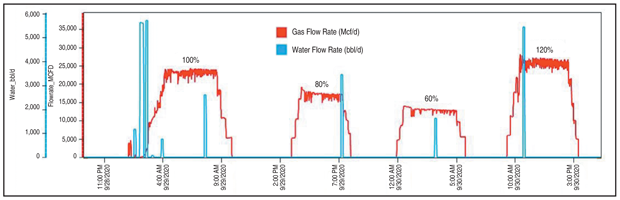
A total of 60 hours was allotted to produce the well at variable rates. Four opening and closing sequences were chosen to capture any production changes. The four opening steps had four unique choke settings starting at 100% open (the normal operating choke size setting at this point in the well life cycle), dropping to 80%, then 60%, and finishing at 120%. At each opening, the well produced long enough to ensure a sufficiently stable flowing regime to perform production analysis, and in this case, four hours sufficed.
Figure 1 displays produced gas and water flow rates at surface. The choke setting is marked above each flowing period. The production data is crucial for calibrating the thermal DTS model. The period selected for calibration was the 100% open choke setting (the normal operating choke size). During all periods, the water flow was captured downstream of a dump-valve, causing “spikes” in water flow that are not representative of the actual flow rate. Also, the well was slugging as noted later in the DAS and downhole pressure data. To account for this, a stable flow period the week prior at the 100% open choke setting is examined. A very stable water flow rate of 2,000 bbl/d was found and this value was used in the DTS model.
FIGURE 1
Gas and Water Flow Rates Measured at Surface
The goal of the test monitoring program is twofold and examines production at the wellbore, stage and cluster levels to determine two-phase production allocation, and stage and cluster design effectiveness.
Two methodologies were employed to quantify inflow performance:
- DAS-based acoustic noise logging to allow for a near-cluster level inflow performance assessment; and
- Thermal modeling to allow for stage-by-stage multiphase allocation.
The data processing workflow for multiphase allocation typically combines DAS derivates such as acoustics spectral noise logging, sound speed analysis and thermal plumes analysis to constrain an enthalpy balance based thermal model.
The sound speed analysis did not reveal any propagation throughout the horizontal section and therefore could not be used for fluid composition trending and as an input to the thermal model. The very high number of closely spaced perforations were likely to be the reason for the strong attenuation of the tube waves.
Thermal Modeling
The thermal model considers essential well information, including a well diagram, fluid properties, deviation survey, surface rates and other reservoir information that can help reduce the uncertainty of the model.
Building and running a thermal model in an unconventional horizontal well with hundreds of fractures represents a challenge, since even after one month of production, the well still exhibits particular temperature features that resemble the temperature changes induced by the stimulation and fracturing process. This means there can be specific depths in the DTS trace that could resemble a Joules-Thomson cooling effect, yet they are temperature cooling remnants induced by stimulation fluids. These lingering stimulation features can affect the spatial derivative calculation in the thermal model and allocate a larger amount of production to a zone that is not necessarily a high production contributor. This is where DAS derivatives play an essential role in constraining and tuning the thermal model.
The model then was further constrained for multiphase allocation using DAS derivatives transient thermal plumes from shut-in to flow, slow-strain root-mean-squared (RMS) waterfalls during stable flow, and acoustic spectral activities. Dual-speed thermal plumes were utilized for two-phase fluid entry point identification and the slow strain waterfalls to identify the main flow regimes. The main water entry points identified were then included in the water profile for the thermal model.
Due to limitations in the simulation running time for the thermal model to reach convergence and the very high amount of stages and clusters, the thermal model was built to perform a stage allocation from stages 7-69 and to perform a cluster level allocation toward the heel from stages 70-99.
Analysis And Results
The thermal plumes created during the initial well opening (100% normal operating choke setting) and for seven hours following are displayed in the expanded slow-strain DAS RMS amplitude waterfall plot in Figure 2. Immediately upon opening, thermal plumes were spotted as hotter reservoir fluid entered the wellbore and caused a thermal strain on the DAS fiber.
FIGURE 2
DAS Slow-Strain Plot (0-1Hz)
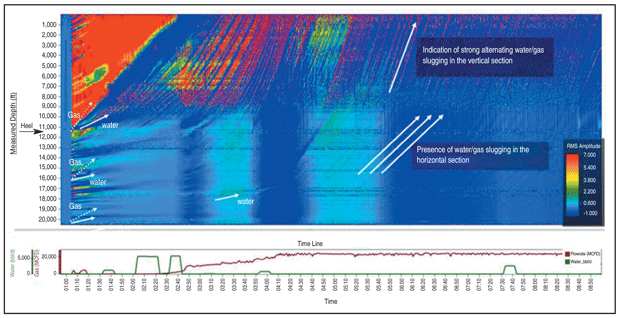
Just after well opening, dual plume velocities can be observed, as annotated by the “water” and “gas” white arrows, showing the initiation of split velocities, where the gas phase moved faster along the horizontal than the water. These features were utilized to detect the main water entry points to the production and to constrain the thermal model.
Also visible in Figure 2, and annotated by the long white arrows, are continuous water slugs observed immediately after the opening of the well. The alternating gas/water interfaces can easily be tracked along the horizontal and their strength and speed intensify within the vertical section of the well. The water slug was able to be moved by reservoir pressure early on in the well’s life, in this case one month, while flowing 24,000 Mcf/d at the 100% choke setting. Although later, once pore pressure is depleted and gas velocity slows, there may not be enough energy to move those water slugs, potentially shutting off certain clusters or sections of the lateral.
Downhole pressures and temperatures were recorded using gauges attached to the bottom-hole assembly. At each choke opening (60%-120%), pressure drawdown was seen immediately. The nonconstant slope of the pressure drawdown suggests water slugging was occurring. At the 120% choke setting, a much higher pressure drop was observed compared with the other choke settings. The pressure downhole built to nearly the same level during each closure period. Furthermore, the temperature initially increased a few degrees on opening the well and then decreased slowly.
The final composite allocation result shown in Figure 3 for all stages includes thermal plume and spectral noise log DAS derivatives, averaged DTS traces, and production allocation from the thermal model. It can be noted that the simulated trace output by the thermal model shows a good match with the measured DTS flowing trace. The allocation track also shows the cumulative gas allocation obtained from the DAS spectral noise logging (black line on Qg cumulative track 10). Both the cumulative production allocation obtained from the thermal and spectral noise models appear to follow the same trend, with some exceptions toward the toe stages. When examining the DAS Stage Activity (Track 6), uneven production was seen along the lateral, specifically at the toe.
FIGURE 3
DAS and DTS Cumulative Composite Production Allocation for all Stages (100% Open Choke)
The main takeaway from the production analysis is the increase in production at the locations of the higher cluster density stages. The 11-foot spaced, nine-cluster design produced significantly more than the 17-foot spaced, six-cluster designs, even though the stage length and the amount of fluid and proppant pumped were equivalent. When looking at the test interval (Stages 70-99) at the 100% open choke setting, the nine-cluster stages produced 140% more compared with the two other designs on a total Mcf per stage basis.
Interestingly, when production is viewed on a per cluster basis, the gas inflow is relatively flat across the entire test interval. By taking an agnostic approach to viewing cluster-level production without the constraints of spacing or stage location, this flat production profile seems to indicate effective treatment was achieved across all clusters, regardless of the amount of clusters within a given stage.
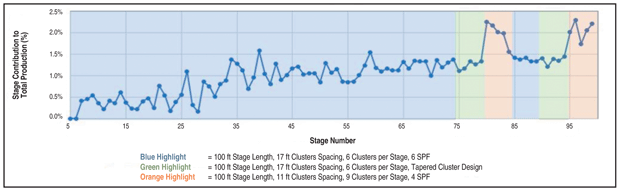
The production comparison analysis concentrated on Stages 70-99, so that uneven production between the toe or the heel did not play a factor. Figure 4 breaks down production by stage as a percentage contribution to total production. In our analysis, after producing for one month, stages 1-34 contribute only 15% of the total production, while constituting 34% of the lateral.
FIGURE 4
Percentage Stage Contribution to Total Production using DAS Allocation Data
Local areas along the lateral may lead to uneven production because of wellbore placement and other factors. The staggered completion design between the nine-cluster and six-cluster designs reduces, but does not eliminate, the risk of misinterpretation because of factors outside of the control of the fracture design (wellbore placement, plug failure, surface operational issues, etc.). Such data, along with the separately acquired downhole camera data, can be tied into the production data for the well over a longer period for a more detailed quantitative assessment.
One other point to consider for future studies is the increased noise measured by DAS toward the heel because of the accumulation of flow along the lateral. Although not a major contribution to the DAS signal, which is mostly caused by flow through the perforation, normalizing the DAS flow calculation along the lateral in relation to the cumulative flow can result in a more precise measurement.
Very Positive Change
The production uplift from the nine-cluster, four shots per foot design, along with the inclusion of the separately acquired camera data, provided Rockcliff all the support it needed to make a go-forth design change. However, in lieu of simply tightening the cluster spacing to 11 feet, Rockcliff opted for a more cost-effective approach and decided to employ the 9x4 design on 150-foot stages, a 50% increase in stage length over the previous base design of 100 feet. By making this design pivot, Rockliff maintains its base cluster spacing of 17 feet while realizing a significant reduction in capital from the reduced amount of stages per well, providing a quick return on investment for the fiber optic deployment.
The 9x4 perforating scheme in a 150-foot stage length has been applied to all current frac treatments, and is providing promising results with little to no degradation in performance.
The latest successes have led Rockcliff to continue to push the envelope by conducting additional testing with even more clusters per stage and potentially tighter cluster spacings. We believe we can achieve the same, if not better, stimulated reservoir volume as our previous stage length design of 100 feet without sacrificing short-term or long-term well performance.
However, it should be noted that the production log tells us only the production at one point in time, and in this case, over 2.5 days after the well has been producing for a month. Will the production uplift from the nine-cluster design be the same years from now or perhaps regress back to the level of the six-cluster designs? What fracture reservoir flow regime is observed? And how is the EUR affected?
To answer some of these questions, an operator can, for example, acquire another production log to see if those designs are continuing to perform well. Another production log will reduce the uncertainty in whether the increased amount of clusters per stage is affecting EUR and/or production. To elaborate, if an operator sticks with 100-foot stages, a denser fracture network may lead to accelerated production while in a formation linear flow regime, but it is uncertain without more data if it will add to EUR once pseudoradial flow starts. Additional production data and a pressure transient test may be able to identify the flow regime to better answer this question.
Recording DAS simultaneously on a two-meter gauge length, as originally planned, may have offered additional insight because the shorter gauge length can allocate production to an individual cluster rather than averaging production of two or more clusters across a gauge length. But the longer gauge length did bring considerable insight because it is able to measure production at extremely low flow rates that are normally invisible when using shorter gauge lengths. Recording at long and short gauge lengths simultaneously, as originally planned, would have given the best of both fiber systems.
An extremely positive 140%-175% production uplift was observed from the nine-cluster design compared with the six-cluster designs at various choke settings by the wireline fiber optic cable. While uncertainty remains whether the higher cluster density stages will continue to perform well across the entire life of the well, the positive insight gained from this diagnostic job will be used to optimize future designs to right-size the completion to the economic environment.
Editor’s Note: The authors acknowledge the key contributions of Silixa’s Kirk Trujillo, Rob Bohn and Erick Jimenez to the success of this project. They also thank the field engineering and technician team led by Ben Wygal, Guillermo Raya and Mayte Rios Lopez for acquiring the data, as well as Sina Hafezi for his initial input to data analysis. The preceding article was adapted from URTeC 5512, a technical paper originally prepared for presentation at the 2021 Unconventional Resources Technology Conference.
MARK WEBER is a completion design engineer at Rockcliff Energy LLC in Houston. He has more than 10 years of experience as a completion, production and reservoir engineer in the Haynesville, Bossier, Eagle Ford and Marcellus shale plays. Weber’s specializations in unconventional resource development and recovery include frac surveillance and design optimization, parent/child well interference mitigation, capital budgeting and artificial lift design. He holds a B.S. in petroleum engineering from the University of Texas at Austin.
DUSTIN WEATHERLY Is completions and production engineering manager at Rockcliff Energy. With more than 20 years of experience, he began his career as an in-house engineer at American Energy Services/Key Pressure Pumping, and subsequently served in completions engineering roles at ConocoPhillips, Petrohawk Energy, Nemaha Oil & Gas and Wagon Wheel Exploration. Weatherly holds a B.S. in engineering from Southwestern Oklahoma State University and an M.S. in engineering and technology management from Oklahoma State University.
VERONIQUE MAHUE is head of data services and flow applications principal at Silixa Ltd. She joined the company in in 2011 as an acoustic research and development engineer, and has served as data science lead, R&D lead engineer (upstream), and senior development engineer. Mahue holds an M.S. in engineering and physics from the Institut National Polytechnique de Grenoble, and a Ph.D. in physics and bioengineering from Imperial College London.
ROBERT HULL is a consulting senior geophysical adviser at Silixa. With more than 30 years of experience in microseismic acquisition design and interpretation, fiber optic fracture imaging, and geomechanical modeling, Hull previously served as senior geotechnical specialist at Pioneer Natural Resources, where he applied fiber optic, microseismic and geophysical imaging techniques in the Permian Basin. Hull holds an M.S. in geosciences.
For other great articles about exploration, drilling, completions and production, subscribe to The American Oil & Gas Reporter and bookmark www.aogr.com.