


Electric Frac Spreads Gradually Pick Up Speed In Highly Disciplined Market
By Matt Johnson and Mark Rossano
Electrically-powered hydraulic fracturing spreads have demonstrated the potential to transform well site operations. By sourcing electricity from turbines or power generators that run entirely on natural gas, or less commonly from grid power solutions, electric fleets can get the job done with lower fuel costs, a smaller environmental footprint and reduced noise levels. These advantages align well with the industry’s increasing emphasis on sustainability and efficiency.
But despite their strengths, which will only grow as they continue to evolve, electric fleets have a limited market presence, accounting for roughly 8% of the overall frac spread supply. In the past few years, the market has added only a few electric spreads, indicating a relatively moderate adoption rate.
Why has adoption been so deliberate and methodical?
The pandemic acted as a double-edged sword, intensifying capital constraints while simultaneously igniting a renewed sense of urgency for the world to move away from carbon. To secure profitability, upstream participants faced the dual imperative of controlling margins and demonstrating environmental progress. Instead of investing in new technologies, most companies strategically favored bridge technologies such as dual-fuel conversions. Pressure pumpers effectively addressed post-Covid challenges by extending the lifespan of their marketed frac spread supply while significantly advancing ongoing sustainability efforts.
Another factor limiting the adoption rate is the technology’s youth. The industry has yet to settle on the best approach to building and powering electric fleets. One company relies on grid power and another is developing proprietary technology, while a major player prefers acquiring equipment through consolidation. The transition from diesel to electric technology is overarching, but a clear winner in terms of intellectual property has yet to emerge.
As the world demands adaptation from the oil and gas business, the pace of technological adoption will be slow without sufficient capital and consensus. The industry is still in the innovation phase. Electric fleets eventually may contribute most of the active horsepower, but it is far too soon to tell when that may occur.
In the meantime, the industry will continue the move to dual-fuel engines that burn a combination of natural gas and diesel. Though some Tier 2 equipment remains in the field, most spreads run on Tier 4 engines and will be converted to Tier 4 dynamic gas blending as the opportunity presents itself. In addition to improving environmental performance, displacing diesel with natural gas significantly reduces fuel costs.
Long Lead Times
Although the supply chain constraints experienced during the pandemic have eased, the lead time for equipment remains long, especially for electric spreads. It usually takes 18 months to receive a new spread.
Given the industry’s shift to focusing on cash flow and balance sheet management, hydraulic fracturing companies will be far more disciplined about investing capital in new equipment than they have been historically. Speculatively ordering new spreads is off the table. In fact, the sector has moved from a mantra of “If you build it, they will come” to “If you want me to build it, I need a two-year guaranteed contract.” Most of the orders to date have been to replace old equipment rather than expand available horsepower.
Inflation has helped reinforce the focus on fiscal discipline. While some pricing metrics have improved, it’s important to zoom out and put everything into historical context. Prices have gotten better, but we are far from a normal market. As shown in Figure 1, steel pipe is one of many basic materials that is seeing meaningful inflation.
FIGURE 1
North America Steel OCTG P110 Pipe
(5.5-inch diameter) Spot FOB
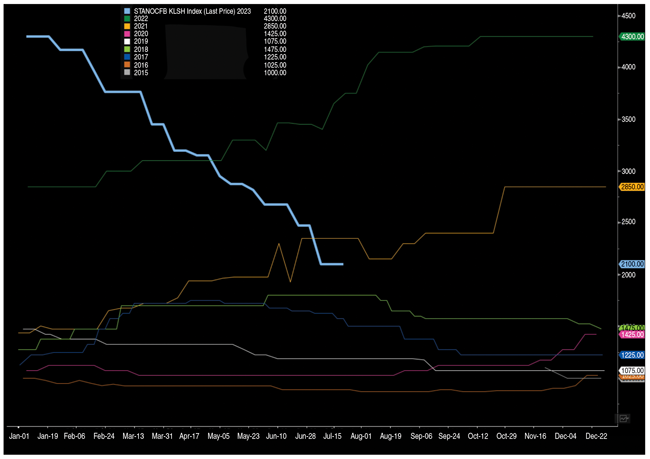
Source: Bloomberg
Labor is another huge cost factor. Wages have soared in the past few years and show no sign of receding in the near term. The oil field service sector has to compete for employees with many other sectors, including construction, which can offer more convenient hours and comparable pay. Incentivizing people into the field often requires higher pay, overtime, stage bonuses and other cash initiatives.
With costs elevated across the board, margins will remain tight. Even so, companies are building a few electric spreads. In addition to lower fuel costs, emissions and noise, e-fleets’ major advantages include lower operating costs. They have fewer moving parts, allowing for a cheaper and easier maintenance schedule.
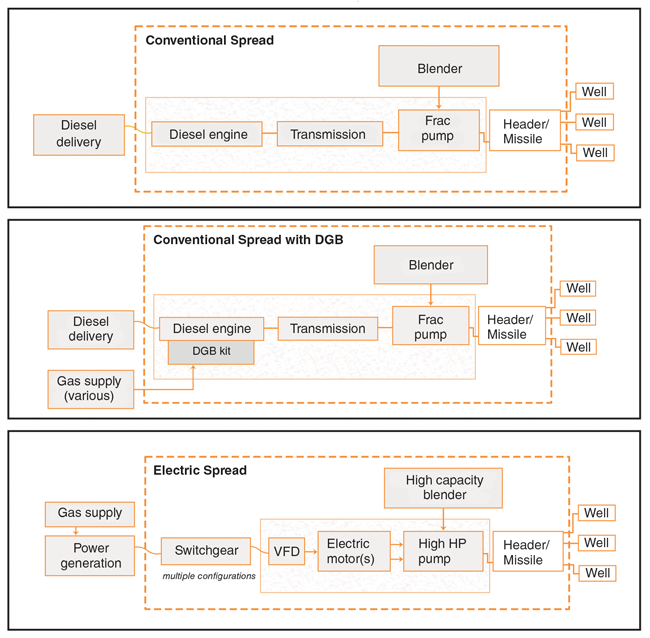
Figure 2 shows the equipment required for a conventional diesel spread, a dual-fuel fleet and an electric fleet. Electric fleets often use higher-horsepower pumps, reducing the number of pumps required to meet the job’s requirements. In fact, e-fleets frequently have enough horsepower to fracture two wells at the same time without ordering additional capacity.
Such simulfracs’ adoption has accelerated throughout the Permian, and more testing is taking place in other basins as well. If the technology gains widespread popularity, the efficiency gains it unlocks will reduce the total number of spreads needed to maintain or grow U.S. production levels.
FIGURE 2
Spread Types
Spread Count Outlook
Given today’s market fundamentals, the number of active frac spreads is unlikely to reach 315 this year and may struggle to crest 300. The heat has impacted near-term activity, but that should lead to some makeup activity as we progress through August and into September and October. The current pricing deck and underlying demand will keep activity stable at about 275–285 spreads throughout this period.
We used to think the United States would exit 2023 producing 12.7 million barrels of crude a day, but we adjusted those expectations in May to a range of 12.5 MMbbl/d-12.6 MMbbl/d based on lower-than-expected completion activity. Even as prices would support more completions, there has been more discipline from the energy industry and some pivots within basins.
Spreads have shifted from dry gas fields to areas producing crude oil and higher cuts of natural gas liquids. At the same time, many oil basins have gotten gassier or lighter as they mature, which also weighs on realized prices and slows growth.
On a positive note, the United States is well placed to supply light, sweet crude into the global market. Saudi Arabia gave the United States a gift by sending its official selling prices (OSPs) higher throughout the market, which has enabled our crude to remain competitive into Asia and Europe. The United States has always had an advantage flowing into Europe, given our proximity and competitive pricing, but Asia is contingent on several key factors, including OSPs and shipping costs.
The higher OSPs prompted another wave of purchasing from the United States that should persist through October. These purchases will keep our exports between 3.7 MMbb/d and 3.8 MMbbl/d.
The United States also has benefited from WTI Midland being added to the Brent benchmark contract beginning in June. This change provided a volume bump for Brent while securing another continuous outlet for U.S. production.
Liquids
The liquids space is a tale of two cities when comparing domestic and international markets. The United States has been building out export capacity since the shale revolution began, an investment that has enabled us to become a bigger player around the world. Our increased stature has provided a positive bump in both volume and price as the international market has brought on more refining and petrochemical capacity.
Domestically, limited demand has put prices under pressure. However, our ability to export additional volumes has protected pricing, helping slow the decline.
New petrochemical assets across the Middle East and, more importantly, China have helped sustain demand for liquids. “Made in China 2025,” a plan the country introduced in 2015 to expand manufacturing capabilities, resulted in extensive investment across the industrial complex, with a huge focus on downstream markets. More than 20 petrochemical projects have been officially completed this year, and more will follow.
In total, the world has added about 50 million tons of new ethylene capacity from 2020 to 2024, with about 60% of it originating in China. Capacity is ramping up and we have even more coming on line through 2037 (Figure 3).
FIGURE 3
Biggest Petrochemical Projects Being Built in China From 2023-2037
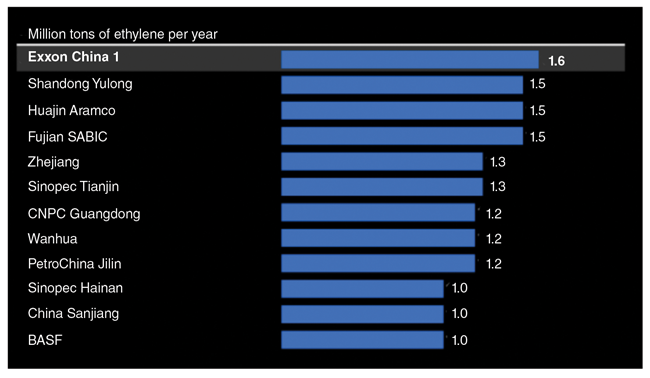
Source: S&P Global
As OPEC cuts crude supply, it also reduces the amount of liquid petroleum gas and naphtha it has available for export. This has helped keep U.S. exports of LPG, ethane and naphtha competitive despite falling prices.
Those falling prices, which come in part from new international capacity, have put pressure on local American and European margins, forcing refiners to reduce runs and total capacity. But the lower prices also make U.S. volumes more attractive to international buyers. It’s no surprise to see our LPG and ethane exports flowing at record levels in 2023.
On the other hand, condensate (naphtha) faces hurdles in the global markets. Demand at the refining and petrochemical levels has come under pressure as gasoline storage has risen globally, and topping units are experiencing margin compression.
Natural Gas
The U.S. natural gas market has been range bound as rising production, driven by associated gas in the southern part of the country, offsets any recent increases in demand. This has pushed OFS companies to move spreads from dry gas to wet gas and oily basins. Growing operational efficiency at natural gas wells also enables the same level of production with much less equipment.
As more LNG export capacity comes on line, we will be able to debottleneck some of the current market. Natural gas producers also have reduced activity, focused on cash flow and managed their margins well to date. We do not see a big pivot coming until the end of the year, which is seasonally normal for additional activity.
The natural gas curve supports a more balanced realized price of $3.25–$3.75, which would support a balanced drilling program into 2024/2025.
Editor’s Note: The authors would like to thank Andrew Queen for his assistance with this article.
MATT JOHNSON is president and chief executive officer of the Primary Vision Network, which provides market intelligence and consulting on the hydraulic fracturing sector, including weekly counts of active U.S. frac spreads. A diverse background allows Johnson to view issues from a variety of perspectives to find solutions to domestic and international engineering, exploration, research and development, management, sales, and operations challenges. Before joining Primary Vision as national account manager, Johnson was vice president of business development at BAR Co. Inc. He holds a bachelor’s from Johnson & Wales University.
MARK ROSSANO is founder and chief executive officer of C6 Capital Holdings in Glen Head, N.Y., providing investment and consulting services to clients in multiple sectors. He has 15 years of experience spanning venture capital, private equity and consulting. Before establishing C6 Capital Holdings, Rossano served as an energy industry analyst at Bloomberg, a senior energy analyst and macroeconomist at Elevation, an energy analyst and strategist at Candlewood Investment Group, an energy analyst and strategist at South Ferry Capital Management, and an associate at Morgan Stanley Investment Management. He holds a B.A. in economics from Loyola College in Maryland, and an M.B.A. in finance from Syracuse University.
For other great articles about exploration, drilling, completions and production, subscribe to The American Oil & Gas Reporter and bookmark www.aogr.com.