


Fault Analysis Using 3-D Data Reduces Water Production, H2S Risks In Delaware Basin
By Sandra Marek and Graham Spence
HOUSTON–Oil and gas production companies invest significant amounts of capital in subsurface characterization, drilling and completing unconventional reservoirs, but face a common challenge in the production process: mitigating high water cuts and associated hydrogen sulfide.
In the Delaware Basin, where horizontal Wolfcamp and Bone Spring wells commonly produce two or more barrels of water to every barrel of oil, excess water and H2S production has resulted in declining economic returns because of the cost of handling, transporting and disposing of these byproducts. In today’s challenging economic environment, it is more crucial than ever to minimize operational expenditures while maximizing hydrocarbon production from onshore unconventional resource plays.
To identify, evaluate and potentially mitigate against these unwanted products, it is essential to understand water saturation and H2S-bearing formations throughout the stratigraphic column, how these formations communicate with zones targeted by the lateral, and their respective effective stimulated rock volumes. Communication pathways may exist as faults or basin lineaments that intersect the target reservoirs, or as man-made permeability pathways created during the completion process that connect the oil-saturated target formation with a water-wet or H2S-bearing formation.
In any case, to reduce these risks, it is essential to identify formation water distribution, H2S-generating lithologies (e.g., Ochoan evaporites), and relevant structural elements. A study was initiated in the Delaware Basin to identify those structures, correlate excess water production to basin lineaments, and determine the connection of lateral wells to water-saturated formations using 3-D data. Seismic analysis of faulting and natural fracturing can reveal crucial insights to reduce produced water and H2S volumes, optimize recovery efficiency, and decrease production costs.
The objectives of the Delaware Basin study were to better understand the fault and fracture network distribution within, below and above the Wolfcamp formation. The resulting fault risk map allowed for the comparison of water production volumes from Wolfcamp lateral wells with their relationships to the basin lineaments identified from analyzing seismic reservoir characterization.
The study utilized a data subset of a multiclient 3-D seismic survey located in Reeves County, Tx. The interval from the Permian to the Devonian was imaged for subsurface discontinuities.
Conditioning And Filtering
Conditioning and filtering the seismic data is an important first step to creating a good understanding of the size, distribution, continuity, and connectivity of faults and fractures. Delaware Basin seismic data is noisy in nature because of distortions such as subsurface interference, shallow geological features, formation composition, acquisition footprint resulting from shot point/receiver grid, and other factors.
Conditioning the seismic and filtering the data for unwanted artifacts help increase the effectiveness of the seismic reservoir characterization methods applied later in the data, and reduce the time it takes to run the necessary processes. Conditioning includes filtering out noise that creates distorted or discontinuous seismic amplitudes, removing artifacts created by the orientation of how the seismic was shot, and balancing amplitudes in areas that may have a lower or higher signal-to-noise ratio than the areas around it.
This process consists of several steps and is iterative in order to make sure that as many artifacts as possible are removed before starting to map seismic discontinuities (faults). While this does not remove the seismic data necessary for identifying the faults, it does help to remove many erroneously interpreted faults that could be generated from anomalous artifacts, such as the shooting orientation of the seismic data.
Fault Extraction
Extracting the fault and fracture data from the seismic volume can be done at several scales and for any interval. However, with variations in seismic amplitude responses, such as a carbonate interval versus a clastic interval, seismic data should be split into intervals with similar seismic characteristics in order to achieve a better dynamic range for characterizing small-scale faults and fractures. This ensures a more consistent extraction of faults and fractures from the data.
In this project, the extraction of faults and fractures was divided based on formation:
- Brushy Canyon formation to Avalon formation;
- Avalon to Bone Spring;
- Bone Spring to Wolfcamp;
- Wolfcamp to Strawn;
- Strawn to Woodford; and
- Woodford to base Woodford (top Devonian).
Within these six intervals, faults and fractures were extracted using amplitude discontinuities in the seismic data. These variations are often minute and not easily recognizable by the interpreter, especially in the case of the fractures. These were identified using additional seismic conditioning processes to eliminate extraneous information in the seismic volume and to remove the seismic discontinuities that represent continuous sedimentary deposition.
Once these points of amplitude variation have been identified, they are connected to form faults and fractures. Any remaining discreet and disconnected points are filtered out of the dataset. This shows the importance of conditioning the seismic volume; the better it has been conditioned, the fewer extraneous points there will be to filter out during this process.
FIGURE 1
Faults and Fractures in Bone Spring and Wolfcamp Formations
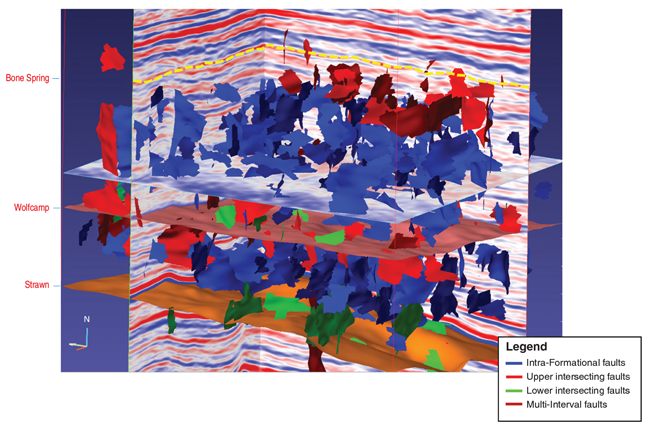
Figure 1 illustrates a 3-D view of the results of this process from the Bone Spring to the Wolfcamp, and from the Wolfcamp to the Strawn. The faults and fractures were separated based on the continuity through different intervals and color-coded accordingly:
- Blue represents faults and fractures contained within a single interval.
- Red represents faults and fractures penetrating the interval above it.
- Green represents faults and fractures penetrating the interval below it.
- Dark red represents faults penetrating multiple intervals.
Features in the blue “intra-interval” typically vary in size from very small to large with significant variability in vertical and lateral continuity. These are the faults and fractures that have the greatest potential for interconnectivity with other faults and fractures, since they are the most abundant.
Features in the red and green inter-interval typically vary in size from moderate to large. These faults and fractures have significant potential to transmit fluids between formations since they cross from one formation into another.
The dark red faults typically vary in size from large to very large. These faults represent the most easily identified faults and generally come from deep within the basin. They also have significant potential to transmit fluids, but since they typically are deeper than most unconventional wells in the Wolfcamp, the biggest hazard for encountering issues associated with these faults is whether there is connectivity with any of the other fault and fracture networks that could allow water or H2S to be transmitted.
No formation micro-imager data was available within the study wells, which would be needed to confirm the dominant orientation and validation of the identified faults. However, the general north/northwest-to-south/southeast direction of the observed Upper Wolfcamp faulting follows the known trend of the Delaware Basin.
Knowing the extent and penetration of faults and fractures across one or more intervals is important for understanding how water and/or H2S can be produced through connectivity between a producing interval and a water- and H2S-bearing interval.
Petrophysical Analysis
Petrophysical analysis of the stratigraphic column is required to identify formations hosting high water saturation (Sw). Petrophysical analysis (Figure 2A) was performed on a well in central Reeves County, denoted by the yellow star in Figure 2B.
FIGURE 2A
Petrophysical Analysis of Well
in Study Area
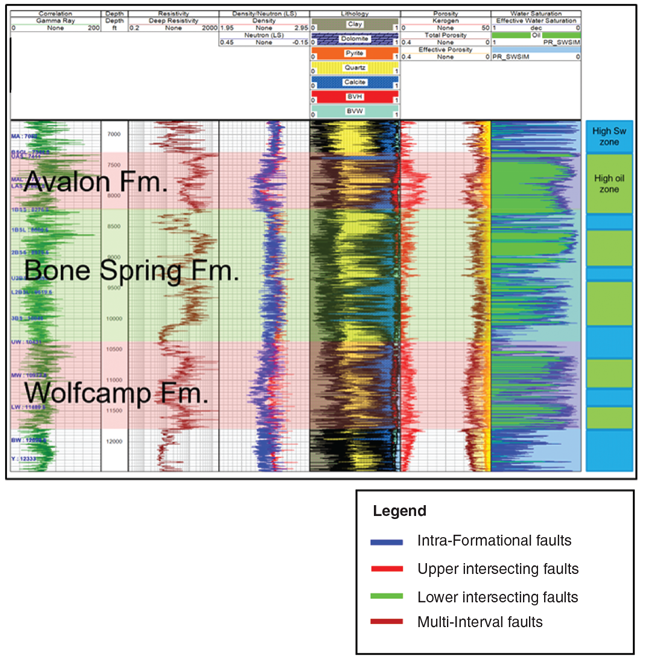
FIGURE 2B
Arbitrary Wolfcamp Section Overlain with Faults and Fractures and Produced Water Bubble Map
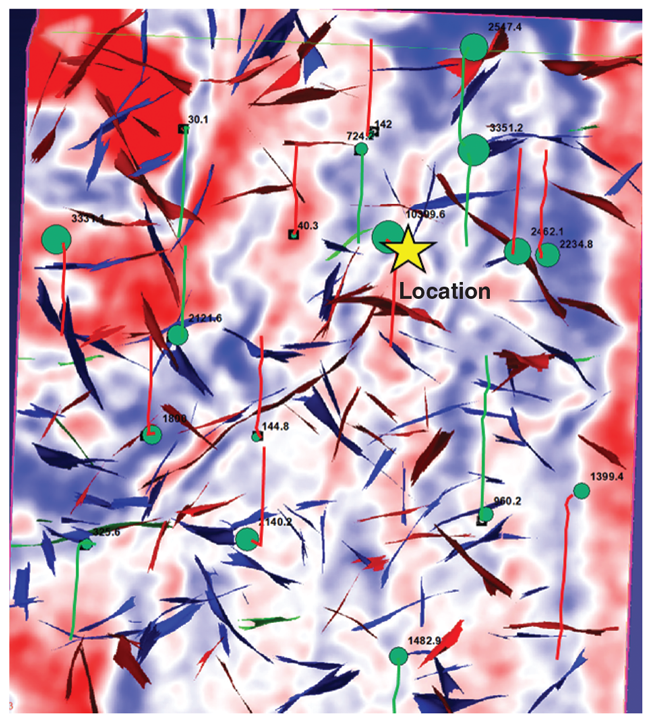
Figure 2A highlights the lithological and Sw interpretation on the Avalon, Bone Spring and Wolfcamp formations. All these formations host intervals of high water saturation and high oil saturation, indicating a challenging scenario for producers completing the oil-bearing formations, particularly if they are connected by intra-formational faulting.
For example, producing excessive water from completing a well in the Upper Wolfcamp that encounters an intra-formational fault connected to the high water-saturated Lower Wolfcamp shows how understanding the connectivity between the hydrocarbon-bearing and water-saturated zones can greatly affect a well’s viability. Similarly, a well that encounters a fault connecting to multiple shallower and/or deeper formations may also supply additional water. In addition, kerogen content varies throughout this section, which may supply excess H2S, but a dedicated geochemical study is required to fully establish those H2S-delivering formations (Type IIS kerogen).
Evaluating Water Production
When these faults and fractures are overlain with water production data, there is an apparent correlation between faults and fractures that penetrate shallower intervals and an increase in produced water. For example, when a fault crosses from the Wolfcamp into the Bone Spring, a well has a greater chance of increased water production than crossing a fault that is contained within the Wolfcamp formation.
Figure 2B is an arbitrary top-down (map) view of the Wolfcamp with the different color-coded fault and fracture types. It is overlain with a bubble map of 18 wells showing six-month water production. Each green bubble represents the volume of water produced over the interval; the larger the bubble, the greater the volume of water. The lateral trajectories of each well are indicated by a red (gas-producing) or green (oil-producing) line. Thus, the map indicates which types of faults are crossed by a particular well and the volume of water produced.
Most of the wells that cross the red faults, or faults that penetrate from the Wolfcamp into the shallower Bone Spring, show a greater amount of water produced over six months than those that cross only the blue intra-formational faults and fractures. However, it is important to note that since the study used publicly-sourced well data, the depth to which these unconventional wells penetrate is unknown, as are other factors that may contribute to the produced water volumes.
Knowing that wells crossing the red inter-formational faults produce more water than wells not crossing faults that penetrate into a shallower interval creates a greater understanding of how faults and fractures can result in increased water production in unconventional wells. A methodology then can be used to determine which faults and fractures may create a higher risk for water production, as seen in Figure 3A.
FIGURE 3A
Color-Coded Risk Assessment of Faults and Fractures at Arbitrary Point in Wolfcamp (left)
FIGURE 3B
Example of Well Placement to Minimize
Increased Water Production Risk (right)
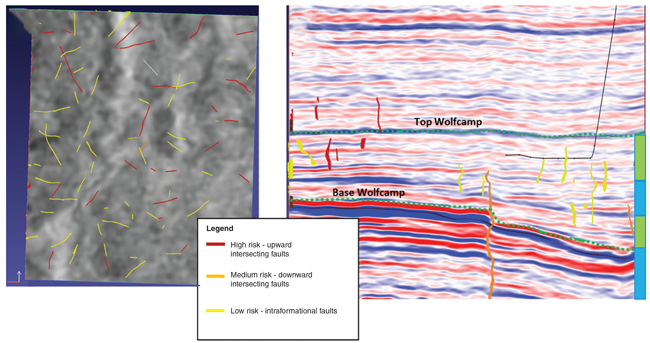
This is a map view of an arbitrary point in the Wolfcamp formation using a red-orange-yellow measure to indicate the corresponding high-medium-low risk assessment of the faults and fractures at this surface or target level. Having the ability to glance at a target location or interval with this fault risk assessment can help drive the placement of a lateral or determine where to create a bypass zone during hydraulic fracturing.
Figure 3B illustrates how a well could be placed to minimize the risk of increased water production. This example of a well path crosses two yellow, low-risk faults in the Upper Wolfcamp formation. If the well were to be placed in the high-risk red faults on the left side of the seismic image, increased cost and a high water cut could be a significant detriment to producing hydrocarbons.
The right side of the seismic image indicates the water-saturated zones and the hydrocarbon-bearing intervals, as illustrated in Figure 2A, to further emphasize the risk factors associated with faults and fractures that cross multiple intervals.
Additionally, understanding the fault and fracture network, along with a petrophysical analysis of the rocks (Figures 2A and 3B), can help determine where faults and fractures penetrate water-saturated zones and where connected networks also can result in increased water production.
The Delaware Basin study illustrates how fault and fracture networks, when imaged in a processed 3-D seismic volume, can be analyzed in a variety of intervals, areas and sizes. Understanding the fault and fracture networks in an unconventional asset can increase estimated ultimate recovery by reducing produced water, increasing production efficiency, reducing impacts on the environment and decreasing cost per well.
Analyzing fault and fracture networks for potential produced water volume should be a fundamental step in understanding (and valuing) an unconventional resource play asset.
Editor’s note: The authors acknowledge CGG Multi-Client for granting permission to show seismic data from its Avalon 3-D survey in Reeves County, Tx.
SANDRA MAREK formerly served as a reservoir geoscientist with CGG Reservoir Americas. Prior to that she worked for BP Americas, and has six years of experience in exploration, seismic reservoir characterization, seismic interpretation, and stratigraphy in a variety of onshore and offshore fields. Marek holds a B.S. in geology from Stephen F. Austin State University and an M.S. in geology with a focus on carbonate geology from Texas A&M University.
GRAHAM SPENCE is regional technical manager for CGG Reservoir Americas. With 14 years of experience in reservoir characterization, predominately in the Lower 48, Spence has developed bespoke geoscience solutions for both conventional and unconventional reservoirs. He holds a B.S. in geosciences.
For other great articles about exploration, drilling, completions and production, subscribe to The American Oil & Gas Reporter and bookmark www.aogr.com.