


Multiple Market Factors Shape NGL Fundamentals, Seasonal Price Outlooks
By Rusty Braziel and Todd Root
HOUSTON–Ethane prices nearly doubled over the first six months of the year, and while prices have retreated from early June highs pushing $0.70/gallon, ethane remains priced at the highest levels in nearly a decade. At the same time, ethane cracker margins are low to the point of bordering on marginal economics. Ethane production is up, yet inventories are down.
Looking at propane, U.S. inventories are 3.5 million barrels lower than last year, or 2.6 MMbbl below the five-year week-on-week low. Propane exports (like ethane exports) are running high, and while production is up, propane output is not increasing fast enough to replenish inventories before the official start of propane heating season in a few months. Yet, unlike at this same point of the year in 2021, propane prices have been trending down in recent months and are much weaker relative to crude prices than a year ago.
What is happening with these two critical components of the natural gas liquids stream, and what do the current situations in the ethane and propane markets imply about supply/demand and pricing expectations in the months ahead?
Let’s begin with ethane. A big driver of the bedlam is $7-$9/MMBtu natural gas prices, but as usual with ethane, there is a lot more happening below the surface–including high domestic demand, growing export volumes and significant developments in downstream petrochemical markets–all of which are shaking things up. Looking ahead, uncertainty looms, with more export capacity, ever-changing ethane rejection economics and uneven production growth.
Petrochemical plants have to pay enough for their ethane feedstock to keep their supply from being rejected and sold as natural gas. But the margin for running ethane through a steam cracker to make ethylene is down sharply from $0.31/pound of ethylene produced last year, falling to the $0.09-$0.11/pound range this spring and summer. That is not only low from an absolute perspective, but it is also low relative to other feedstocks, with propane and butane enjoying higher margins. One might think that would mean reduced ethane demand from the petrochemical plants, but so far, it has been just the opposite: Steam cracker demand is at record highs.
Other strange things are happening, too. According to U.S. Energy Information Administration stats, ethane production soared to an all-time high of 2.5 MMbbl/d in March, up 11% in one month. Maybe that was an outlier, but still, ethane production is up 22% since January 2020. Even with production up, however, ethane inventories are low, at only 60% of the inventory in October 2020 and the lowest level for March since 2016, when far fewer ethane-only steam crackers were on line. More demand should signal a need for more inventories, but that is not what the market is seeing.
Fundamental Changes
A close examination of the fundamentals reveals that these are not random, disconnected developments. Instead, they are rational, predictable outcomes of fundamental changes happening across the ethane market.
Ethane is unique in that it is the only energy commodity that can morph from being sold as natural gas, or alternatively, be used as a liquid feedstock for petrochemical plants. It is this chameleon-like attribute that contributes to ethane’s volatility, both in terms of production volume and pricing.
Figure 1 shows historical ethane prices. The left graph is the price of OPIS Mont Belvieu “purity” ethane for the past decade. To state the obvious, ethane has had a choppy ride, going from $0.80/gal in 2012 to $0.10/gal in the summer of 2019 and again in April 2020 with the COVID pandemic. But that was the bottom of the market, and it has been up and away ever since. The right graph in Figure 1 zeroes in on 2022, and, like all other energy commodities, ethane’s price rise has been pretty amazing.
FIGURE 1
Mont Belvieu Purity Ethane Price
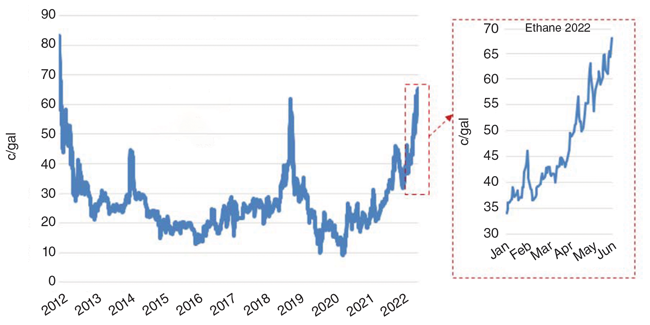
Source: OPIS
Increasing demand is certainly a factor in helping pull ethane prices higher. Ethane demand is up by 400,000 bbl/d since early 2019, and the trend continues to be on the upswing. Growing export volumes also have contributed to strong ethane prices, with volumes moving up some 200,000 bbl/d from 2019-20, with almost all of the growth coming from the two Gulf Coast export terminals: Enterprise’s Morgan’s Point facility on the Houston Ship Channel and Energy Transfer’s Orbit facility at Nederland, Tx.
But again, there is more to the story. Ethane production is up almost as much as demand thanks to several new crackers, increasing by 400,000 bbl/d between the first quarter of 2019 and the first quarter of 2022. Demand plus exports increased more than production, drawing down inventories, but by itself, that imbalance would not be near enough to double the price of ethane.
But first, what is driving the demand increase? It would seem higher ethane demand could be traced back to higher petrochemical margins for cracking ethane. Petrochemical plants want to run the feedstock that makes the most money, and for many months, that was ethane. That changed last April.
As shown in the left graph in Figure 2, during the first two months of the year, the ethane margin was a strong $0.27/lb of ethylene produced (blue line). That was well above the two other most significant NGL feedstocks: propane at $0.08/lb (orange line) and butane at $0.06/lb (green line). Then in March and April, the margin on ethane dropped to $0.09-$0.11/lb while at the same time propane and butane margins were improving.
Two factors were responsible for the margin realignment. First, the price of ethylene dropped, as shown in the right graph in Figure 2. About 70% of the steam cracker yield from cracking ethane is ethylene, while the ethylene yield is only about 40% for propane and butane. Thus, a drop in the ethylene price disproportionately impacts the ethane margin. The price of ethylene has come down from very high levels at the first of the year as tight supplies have been relieved.
FIGURE 2
Gulf Coast Steam Cracker Margins (Left) and
Ethylene Prices (Right)
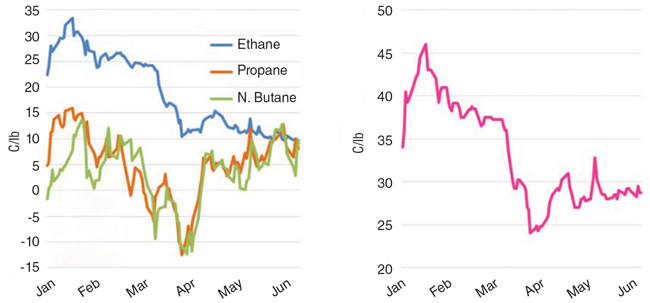
Source: OPIS, RBN and Petrochem Wire
Full Capacity
The second factor that tightened margins was the trajectory of ethane prices versus propane and butane. Since early March, the price of ethane has increased by about 50%, while propane and butane dropped by about 10%. Propane and butane prices declined in part because of seasonal trends. Consequently, the margins for propane and butane ramped up to equal and sometimes exceed ethane over the past couple of months.
A few years back, such a flip in feedstock margins would have signaled flexible crackers to alter their feedstock slates to run more propane and butane and cut back on ethane. But in 2022, that shift has been almost imperceptible, with ethane demand continuing at high levels. The reason is simple. Virtually all operational U.S. cracker capacity is currently on line. including Gulf Coast Growth Ventures’ giant facility near Corpus Christi, Tx., with the entire fleet’s capacity utilization at 95%.
Moreover, much of this capacity is integrated with downstream units that produce a wide range of petrochemicals from the ethylene and other cracker products, further insulating petrochemical companies from low cracker margins on ethane. The bottom line is that with changes in the petrochemical markets, the margin on ethane cracking has much less to do with near-term ethane demand and the price of ethane. Higher demand is simply the result of all crackers finally getting on line and running at high rates at the same time.
But what about ethane prices? If supply is keeping up with robust demand, why have ethane prices doubled this year? It really all comes down to one variable: the price of natural gas. So far in 2022, ethane prices have shadowed natural gas prices every step of the way. And if ethane prices had not increased at the same rate as natural gas, processing plants would have rejected more ethane and sold the molecules as natural gas rather than extracting the ethane.
Since petrochemical demand was growing, the price signals were telling the processors to keep the ethane coming. The ratio of the price of ethane (converted to a Btu basis) divided by the price of natural gas has averaged a remarkably stable 1.25 since January 2021, and ethane likely will continue to track natural gas until the next market shift comes along.
What might that next disruption in ethane markets look like? Well, there are a number of possibilities, including new ethane export capacity, an increasing rate of supply growth (mostly out of the Permian’s Delaware Basin), additional processing and fractionator capacity, and the big wild card: the prospects for natural gas prices moving much higher because of increasing liquified natural gas exports. If a “new world order” for natural gas takes hold with ramped-up U.S. LNG exports, ethane markets could look very different over the next five years.
Propane Outlook
Last year, propane prices spiked prior to the onset of winter thanks to a confluence of bullish market developments, then virtually collapsed in November and December when cold weather failed to arrive on cue. In essence, prices were high when marketers were building stocks and low when it was time to move those supplies to market.
Is the current price of propane cheap or expensive relative to history and other energy markets? The answer, unfortunately, is both. In absolute or nominal terms, propane is expensive. As shown in the left graph in Figure 3, the average price of July propane was higher in 2022 (blue-outlined circle to upper right) than any year for the past decade, averaging $1.15/gal compared with the previous highs of $1.09/gal in 2021 and $1.03/gal in 2014. The average July price over the 10-year period was $0.77/gal.
FIGURE 3
Mont Belvieu Propane Prices (Left) and
Propane-to-WTI Ratio (Right)
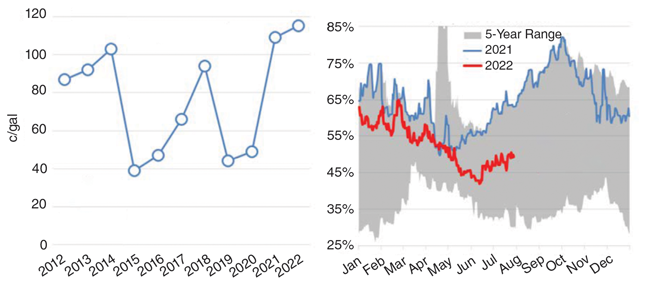
Source: OPIS and CME/NYMEX
Yet, by other measures, propane is cheap; considerably cheaper, in fact, than at this time last year relative to other commodities. The right graph in Figure 3 shows the relationship between propane and West Texas Intermediate crude prices. Generally speaking, higher crude prices are bullish for propane prices and vice versa. The relationship is in part because of propane demand in the domestic and international petrochemical markets, which tends to push propane prices up when crude prices move higher. But the relationship can vary widely, depending on the strength or weakness of the propane market.
The graph illustrates that today’s propane market (right end of the red line) is relatively weak, thus the price of propane on this basis is cheap. For much of 2021, the price of propane relative to WTI (blue line) was either at or near a new five-year high, averaging 61% through July. This year, propane is much cheaper relative to WTI, averaging only 52% through June and 48% during July. That makes sense when considering that supply/demand fundamentals in the propane market today are similar to where they were this time last year, but crude oil fundamentals are very different. The price of crude is up, but propane is not, so the ratio of propane to crude is lower.
Market Fundamentals
The most important fundamentals in the propane market are production, exports, domestic demand and the combined impact of those factors on U.S. inventories. According to EIA data, propane gas plant production set an all-time high of 1.84 MMbbl/d in May 2022, but that was only 4% higher than in January 2020, a paltry 68,000 bbl/d increase over 28 months. While we expect propane gas plant production to pick up somewhat later this year, production is not up enough to make much of a difference.
Unlike production, propane exports have been increasing at a more robust rate, growing about 10% annually over the past four years. Average annual exports are up around 100,000 bbl/d per year since 2018, which is well above the rate of production growth. This year, most of the growth in exports has been destined for Europe, and that trend could increase further, assuming the Russia-induced natural gas supply crunch intensifies as expected this winter. The key takeaway is that export growth has exceeded production gains, which has tightened propane supply/demand balances and helped keep inventories on the low end of the scale.
Of course, the most unpredictable variable in any winter propane season is the weather. Seasonal fluctuations in domestic propane demand are significant and are associated primarily with temperature because so much residential, commercial and agricultural consumption is tied either to space heating or agricultural use for crop drying. Last winter demonstrated what happens when winter begins with unseasonably mild weather (inventories stay full and prices retreat). If the opposite occurs and it gets cold in the fall and inventories are pulled down early in the season, it could be a scramble to keep up until spring arrives.
For that reason, it is instructive to consider two different scenarios for 2022-23 winter propane demand: one with normal weather and the other with colder-than-normal weather, or more specifically, a winter similar to the polar vortex of 2013-14, which resulted in a severe test of propane supply chains.
The dashed purple oval in the left graph in Figure 4 shows what happened to propane prices during the polar vortex winter. The price of propane at Conway, Ks. (blue line), spiked to an all-time high of almost $5.00/gal in late January 2014, or almost double the price of WTI crude oil at the time. While the massive spike in Conway prices increased the spread to Mont Belvieu to more than $3.00/gal, prices retreated back to more normal levels by the end of heating season in March 2014.
FIGURE 4
2013-14 Polar Vortex Propane Prices (Left) and
Winter 2022-23 Demand Scenarios (Right)
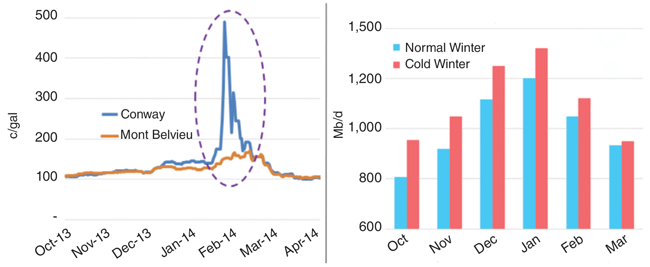
Source: OPIS and RBN
Comes Down To Weather
The right graph in Figure 4 shows the “normal” (blue bars) and “cold” (red bars) scenarios for U.S. propane demand projections for the winter 2022-23 heating season. When these two scenarios are run in our propane supply/demand model, the results shown in Figure 5 are both predictable and profound. If it gets very cold, inventories will be drawn down to uncomfortably low levels (dashed red line), threatening supply chain disruptions. If the weather turns out like last year, there should be few problems (dashed blue line). It all comes down to the weather. And as always, with the weather, who knows?
What we do know, however, is that a polar vortex winter in the era of big-time propane exports has never happened before. The purple line in Figure 5 shows 2021 inventories skating along the bottom of the five-year range (gray area) for most of the year. The solid blue line shows year-to-date inventories (actual data through May and estimates for June and July).
FIGURE 5
Propane Inventory Scenarios
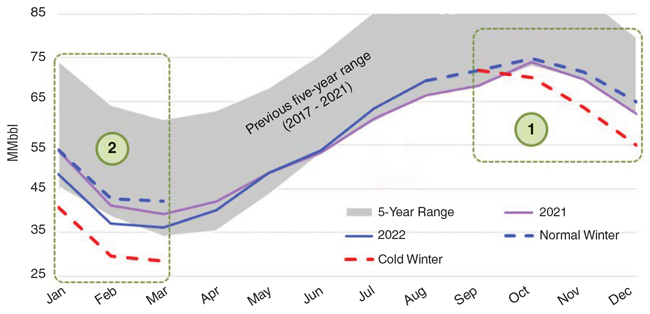
Source: RBN
The differences in the two scenarios show up in September (green circle labeled “1”). In the normal scenario (dashed blue line), stocks would end 2022 slightly above the five-year low and last year. In the cold scenario (dashed red line), stocks would drop to 55 MMbbl, or 7 MMbbl lower. That sets up the first quarter of 2023 (green circle labeled “2”), where inventories under the cold winter scenario remain about 12 MMbbl below 2022 on average. This scenario assumes that the last couple of months of winter are milder, as was the case in the winter of 2013-14. Clearly, inventories at this level would be at a much higher risk of supply disruption.
There are many variables that could impact these inventory levels, the most significant of which is exports. It is certainly possible that low inventories could push prices much higher and slow U.S. exports. That is, of course, unless it is also cold in Europe and Asia. The war in Ukraine, LNG supply shortfalls (exacerbated by outages in the United States and Australia) and other factors are already putting pressure on international gas markets and sending European and Asian prices back toward the record highs experienced last winter.
In any case, these projections show what can happen in a polar vortex scenario at the national level. But the real impact will be regional. That is where the rubber meets the road in propane supply chain disruptions, because when there is a sudden surge in demand, propane supplies have to be close at hand. And most likely, that regional impact would be the most severe in the Midwest, just as it was in the winter of 2013-14.
Editor’s Note: The preceding article was adapted from Daily Energy Post blogs on RBN Energy’s website (rbnenergy.com). Future blogs will provide additional insights on both the propane and ethane markets, as well as LNG exports, domestic and international natural gas market fundamentals, and other energy topics.

RUSTY BRAZIEL is president and chief executive officer of RBN Energy LLC, a leading energy consultancy providing analysis and advisory services. As one of the most respected authorities in the field of energy information and markets, he spent 20 years with Texaco (now Chevron), serving as vice president of natural gas marketing and trading, and manager of NGL supply. Subsequently, Braziel was vice president of business development for The Williams Companies, president of Altra Energy Technologies, and co-owner of Bentek Energy. Braziel holds a B.B.A. and an MBA in business and finance from Stephen F. Austin University.

TODD ROOT is director of natural gas liquids and petrochemicals at RBN Energy LLC. Before joining RBN in 2021, Root was at Westlake Chemical, where he was director of feedstocks and director of olefins planning and business development. Prior to that, he served in a variety of roles at Lyondell Basell, including director of business services, business director for propylene oxide and derivatives, business manager of solvents and BDO, manager of optimization and operations planning, and NGL supply manager. Root holds a B.S. in chemical engineering from Michigan State University and an MBA from the University of Houston-Clear Lake.
For other great articles about exploration, drilling, completions and production, subscribe to The American Oil & Gas Reporter and bookmark www.aogr.com.