


Advances Improve Seismic Technology
By Kari Johnson - Special Correspondent
Onshore and off, as well as conventional and unconventional environments have seen dramatic changes in seismic data acquisition, processing and interpretation. These changes are providing improvements in resolution, complex geology imaging, and cost effectiveness in both exploration and production.
Onshore, channel count continues to escalate as cableless systems make it is easier to deploy larger and denser surveys. Three-component seismic is contributing to channel count, as are longer offsets for deeper targets. Although the debate continues over whether smart or dumb nodes are the better choice, both probably have a role to play.
Offshore, the biggest change is in methods to enhance bandwidth. These focus chiefly on new ways to collect a broader range of frequencies. Slanted or deeper towed streamers, autonomous surface and bottom-referenced nodes, dual or multiple sensors, and longer offsets all may contribute to the broadband gain.
In addition, seismic companies say, newly developed processing algorithms are helping find signal in the noise, extending useful frequencies both lower and higher. These algorithms can be applied to previously acquired data in order to discover new details.
New seismic data sources are being developed for offshore surveys as well, as companies report working on marine vibrators that use low levels of continuous energy in place of impulsive energy. The challenge, they say, is to ensure these new devices are reliable and deliver the optimum bandwidth while anticipating new regulations driven by worldwide environmental lobbying.
Meanwhile, advances in computing infrastructure and workflows help interpreters keep pace with the tremendous data volumes now delivered to them. But new tools are needed for experts in one discipline, such as petrophysics, geophysics or engineering, to effectively interpret data from the others.
‘Dumb’ Nodes
Interpreters are looking at far more information on rock properties, and are using stress and lithology volumes to better understand rock fabric, stresses, and fracturing. “Historically, we might have looked only at the structure of the rocks,” says David Monk, director of geophysics and distinguished adviser at Apache Corp. “Now, interpreters want to look at the properties of the rocks in the structures we can see.”
As a result, petrophysicists become an integral part of the interpretation team, says Monk.
There is no doubt the industry is moving toward autonomous nodal recording systems onshore, according to Monk. He cites a huge uptick in the number of autonomous nodal channels sold in recent years and a downtrend in cabled channels, and says companies are converting their systems as they can. Monk predicts it will be 5-10 years before the replacement is complete, because there is still a lot of capital tied up in cable systems.
Dumb nodes are relatively inexpensive, so a company can have a lot of them, which is a good idea, Monk says. Smart nodes are popular because they prove they are working and recording data. However, this introduces more complexity in the electronics, making the nodes less reliable and more expensive, he points out.
“If you make nodes simple, it turns out you also make them very, very reliable at lower cost, and then it’s probably OK to just deploy and trust the vast majority will work,” Monk reflects. “For this reason, it looks like the industry will favor the dumb node, although there are developments still ongoing on both sides.”
Developments in shale plays are part of the drive toward autonomous nodes. “To understand fracture patterns and fracture density in unconventional plays, it is necessary to collect multi-azimuth or full-azimuth seismic data,” Monk states.
He says recording multi-azimuth seismic data requires many more receivers or channels. Monk attests that Apache has seen the number of its active channels increase dramatically, saying, “We have moved from a couple thousand channels a few years ago to 100,000 and beyond. There are people talking about 1 million channels live in the next five years.”
He says it is much easier to deploy large numbers of nodes when they are not constrained by connecting cables. Dumb nodes keep the cost of deployment down, making those surveys practical.
Autonomous Underwater Vehicles
Variations of autonomous nodes are popular offshore as well. Monk says Apache is doing work with 5,000 marine nodes at the same time.
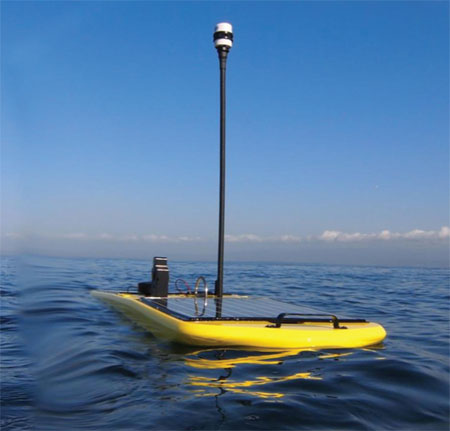
Apache Corp. has been testing a “flying node” that consists of a surface unit on a small, floating platform. The unit can be steered through an Internet connection and tows a small set of receivers. Geoscientists are utilizing autonomous nodes to improve their understanding of such properties as rock fabric, stresses and fracturing.
Several companies are developing autonomous underwater vehicles that incorporate nodes and are launched off the back of a boat or off a dock. “Each one swims to where you want it, then goes down, sits on the bottom, deploys its receiver, stays there for a while, and then picks itself up and goes somewhere else,” describes Monk.
Acoustic pulses are used for simple communication with these devices. “You can send a signal to move to the next preconfigured location,” Monk says. “The data remain with the unit until it is retrieved.”
He says Shell has been developing a node like that with a U.K. company, and there is a separate system being developed by Saudi Aramco and CGG.
Monk says Apache has been looking at a similar concept that uses a surface unit on a small platform that looks like a surfboard. The unit can be steered remotely through an Internet connection and tows a small set of receivers. Together, a group of these may move around like a shoal of fish.
Apache has completed initial tests and confirmed that the nodes went where commanded and collected data. “Now it only remains to be seen whether the data recorded are any good,” comments Monk, who says he is convinced these “flying nodes” are going to be very interesting.
Removing Noise And Ghost
One driver of change within both land and marine seismic, according to Monk, is the push for broader bandwidth. Broader bandwidth provides better geologic images and a better understanding of the geology. Low frequencies are particularly important for subsalt and deep targets, he adds.
In an offshore environment, Monk says two problems arise in data acquisition that limit bandwidth. First, he says, noise from the sea surface can drown the signal, particularly at low frequency. This can be mitigated by moving the receiver deeper or even to the seabed.
The second problem is ghosting or signal loss, which occurs when the energy coming back from the earth hits the surface and goes down again. “If the receiver is close to the surface, the time difference between the energy that passes by the streamer on the way up and back down again is quite small,” Monk explains. “The difference is associated with a particular frequency and effectively cancels it.”
He says deeper streamers can acquire low frequency data, but still have a “ghost notch” or gap at higher frequency. The ghost problem can be solved, if a distinction can be made between the energy traveling back from the earth and the energy reflected from the surface, he continues. One approach is to record two aspects of the wave field, such as pressure and the pressure gradient, or pressure and velocity or acceleration.
Yet another approach, Monk adds, is to tow the streamer at a slant so that the front is shallow and the back is deeper. The energy reflected back from the water surface comes at a different time for each of the different depths, helping resolve the ghost problem, he says.
Improved Streamer Design
Streamer design has a direct impact on the quality of seismic data acquired. When the receivers pick up too much surface noise and surface reflection, the resulting limited bandwidth reduces data resolution, says George Wood, president of Sercel Inc.
He says interpreters want to see a very distinct line denoting the presence of a reflection interface in the subsurface. The broader the bandwidth, the sharper that line, which enables the interpreter to detect smaller features. Wood says that is important for determining reservoir dimensions and the geology at the edges of a reservoir, and for visualizing small features.
Low frequency data also help interpreters get more accurate velocity information, allowing them to determine rock properties, he continues. “We now can acquire the frequency to below two hertz,” Wood affirms.
Generally, the limiting factor at low frequency is noise, he indicates, saying earlier versions of streamers–whether fluid or gel–had too much noise at the lower frequency. Hydrophone design and streamer construction lead to lower noise characteristics, Wood says, adding that the signal recovered has to be stronger, compared with the noise; if the noise is too high, the signal can’t be recovered.
Wood says the improvement in higher frequencies relates more to the acquisition technique and processing. Towing streamers at variable depths, plus some of the advances in processing, has allowed use of the secondary surface reflection as a signal.
Towed arrays can go as deep as 50 meters on parts of the streamer, Wood remarks. They are shallower near the ship. Variable depth is a key part of the improvement in imaging, Wood says. A diversity of depths provides a distribution of times from that surface reflection, which allows processing to improve the signal-to-noise ratio.
“Streamers also are trending longer,” he observes. “A few years ago, 6,000 meters was considered long. Now, 8,000 meters is fairly common and some work is being done with even longer streamers. This is a trend that will continue.”
Complex geology and deeper penetration require longer offsets. “CGG is shooting a survey with a new technique that uses multiple boats with extra-long offsets. By using multiple boats and multiple shooting arrangements, each boat doesn’t have to have very long streamers” Wood reports. “This is very complex, but it gives not only the wide azimuth, but very long offsets as well.”
Companies also are using 2-D streamer position control in depth and breadth to set the shape of the spread (change to a fan for example) to get more coverage, broader bins, and longer offsets, Wood adds. He says streamers can be steered more precisely over a previous survey to get more repeatable 4-D, time-lapse surveys.
Seabed Acquisition
Wood says phenomenal results are being obtained in shallow water where new recording technology has been deployed on the seabed. These devices, deployed in 50-500 meters of water, avoid the noise and reflection issues common near the surface. Some hydrophones record down two Hz or less, and the digital accelerometer sensors can record down to zero Hz.
“These devices acquire very low-frequency, very broad-band data,” he comments.
The deeper the deployment, the more rugged and expensive the equipment becomes. Wood says going deeper than 500 meters is difficult. “Cables for that depth are heavy. Plus, they are likely caked with debris, requiring an extra-heavy-duty handling system,” he explains.
For the few cases where seabed data must be obtained in very deep water, he says seabed nodes can be an option. For example, Wood says, if there is a near-surface gas cloud or dissolved gases, the gas will absorb the energy from a streamer. Seabed acquisition, however, can successfully image the geology.
Sensors also are being deployed in permanent arrays. “One such system on the Ekofisk Field has been in place for a few years and is working extremely well,” Wood attests.
He says the array has 4,000 receivers and is entirely optical. Designed to last the life of the field, the passive array can be interrogated at any time and is used in monitored surveys at least once a year, Wood elaborates. Permanent sensors make it easy to trace reservoir changes over time.
Land Acquisition
Onshore, several changes are coming for sensors, Wood says. As the density of acquisition points increases, the use of multiple sensors is decreasing. Multiple sensors have been used to deal with noise generated by ground roll or surface waves, he says. The downside to this deployment strategy is smearing of data because the data come from more than one point. “Moving to single-point sensors can help sharpen the data,” Wood states. “Higher channel count addresses the noise issue.”
Wi-Fi-capable nodes are proving to be important land-based assets in regions where it may be too risky to wait on collecting data. “Nodes and batteries get stolen,” Wood points out, saying Wi-Fi nodes transmit their data to passing helicopters or trucks, ensuring data safety.
If a node is stolen, it can be located through global positioning satellites. “The contractor can find the unit easily and retrieve the data without alerting or confronting the thief,” Wood says. “Data cannot be held hostage.”
Channel Count
The biggest trend that Steve Jumper, chief executive officer at Dawson Geophysical, says he has seen over the past 20 years is increases in channel count.
Unconventional plays are helping drive the push for more channels. “To get a good understanding of the fractures in those plays, we need to capture wide-azimuth or full-azimuth data,” he says. “Typically, that means we cover a larger area.”
Some early full-azimuth surveys were done at wide spacing, then were filled in later as the need was clear. Jumper says this increase in density and area leads to tighter, higher-resolution images. Higher channel count provides much more analytical potential.
“In order to get an image that is full of attributes that are necessary to do a complete analysis of a reservoir, you need a high density of sources and channels per square mile, in addition to covering more square miles at any one time,” Jumper details.
He draws an analogy to high-resolution television. “It used to be the larger the screen, the lower the resolution,” Jumper recalls. “Now you get very large screens with very high resolution. That is very similar to what we are doing.
“Tighter densities give higher resolution and more perspective, like magnetic resonance imaging, where you can build images from different angles,” he goes on. “You can begin to learn a little bit more about rock properties, fabric, fracturing, pattern and density.”
Jumper says it is not uncommon to have 200 square miles of surveys with tens or hundreds of thousands of channels.
One development that has facilitated this increase in channel count has been cableless technology. Cableless allows companies to move nodes efficiently, doesn’t require full connectivity on the ground, and makes it much easier to work in areas with infrastructure such as highways, interstates, agriculture and railways, Jumper says.
While all that can be accomplished with a cable crew, the cableless equipment makes it economic, he remarks. Autonomous nodal systems have a recording box, a group of geophones or sensors, and a battery. Each node can be programmed to turn on and off, and records continuously during the day, he says. They work with conventional seismic, microseismic, and various vibrator energy sources.
Some units transmit data in real time to a central recording unit. “It’s opened opportunities in situations where you would like to see data as they are coming in,” Jumper observes. “There is room for multiple platforms in our operations. There are places where cabled systems will work fine, and places where wireless will work fine. We will continue to see a lot of activity with cableless systems.”
Source Advances
Vibrator electronics and hydraulic systems have improved as well, Jumper mentions. They can start at a lower frequency and maintain fidelity up to a higher range. He says a single vibrator point now makes more information accessible than ever, making it possible to recreate the down-going wave more accurately.
“The techniques we are using have changed dramatically from only 10 years ago,” Jumper asserts. “We are using less source effort per source point, but we are using more source points. The energy level created over an area is equivalent or higher. We are using fewer geophones over more channels.”
In his 30-year career, Jumper says he has seen geophysical technology and science evolve from a purely exploration tool that improved structural understanding to a practical tool utilized on the backside of drilling for more exploitation/development work. “We are doing a pretty good job of identifying a fault or a subsurface issue, or some structural issue to help make sure the lateral well position stays inside the target reservoir,” he says. “Good quality seismic data can guide the lateral.”
He says companies are gathering enough data that can be analyzed from different angles, azimuths, distances, and components that seismic has value as a drilling-avoidance tool. “We are in the early phase of some of that work, and it will require geophysical people to collaborate with petrophysicists, engineers and geologists to bring together all the information they have,” Jumper says.
All across the oil services, he says there is a convergence of seismic acquisition, data analysis, and drilling completion techniques. “Unconventional plays certainly have created a good laboratory for the convergence of these technologies,” Jumper allows. “The natural progression is to take those technologies back into conventional reservoirs, with the ultimate goal being production optimization.”
Reprocessing Data
Companies are always looking for better imaging, new imaging in frontier areas, and improved imaging in highly complex areas, remarks Rod Starr, senior vice president for the Western Hemisphere at TGS-NOPEC Geophysical Company. One way he says companies have been realizing that is by reprocessing data with newer technology or methods.
Seismic processing algorithms are improving continuously in response to new acquisition techniques, more complex structures, and increasing computer power, Starr contends. For areas that have been surveyed already, he says reprocessing may provide valuable new insight faster and cheaper than new surveys. It also may broaden the effective bandwidth over the previous processing results.
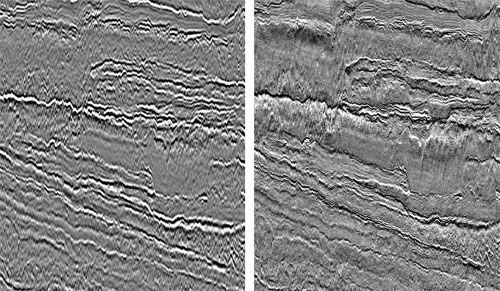
Kirchhoff prestack time migration of data from the Gulf of Mexico are shown before (left) and after (right) Clari-Fi Totus. Note: Displays are not zero phased.
“New techniques use the acquired data, but remove receiver and source ghosts to broaden frequency spectra,” Starr says, adding that older surveys that were processed post-stack can be reprocessed prestack to improve detail.
Starr points to several reasons why reprocessing may be attractive. It leverages surveys that were processed for one target zone and can be revisited to focus on deeper or shallower zones. He says added detail on the zone of interest can be found through prestack processing. Particularly complex areas can be identified and flagged for new surveys that are highly focused. All these applications provide a less expensive method to obtain new insights into seismic datasets, Starr maintains.
Improvements in processing algorithms are enabling conventionally towed streamers to collect broader band data, Starr continues. He says the process boosts high and low frequencies separately to obtain a good result in the combined processed dataset. Stringent quality control ensures the results are plausible and reliable.
Starr predicts operators will look to reprocess regional lines to reconfirm key conclusions, even when they have focused 2-D and 3-D data in a particular area or prospect, and will leverage existing surveys wherever possible to obtain broader-band and longer-offset data. For example, he says an operator can achieve a multi-azimuth dataset by overshooting an existing survey orthogonally. Re-migrating seismic data using new algorithms also may find new detail.
The increasing popularity of autonomous nodes for collecting onshore or offshore data presents an opportunity to improve images underneath complex geology, Starr remarks. The node technology is a step forward, compared with conventional wide-azimuth data, to provide 360-degree, or full azimuth, illumination of subsurface geology using seismic data. Data are collected from nodes using a drive-by or fly-by method, and are delivered to the “campsite,” where they are processed to provide preliminary information and determine the next steps in the survey.
Similarly, he says, data collected on remote vessels may be transmitted to the campsite for review. In some cases, fast-track processing is sufficient as input for preliminary interpretation. The large data volume of the node data is taken onshore to a data center for detailed processing and analysis. Significant improvements of complex geology images have been achieved using the node technology in the past few years, he says.
Gravity and Magnetics
Interpreters will take all the data they can get to create the best representation of the subsurface, reflects Corine Prieto, president of Integrated Geophysics Corp. Adding gravity and magnetics to seismic can reveal or refine fractures, faults, salt structures, and the fundamental understanding of the basement.
While 3-D seismic easily identifies the top of salt in the Gulf of Mexico, adding gravity data enables the operator to distinguish between a processing artifact, a salt weld, or sediments imbedded in the salt mass.
“Operators are drilling deeper and in more complex geology,” Prieto comments. “We use gravity and magnetic data in combination with seismic to reduce the financial risk as much as possible.”
She says gravity was one of the first tools used in oil and gas exploration. For example, she recalls, before the 1960s, Gulf Coast gravity data coverage that resembled a series of bull’s-eyes was used to locate salt domes. When seismic came into play in the 1970s, Prieto says it produced beautiful stratigraphy that gravity data could not provide. Seismic became the darling, and rightfully so, she allows, but gravity continued to be used to find the basin and determine where to shoot seismic in an optimum position.
“Each science provides a different physical parameter of the earth,” she describes. “When you get them all to dance together and get one picture, you are probably pretty darn close to what is in situ.”
For salt, she notes, interpreters lean heavily on gravity because of its density contrast with the sediments. For volcanics, on the other hand, one has to lean on magnetics. For the basement, Prieto opines, magnetics are usually best, but in places where there are clastics and no salt, gravity will work. In certain areas, the geology requires both gravity and magnetic data to determine deep structure.
In the Wilcox play, Prieto says magnetic data are used to determine the basement structure that leads to the fairways and ponded sands. Interpreters followed the fairways from shore to deep water seismically and geologically to be sure the source rock went along. There are wells producing now from 28,000 feet plus in 3,000-4,000 feet of water, she says.
In Utah’s San Juan Basin, Prieto says well control, gravity and aeromagnetics were combined to evaluate the neighboring Black Mesa. San Juan Basin production is established and prolific, but the Black Mesa had only a few dry holes and a few lines of seismic, she remarks. Analyzing the data determined the depth to basement and structure from one basin to the other. The results showed there wasn’t enough room for the source rock. “This was a very inexpensive way to evaluate a frontier area,” Prieto confirms.
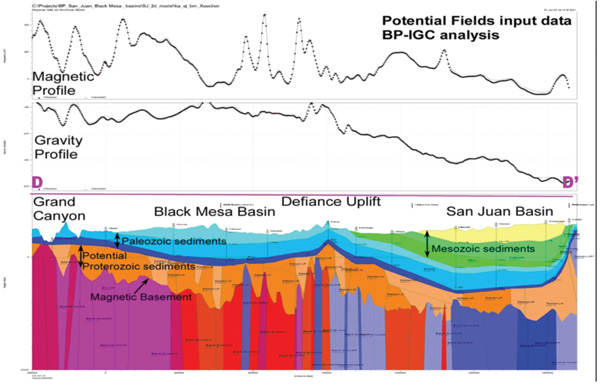
In Utah’s San Juan Basin, well control, gravity and aeromagnetics were combined to create a 2-D structural model that helped operators evaluate the prospectivity of the neighboring Black Mesa Basin.
In the Gulf of Mexico, meanwhile, she points to an ongoing debate. Seismic data easily identify the top of salt, but even with modern imaging, Prieto says there remain questions of whether it is a processing artifact, or truly a salt weld or sediments imbedded in the salt mass. “A little bit of gravity goes a long way in resolving that debate,” she contends.
Prieto explains that gravity-based 3-D structural modeling can provide a viable second opinion on what the salt/sediment interface (salt geometry) is doing, and insists it is necessary to model to determine viable targets under the complex salt overhang geometries found in deepwater regions.
“One wants to drill through minimal salt and still hit source rock,” she says, adding that interpreters will iterate interactively on the data until they find an interface that fits both the seismic and gravity.
“Let us not forget that filter composite maps of high-resolution aeromagnetic data also locate the edge of the canopy salt shallower than 7,000 feet,” she adds.
Magnetics And Shale Plays
Initially, shale geology was thought to a very simple, leveled bed with very little unconformity and structure. “We now are realizing there are structures and lithology variations in shale,” Prieto remarks.
Some lithology exhibits magnetic susceptibility, she points out. A high-resolution aeromagnetics survey concurrent with a shale trend that has magnetic properties will give a great deal of detail on the shale fracturing and the basement structure.
“This has been an awakening,” Prieto enthuses. “We know of one high magnetic susceptibility prone mineral in the Marcellus subgroup. When we have that level of magnetic susceptibility in the lithology, we are assured of obtaining considerably more structural detail.”
For this reason, she reports, a three-state, high-resolution aeromagnetic survey is under way in the Appalachians, covering the Marcellus trend. A joint venture between Integrated Geophysics Corp and CGG, she says the survey will provide close-spaced data coverage. The IGC interpretation will include the basement and shale structure faults.
Prieto says the first of three packages should be delivered this year. Clients will be able to integrate their seismic to determine where they need to acquire a bit more or place a well. “There are small surveys in the area now,” Prieto comments. “This aeromagnetic survey will be uniform, state of the art coverage over the entire trend. It should be very impressive and extremely useful in determining the optimum placement of additional exploration dollars.”
Where there is no magnetic susceptibility in the shale lithology, magnetics still can provide information on the basement structure and secondary faults to avoid. Prieto says the seismic is left to determine the extent of shale fracturing.
Well Integration
Integrating seismic with well data provides greater insight into a field. “Well data are the ground truth, but only in one location,” says Paola Newton, petrophysicist and technical project leader at Rock Solid Images. “Seismic data fill the gaps between wells with certain limitations, given their resolution.”
Improved seismic bandwidth brings data a bit closer to what petrophysicists see in the wells, Newton outlines.
She says seismic data are limited vertically, and alone, reveal structure. Wells give seismic context and help reveal lithology and rock properties. They have the best calibration in mineralogy and saturation. Resolution is critical in early model development, Newton says.
“If you don’t understand the rock at its own scale, you won’t be able to understand what you are assuming as you decrease the resolution for geomodeling and simulation,” she declares.
Wells are tied to seismic after they have passed through rigorous rock-physics diagnostics, and in most cases, some modeling, Newton says. Such analysis is based on elastic equivalency theory, which she says, tries to determine bulk response of a given interval. If the seismic data and expected response differ, the interpreter must determine whether the issue is caused by noise, resolution, or any other parameter beyond the well domain. Advances in improving bandwidth should improve the well-tie process, Newton reasons.
Also, she says, longer offset seismic data begin to show AVO effect, and can be compared with well-derived synthetic seismograms. This enables a stronger calibration with the well data. “If we can find an effective model that can replicate the in situ response, we can better understand how rock properties may change seismic velocities,” Newton says.
With organic shale reservoirs, inclusion models (for example) can be used instead of granular ones because they allow the operator to model the matrix, which is typified by fine grains and crack-like pores, Newton says. Sometimes the shale is the host material and sometimes it is the total organic content. In addition, she says, there is a lot of vertical variability and very thin beds. The Marcellus can be so thin that the layers can be seen in logs, but not in seismic, Newton remarks.
She says the challenge is to calibrate all the data for the reservoir, come up with a bulk response, and try to predict it. “Even if your models aren’t good, that is the only thing you know,” Newton says. “If you cannot understand the rock at the well bore, what are your chances to accurately predict it laterally without well calibration?”
The ultimate goal is to characterize the reservoir. Integration between well and geophysical data is key to that, she concludes.
Risk Management
In the next 5-10 years, risk analysis is going to be front and center in geologic workflows everywhere, predicts Garrett Leahy, technical product manager at Roxar Software Solutions, a business unit of Emerson Process Management. Getting all the data into a risk analysis workflow is going to be essential for interpretation, he insists.
Risk analysis relies on assessments of uncertainty made by interpreters, Leahy notes. The more assessments made, the more robust risk management can be. He says uncertainty assessments captured across all data provide the basis for multiple realizations of the structural model, and for generating a risk distribution of volumes, economic factors, and probabilities of hitting particular faults, etc.
“The key is to have good data and uncertainty assessments from the very beginning that carry through the workflow to the final structural models and risk assessment,” he says.
This adds a new dimension to how the interpreter can look at uncertainty and manage risk, Leahy says.
The generalized workflow starts with seismic data interpreted in horizons and faults, with each assigned an uncertainty, he explains. This feeds into the model building process and multiple realizations of a structural model, where each realization is perturbed within the uncertainty envelop. Horizons and faults can be moved around within the envelope. Leahy says the volume of the reservoir then can be calculated for each realization, with the histogram of volume providing a probability distribution.
Interpreting Broadband
Leahy says bandwidth is a fundamental contributor to uncertainty. The typical seismic survey has limited bandwidth at both the low and high end of the frequency spectrum. Because of the importance of these frequencies for resolution and detecting complex geology, he says they are included wherever possible, even when the signal-to-noise ratio is low.
With higher broadband seismic, interpreters will have better quality high and low frequencies, enabling them to ascertain more reliable background trends and everything that follows. He says uncertainty still plays an important role in overall interpretation because there are always unknowable details. Leahy gives the example of peak frequency data, which typically are 30-40 Hz. “With this frequency, at best you are looking at a resolution of tens of meters,” he states. “Based on that data alone, you will never know whether your pick is accurate to within plus or minus 10 meters.”
He says the models are only as good as the background model: the low-frequency trend that interpreters put into their inversions. The accuracy of the inversion depends on the accuracy of that trend. Leahy says interpreters need to be cognizant of the ways they are introducing risk into their interpretations.
Measuring a best estimate (bold lines) and interpretation uncertainty (envelope) for faults and horizons enables geoscientists to estimate variability below the resolution of seismic data.
Increasing channel count has provided greater detail and added perspective for interpreters, Leahy goes on. “When multicomponent data are collected, we can build separate interpretations for p-wave and s-wave data,” he describes. “This challenges the interpreter to reconcile potentially conflicting interpretations into a model that fits all the data.”
Although added channels provide a better ability to reconstruct the wave field, they present a challenge in quality control. “When you have 100,000 channels, it is very hard to make sure you are not introducing bad data,” Leahy comments, saying new workflows for broad-band, high-channel-count data will be needed.
Several new techniques have emerged to help interpreters find meaning in the data. These techniques use what Leahy calls “clever” attributes that make faults or horizons pop out from the surrounding data.
For example, he says spectral decomposition assigns colors to different frequency bands, faults and horizons, providing a different way to look at data. Similarly, color blending combines three or four attribute cubes, each given an RGB (color model) coordinate, to see which part of the composite cube has high levels of each attribute. “These are clever ways to identify potential areas of interest,” Leahy concludes.
He says unprecedented data volumes are pushing technology to improve storage, retrieval and computing resources, which means interpreters need software that manages data better in all phases of the geosciences. “Building, updating, import/export, and processing are all logistical problems that interpretation software needs to improve,” he says.
Scale And Detail
Leahy argues the trend in data acquisition is clearly toward more and more detail: more channels, more offsets, and more frequency spectrum. The more data collected, the closer the interpreter gets to seeing what really is in the subsurface, he says.
Interpreters face two significant challenges as a result, Leahy suggests. The first is how to carry the detail discovered in the original data through to simulation. Seismic data are on the tens of meters scale, he points out, but geomodels typically are on a 50-100 meter scale and simulation models are on a 200-meter scale or more. The interpreter needs to identify key details that must be preserved versus data that are superfluous, says Leahy.
One approach is to combine the geologic model with the interpretation model. In this approach, Leahy says, the geomodel is built during the interpretation, and the uncertainty envelope represents unknown variability below the seismic resolution. “If you were building a single model, you could miss some detailed structure not visible in the data,” he observes. “However, using the uncertainty envelope, you can construct many realizations of the subsurface and get a distribution that captures fine scale detail as needed.”
The second challenge is in understanding the impact of interpretation on the business and adjusting accordingly, Leahy continues. As repeat surveys from multiple arrays become more common, for example, he says interpreters will need to do more interpretations in a given time. This will force them to focus on key objectives that provide the most useful information in the time available.
In shales, Leahy says, there is not much time allocated for detailed modeling. Instead, he says, it is more effective to do a quick analysis of faults and intervals, review surface geology and nearby well data, and then drill.
At the end of the day, all seismic related activity is aimed at contributing value to decision makers. “In both shales and conventional production, we will see a greater emphasis on using geophysics to optimize well placement and performance,” Leahy predicts. “Whether that is through detecting sweet spots, determining fracture capability, or fluid detection, the workflows of the future will better support decision making by including uncertainty estimates.”
For other great articles about exploration, drilling, completions and production, subscribe to The American Oil & Gas Reporter and bookmark www.aogr.com.